
In 2024, Walmart, the global retail behemoth, continues to command attention and dominate the retail landscape. Analysts are cautiously optimistic, predicting a modest bullish trend for Walmart stock. Some foresee a year-end target of $88, while others have bolder projections, aiming for $92 by the close of the year.
These forecasts reflect a positive outlook for Walmart’s performance in 2024, as the retail giant continues to leverage its formidable presence and adapt to changing market dynamics.
The article covers the following subjects:
Highlights and Key Points: Walmart Stock Forecast 2024–2030
- Currently, #WMT stock is trading at 69.19 US Dollars per share;
- In 2024 analysts predict the uprising in the Walmart shares — most of them expect the price to reach $80 – 90, most optimistic ones foresee $92, most pessimistic ones forecast $76.5;
- Predictions differ for 2025 — while CoinPriceForecast and GovCapital expect a rapid jump above $100 level in the second half of the year, others expect either significantly slower growth, or, in contrary, a decline;
- Evaluations also differ in 2026 — most optimistic forecasts see the asset price to breach $300, most pessimistic ones predict the price to drop by $60;
- According to long-term predictions, #WMT shares will either surge above $500, or crush to $50.
Walmart Stock Price Today Coming Days and Week
When forecasting Walmart stock in the near term, several key factors merit attention. Monitor quarterly earnings reports for insights into revenue, profit margins, and guidance, as they reflect the company’s financial health and growth prospects. Track consumer spending trends, particularly in the retail sector, as they directly impact Walmart’s sales. Keep abreast of online sales growth and competition from e-commerce giants like Amazon. Pay attention to macroeconomic indicators such as employment data and inflation rates, which influence consumer confidence and purchasing power. Additionally, stay updated on any strategic initiatives or acquisitions by Walmart that could impact its future performance.
Walmart Stock Price Forecast for 2024 — Experts Predictions
In 2024, the Walmart price, as indicated by CoinPriceForecast, will reach $89 – $92. Let’s have a look at what different agencies predict for Walmart stock.
StockAnalysis
Price range for 2024: $55 – $81 (as of July 15, 2024)
In the mid-year of 2024, according to StockAnalysis, the Walmart price is anticipated to reach an average of $71.61, with lowest and highest price levels being at $55 and $81 respectively.
| Year | Low, $ | Average, $ | High, $ |
|---|---|---|---|
| 2024 | 55 | 71.61 | 81 |
Coin Price Forecast
Price range for 2024: $67.46 – $89.67 (as of July 15, 2024)
CoinPriceForecast indicates that Walmart stock will reach $89.67 by the end of 2024.
| Year | Mid-Year, $ | Year-End, $ |
|---|---|---|
| 2024 | 67.46 | 89.67 |
Gov Capital
Price range for 2024: $60.86 – $92.36 (as of July 15, 2024)
In the mid-year of 2024, according to GovCapital, WMT stock is anticipated to trade around $63.37 and hit a $85.74 mark at the year-end.
| Month | Average, $ | Minimum, $ | Maximum, $ |
|---|---|---|---|
| August | 71.59 | 60.86 | 82.33 |
| September | 75.38 | 64.10 | 86.73 |
| October | 76.11 | 68.27 | 92.36 |
| November | 79.88 | 67.38 | 91.16 |
| December | 74.56 | 63.37 | 85.74 |
PandaForecast
Price range for 2024: $69.96 – $76.53 (as of July 15, 2024)
PandaForecast foresees quite optimistic outcome for #WMT stocks, with average price rising from $71.03 to $74.95 by the year’s end.
| Month | Average, $ | Low, $ | High, $ |
|---|---|---|---|
| August | 71.03 | 69.96 | 74.27 |
| September | 73.03 | 70.44 | 75.40 |
| October | 74.91 | 73.97 | 76.04 |
| November | 75.45 | 73.42 | 77.58 |
| December | 74.95 | 72.39 | 76.53 |
WalletInvestor
Price range for 2024: $70.981 – $73.363 (as of July 15, 2024)
As WalletInvestor forecast states, #WMT stock is in a side movement for the rest of 2024. By December, prices can reach $73.363, but the overall forecast promises nothing significant.
| Month | Opening, $ | Closing, $ | Minimum, $ | Maximum, $ |
|---|---|---|---|---|
| August | 72.471 | 72.756 | 72.117 | 72.774 |
| September | 72.707 | 71.224 | 71.224 | 72.998 |
| October | 71.399 | 73.079 | 70.981 | 73.079 |
| November | 73.083 | 73.650 | 73.061 | 73.905 |
| December | 73.233 | 72.108 | 71.358 | 73.363 |
LongForecast
Price range for 2024: $64.11 – $88.42 (as of July 15, 2024)
Overall, Walmart’s 2024 appears bullish, LongForecast suggests. Starting this June, prices are on a constant ascent with a few corrections.
| Month | Open, $ | Low–High, $ | Close, $ |
|---|---|---|---|
| August | 70.30 | 64.11-78.21 | 71.32 |
| September | 71.32 | 67.31-79.01 | 73.16 |
| October | 73.16 | 73.16-88.29 | 81.75 |
| November | 81.75 | 73.77-86.59 | 80.18 |
| December | 80.18 | 75.32-88.42 | 81.87 |
Walmart Stock Technical Analysis
Let’s use several time frames and tools to perform a technical analysis of Walmart stock. The daily (D1) and weekly (W1) charts will help assess long-term trends and determine key support and resistance levels.
The main technical analysis tools for Walmart stock are trend lines, moving averages (SMA, EMA), and Fibonacci retracement levels. Trend lines can help identify the current direction of price movement. Moving averages, such as the 50-day and 200-day SMAs, provide insight into long-term trends and potential pivot points.
Among the indicators worth mentioning are the RSI (Relative Strength Index) and MACD (Moving Average Convergence Divergence). The RSI gauges the overbought or oversold market condition, allowing you to predict possible trend reversals. MACD confirms trend strength and identifies market entry/exit points.
“Head and shoulders” and “Double bottom” chart patterns are also useful for analyzing Walmart stock. These patterns signal possible trend reversals and provide clear signals for trading decisions.
Get access to a demo account on an easy-to-use Forex platform without registration
#WMT Stock Analysis For Next Three Months
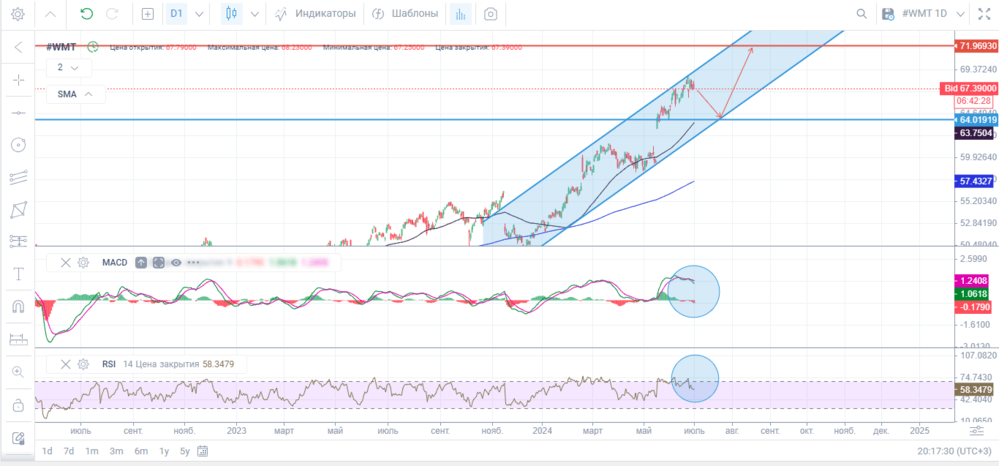
Technical analysis of Walmart (#WMT) stock for the next three months on the daily timeframe shows that the current trend may continue with possible corrections.
The daily chart (D1) shows short-term market cycles with periodic corrections. The support levels are located near the 50-day SMA at $64.00. The resistance level is near the 200-day SMA at $58.00. The RSI (Relative Strength Index) and MACD (Moving Average Convergence Divergence) indicators confirm a correction. The RSI is in the overbought zone; the signal lines move downward, indicating a looming correction.
The MACD histogram is in the negative zone. The indicator’s signal lines are declining.
Long-Term Walmart Shares Technical Analysis for 2024
The analysis of Walmart (#WMT) stock for 2024 requires examining long-term trends using monthly (M1) and weekly (W1) time frames.
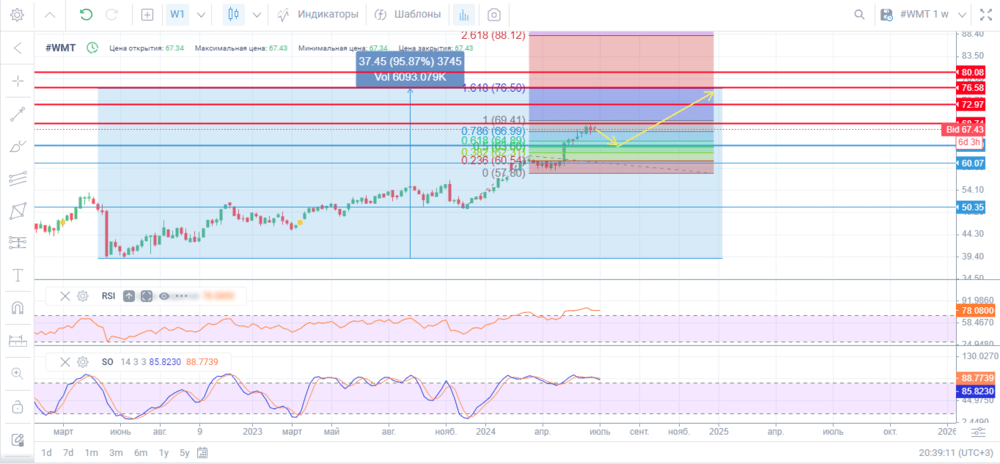
Weekly chart: Walmart (WMT) stock is showing a steady uptrend after a correction in early 2023. The moving averages (50-week and 200-week SMAs) indicate that the current trend is strengthening.
The technical analysis confirms that the price is highly likely to reach the $77 level within the current uptrend, representing a 96% gain. A similar trend was observed for the stock in the two previous bullish waves before deep corrections. The Fibonacci extensions also point to this scenario, with the current $77 target coinciding with the 1.618 level.
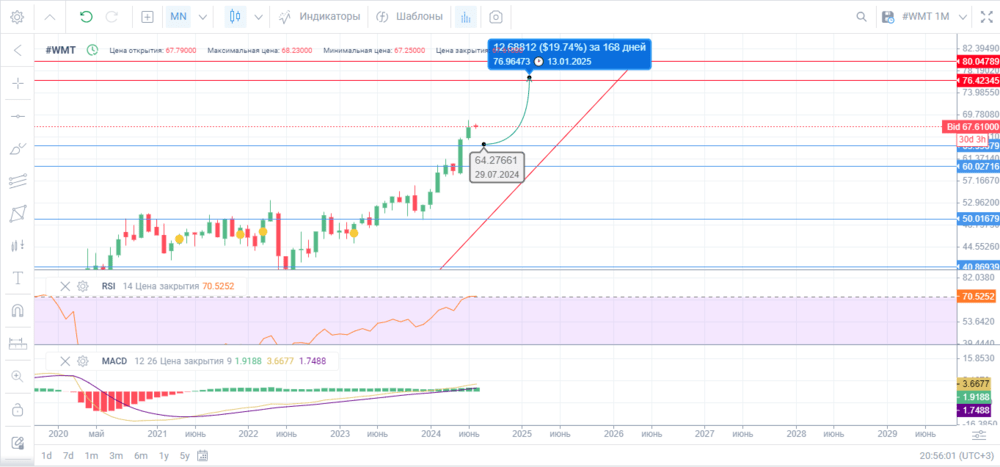
Monthly chart: Walmart stock maintains a strong uptrend with well-defined moving averages. Volatility is relatively low, pointing to a stable price movement.
| Month | Walmart Inc. (#WMT) Projected Values | |
|---|---|---|
| Minimum, $ | Maximum, $ | |
| August | 69.00 | 72.50 |
| September | 71.70 | 73.00 |
| October | 70.10 | 72.20 |
| November | 72.20 | 75.00 |
| December | 76.00 | 76.60 |
Long-Term Trading Plan for Walmart Inc. (#WMT)
There are two scenarios to consider for the trading plan. Each takes into account key factors that could affect the Walmart (WMT) stock price in the US stock market.
3-month targets:
- Price range: $64.20–$72.50
- Target areas:
- Long trades can be opened if the stock price declines to the $64.20–$65.00 range.
- A take-profit order should be placed at $72.00.
- A stop-loss order can be set just below the minimum price of $64.00 to protect your trade from significant losses if the price drops sharply.
- An alternative scenario assumes selling the instrument if the price plunges below $64.00.
Trading plan for 2024
- Price range: $70.10–$77.60
- Target areas:
- Long trades can be initiated on corrections or once the price declines to the area of $70.10–$71.20.
- A take-profit order can be placed at the upper boundary of $77.60.
- An alternative scenario suggests selling the WMT stock at $70.10 after it decreases below $73.00.
Walmart Price Predictions for 2025
As we near 2025, financial analysts and platforms are closely monitoring the path of Walmart stock, a major player in the retail sector. Various platforms employ their unique methodologies and insights to provide a more accurate snapshot of future price movements.
CoinPriceForecast
Price range for 2025: $98.28 – $127.76 (as of July 15, 2024)
Looking ahead to 2025, CoinPriceForecast expects the stock to rise to $98.28 in the first half of the year, and then to skyrocket to $127.76 in December.
| Year | Mid-Year, $ | Year-End, $ |
|---|---|---|
| 2025 | 98.28 | 127.76 |
GovCapital
Price range for 2025: $41.00 – $202.06 (as of July 15, 2024)
GovCapital provides a similar view of a Walmart stock outlook for 2025. They anticipate a major burst with prices jumping from around $41 to above $200. The stock price ranges from a low of $41 to a high of around $202.
| Month | Average, $ | Minimum, $ | Maximum, $ |
|---|---|---|---|
| January | 76.16 | 64.74 | 87.59 |
| February | 75.40 | 64.57 | 87.36 |
| March | 47.66 | 41.00 | 55.48 |
| April | 54.86 | 47.19 | 63.84 |
| May | 52.36 | 44.50 | 60.21 |
| June | 50.93 | 43.29 | 58.57 |
| July | 116.25 | 98.81 | 133.69 |
| August | 165.73 | 140.87 | 190.59 |
| September | 171.49 | 145.76 | 197.21 |
| October | 172.55 | 146.67 | 198.43 |
| November | 175.70 | 149.35 | 202.06 |
| December | 170.17 | 144.64 | 195.69 |
PandaForecast
Price range for 2025: $75.62 – $87.88 (as of July 15, 2024)
A bullish trend for 2025 is predicted by PandaForecast. Analysts expect some corrections, but the averages will be climbing from $77.34 to $85.07.
| Month | Average, $ | Low, $ | High, $ |
|---|---|---|---|
| January | 77.34 | 75.62 | 78.50 |
| February | 79.33 | 77.43 | 82.90 |
| March | 81.05 | 78.18 | 84.35 |
| April | 81.83 | 80.40 | 84.03 |
| May | 82.02 | 80.20 | 85.57 |
| June | 82.81 | 80.13 | 85.49 |
| July | 78.34 | 77.40 | 80.73 |
| August | 80.59 | 77.74 | 81.85 |
| September | 84.37 | 83.35 | 86.09 |
| October | 82.24 | 80.96 | 85.20 |
| November | 83.08 | 81.78 | 84.13 |
| December | 85.07 | 82.83 | 87.88 |
WalletInvestor
Price range for 2025: $60.936 – $72.290 (as of July 15, 2024)
According to WalletInvestor, 2025 for #WMT promises nothing but a bearish movement. Despite some strong fluctuations during the year, the price in December will decline to around $67 – $68 levels.
| Month | Opening, $ | Closing, $ | Minimum, $ | Maximum, $ |
|---|---|---|---|---|
| January | 72.159 | 71.603 | 71.170 | 72.290 |
| February | 71.674 | 63.946 | 63.946 | 71.991 |
| March | 62.480 | 64.203 | 60.936 | 64.203 |
| April | 64.530 | 65.381 | 64.504 | 65.431 |
| May | 65.274 | 62.551 | 62.199 | 65.274 |
| June | 62.600 | 61.846 | 61.608 | 62.954 |
| July | 62.226 | 67.663 | 62.226 | 67.704 |
| August | 67.616 | 67.899 | 67.311 | 67.913 |
| September | 67.859 | 66.675 | 66.510 | 68.206 |
| October | 66.594 | 68.210 | 66.167 | 68.210 |
| November | 68.202 | 68.917 | 68.202 | 69.123 |
| December | 68.549 | 67.271 | 66.510 | 68.693 |
LongForecast
Price range for 2025: $78.14 – $117.33 (as of July 15, 2024)
LongForecast’s prediction for 2025 is bullish. Experts suggest that the stock will open at $81.87 in January and close the year at $107.43 in December. October will see the major breakout to the levels above $117.
| Month | Open, $ | Low–High, $ | Close, $ |
|---|---|---|---|
| January | 81.87 | 78.14-91.74 | 84.94 |
| February | 84.94 | 83.43-97.93 | 90.68 |
| March | 90.68 | 85.21-100.03 | 92.62 |
| April | 92.62 | 86.57-101.63 | 94.10 |
| May | 94.10 | 89.25-104.77 | 97.01 |
| June | 97.01 | 89.48-105.04 | 97.26 |
| July | 97.26 | 90.86-106.66 | 98.76 |
| August | 98.76 | 91.97-107.97 | 99.97 |
| September | 99.97 | 93.44-109.70 | 101.57 |
| October | 101.57 | 97.41-114.35 | 105.88 |
| November | 105.88 | 99.95-117.33 | 108.64 |
| December | 108.64 | 98.84-116.02 | 107.43 |
Walmart Price Predictions for 2026
In 2026, some of Walmart’s stock price predictions suggest growth, with expectations of a steady climb reflective of the retail giant’s market resilience and strategic initiatives. CoinPriceForecast expects a more modest and gradual rise, while GovCapital expects WMT stock to skyrocket to $250 or higher.
CoinPriceForecast
Price range for 2026: $112.99 – $141.75 (as of July 15, 2024)
As CoinPriceForecast suggests, a notable upward trend is expected for Walmart stock. The outlook suggests that Walmart will reach $139.32 in the first half of the year, and climb to $141.75 by year-end.
| Year | Mid-Year, $ | Year-End, $ |
|---|---|---|
| 2026 | 139.32 | 141.75 |
GovCapital
Price range for 2026: $112,45 – $343.44 (as of July 15, 2024)
GovCapital envisions Walmart stock reaching approximately $300 by the end of 2026. By spring, the major drop is projected, but then the price is expected to skyrocket in summer, breaching the $300 level on maximum.
| Month | Average, $ | Minimum, $ | Maximum, $ |
|---|---|---|---|
| January | 171.82 | 146.05 | 197.59 |
| February | 172.39 | 147.15 | 199.09 |
| March | 132.43 | 112.99 | 152.87 |
| April | 137.33 | 117.29 | 158.68 |
| May | 138.37 | 117.62 | 159.13 |
| June | 141.24 | 120.06 | 162.43 |
| July | 225.37 | 191.56 | 259.17 |
| August | 289.50 | 246.07 | 332.92 |
| September | 295.53 | 251.20 | 339.86 |
| October | 296.39 | 251.93 | 340.84 |
| November | 298.64 | 253.85 | 343.44 |
| December | 292.95 | 249.01 | 336.90 |
PandaForecast
Price range for 2026: $81.05 – $93.59 (as of July 15, 2024)
Analysts at PandaForecast are expecting a bullish movement in 2026, though with some fluctuations along the way. Starting at $86.40, the price will drop to $84.32 by mid-spring, but then will climb to $90.39 by December.
| Month | Average, $ | Low, $ | High, $ |
|---|---|---|---|
| January | 86.40 | 82.62 | 90.13 |
| February | 89.04 | 86.48 | 92.14 |
| March | 85.09 | 83.20 | 86.67 |
| April | 84.32 | 81.29 | 87.51 |
| May | 85.13 | 81.05 | 86.36 |
| June | 87.33 | 84.71 | 89.90 |
| July | 88.95 | 86.93 | 91.41 |
| August | 87.99 | 86.20 | 90.05 |
| September | 89.52 | 87.70 | 92.43 |
| October | 89.79 | 86.13 | 91.57 |
| November | 90.22 | 86.87 | 92.82 |
| December | 90.39 | 87.57 | 93.59 |
WalletInvestor
Price range for 2026: $56.224 – $67.492 (as of July 15, 2024)
In 2026, Walmart stock is on a decline, as WalletInvestor’s forecast suggests. Notable drops are expected in March, June and October. The price will drop below its January levels by the end of the year.
| Date | Opening, $ | Closing, $ | Minimum, $ | Maximum, $ |
|---|---|---|---|---|
| January | 67.285 | 66.694 | 66.313 | 67.492 |
| February | 66.781 | 59.767 | 59.767 | 67.136 |
| March | 58.180 | 59.612 | 56.224 | 59.612 |
| April | 59.690 | 60.533 | 59.673 | 60.645 |
| May | 60.435 | 57.661 | 57.358 | 60.435 |
| June | 57.710 | 57.249 | 56.869 | 58.185 |
| July | 57.369 | 62.806 | 57.369 | 62.870 |
| August | 62.642 | 63.006 | 62.512 | 63.052 |
| September | 63.284 | 61.873 | 61.808 | 63.402 |
| October | 61.752 | 63.328 | 61.375 | 63.328 |
| November | 63.339 | 63.845 | 63.339 | 64.322 |
| December | 64.005 | 62.395 | 61.685 | 64.005 |
LongForecast
Price range for 2026: $102.51 – $197.25 (as of July 15, 2024)
According to LongForecast, #WMT stock price will surge in 2026. By November it will almost reach $200 but slide to $179.14 in December. Overall, the outlook is bullish, which is good news for #WMT investors.
| Month | Open, $ | Low–High, $ | Close, $ |
|---|---|---|---|
| January | 107.43 | 102.51-120.33 | 111.42 |
| February | 111.42 | 111.42-133.27 | 123.40 |
| March | 123.40 | 110.39-129.59 | 119.99 |
| April | 119.99 | 106.06-124.50 | 115.28 |
| May | 115.28 | 113.49-133.23 | 123.36 |
| June | 123.36 | 119.74-140.56 | 130.15 |
| July | 130.15 | 121.94-143.14 | 132.54 |
| August | 132.54 | 127.47-149.63 | 138.55 |
| September | 138.55 | 138.55-172.08 | 159.33 |
| October | 159.33 | 150.37-176.53 | 163.45 |
| November | 163.45 | 163.45-197.25 | 182.64 |
| December | 182.64 | 164.81-193.47 | 179.14 |
Walmart: Price History
Historical trends provide insights into future asset prices. Examining Walmart stock over the past three years offers a glimpse into its performance. In 2018, despite peaking at $109.98, the stock faced challenges, declining to $81.81 by June, with concerns about the company’s digital strategy.
In 2019, the stock rebounded, but events like store shootings temporarily affected its value. In 2020, amidst the COVID-19 pandemic, Walmart introduced the Walmart+ membership and capitalized on changing consumer behaviors, reaching a high of $152.95 in November.
However, a lawsuit by the US Department of Justice over the opioid crisis impacted the stock negatively. By 2021, with positive earnings, the stock showed signs of recovery.
In 2022, Walmart stock faced volatility due to global supply chain issues, inflation, and changing post-pandemic consumer habits. However, its focus on e-commerce and grocery/delivery service expansion mitigated deeper declines. Average stock price in 2022 was $135.03.
In 2023, the stock began stabilizing and growing moderately, bolstered by ongoing digital investments and its large retail presence. The average stock price reached $151.92. The company’s adaptation to the changing retail environment, including a shift to online shopping and hybrid models, positively influenced its stock.
Long-Term Walmart Predictions 2026-2030
CoinPriceForecast’s outlook for Walmart stock price spanning from 2026 to 2030 showcases a persistent upward trajectory. Beginning with an average of $142.5 in 2026, the predictions foresee annual gains, culminating in an average of $201.91 by 2030. This implies prospective growth over five years.
CoinPriceForecast
CoinPriceForecast paints a very optimistic picture for #WMT stocks. Uptrend continues up to 2030, with prices steadily climbing up to $202.
| Year | Mid-Year, $ | End-Year, $ |
|---|---|---|
| 2027 | 142.48 | 146.53 |
| 2028 | 156.73 | 160.74 |
| 2029 | 173.10 | 177.96 |
| 2030 | 191.22 | 201.91 |
GovCapital
Experts at GovCapital suggest that the prices will grow during 2027-2028. The average price will rise up to approximately $507 in 2028.
| Year | Average, $ | Minimum, $ | Maximum, $ |
|---|---|---|---|
| 2027 | 353,39 | 318,33 | 430,68 |
| 2028 | 507,42 | 431,30 | 583,53 |
PandaForecast
As PandaForecast suggests, 2027 and 2028 promise to be quite bullish for #WMT. It is expected that the asset will be established above $100 level.
| Year | Average, $ | Minimum, $ | Maximum, $ |
|---|---|---|---|
| 2027 | 97.83 | 95.29 | 100.46 |
| 2028 | 112.27 | 109.07 | 115.86 |
WalletInvestor
WalletInvestor anticipates a decline in Walmart stock prices during 2027–2028. A decline of 2025–2026 will continue affecting both lowest and highest price levels. It is expected that an average price will drop to $52 in 2028.
| Year | Average, $ | Minimum, $ | Maximum, $ |
|---|---|---|---|
| 2027 | 56.82 | 55.59 | 58.05 |
| 2028 | 51.97 | 50.70 | 53.25 |
Factors That Can Affect the Walmart Price
Several factors influence stock price volatility, including a company’s financial outlook, global investor sentiment, demand/supply dynamics, and internal news. As the world’s largest retailer, retail industry events significantly impact Walmart’s stock. Critical drivers for Walmart shares include:
- Earnings Reports: Walmart stock often reacts to quarterly earnings, with positive reports boosting its value.
- International Business: Operating in 24 countries and sourcing from over 100, Walmart’s international strategies, like its 2021 focus on India, can sway its stock price.
- Competition: Walmart’s growth in US e-commerce has outpaced Amazon, its primary competitor. Innovations like Walmart+ and enhanced return policies further bolster its market position.
- Gun Issues: Incidents at Walmart stores, especially shootings, can affect its stock. Proactive safety measures can mitigate these effects.
- Flipkart IPO: Walmart’s subsidiary, Flipkart, is set for a US IPO in late 2021, potentially valuing Walmart at $45–$50 billion.
Conclusion: Is Walmart a Good Investment?
Walmart stock price predictions, as provided by Coin Price Forecast, suggest a promising upward trajectory from 2026 to 2030. With a projected growth of approximately 116% over these five years, the retail giant is on a stable path of appreciation.
Such consistent growth, combined with Walmart’s established market presence and adaptability to changing market dynamics, indicates that it remains a strong investment player.
While all investments have inherent risks, the data suggests that Walmart could be a solid addition to a diversified portfolio. However, potential investors should always research and consult with financial advisors before making investment decisions.
FAQs on Walmart Price Prediction
As of today, 15.07.2024, the price of Walmart stock is $69.19.
Forecasts from sources like CoinPriceForecast and GovCapital indicate a steady rise in Walmart stock between 2026 and 2030.
Most analysts predict an upward trend for Walmart stock in 2024, with prices ranging between $76.53 and $92.36. The company’s steady sales growth and strategic investments in e-commerce and technological innovation will contribute to its market value. Experts also note that successfully expanding its store network and improving logistics infrastructure will be vital to achieving these projected prices.
Analysts at CoinPriceForecast and GovCapital forecast Walmart stock to rise rapidly in 2025, with prices ranging from $117.33 to $202.06. The other forecasts 2025 suggest a more modest growth with a potential high around $88. According to data from WalletInvestor, Walmart’s price could drop to $61.
According to forecasts, Walmart’s price may rise to $584. This is due to the company’s active development in international markets and the introduction of new technologies in logistics and inventory management, which increase efficiency and reduce operating costs.
While predictions suggest an upward trajectory, potential investors should conduct their research and consult financial advisors before making decisions.
A long-term investment in Walmart can be an attractive option as it has shown consistent revenue and earnings growth over the years. The company is actively expanding its markets and businesses, including online shopping. Walmart has a strong balance sheet and high solvency, which reduces risk for investors.
The valuation of Walmart stock depends on various market factors and analyst opinions. It is essential to consult comprehensive financial analyses for a definitive answer.
Walmart’s expansion, especially in international markets, could bolster its stock as it taps into new revenue streams and customer bases. Walmart is actively investing in AI technology and increasing its share of e-commerce.
Inflation and consumer spending can influence Walmart stock by affecting purchasing power and retail demand. Significant inflation might dampen consumer spending, potentially impacting Walmart’s revenues.
Price chart of WMT in real time mode

The content of this article reflects the author’s opinion and does not necessarily reflect the official position of LiteFinance. The material published on this page is provided for informational purposes only and should not be considered as the provision of investment advice for the purposes of Directive 2004/39/EC.
{{value}} ( {{count}} {{title}} )
This post is originally published on LITEFINANCE.