The USDCNH pair’s decline can be attributed to the growing popularity of the yuan in international settlements, the reduction in the number of carry trade transactions, and the shifting focus away from the Trump trade. However, all things must eventually come to an end. Let’s discuss this topic and make a trading plan.
The article covers the following subjects:
Highlights and key points
- Reduction in bond yield differential has inspired the yuan.
- The effect of the carry trade withdrawal on the renminbi is limited.
- China’s economy may weaken further due to trade wars.
- Buying the USDCNH pair during falling knives is unprofitable. It is better to wait for the pair to reach above 7.107.
Monthly yuan fundamental forecast
The yen’s rapid appreciation in response to the significant reduction in carry trade transactions caught the attention of USDCNH bears, leading to a 2.6% decline in the pair’s value. In addition, the yuan serves as a funding currency, and its comparatively modest strengthening contrasts with that of the Japanese yen due to differing monetary policy magnitudes and the PBoC’s more accommodative stance.
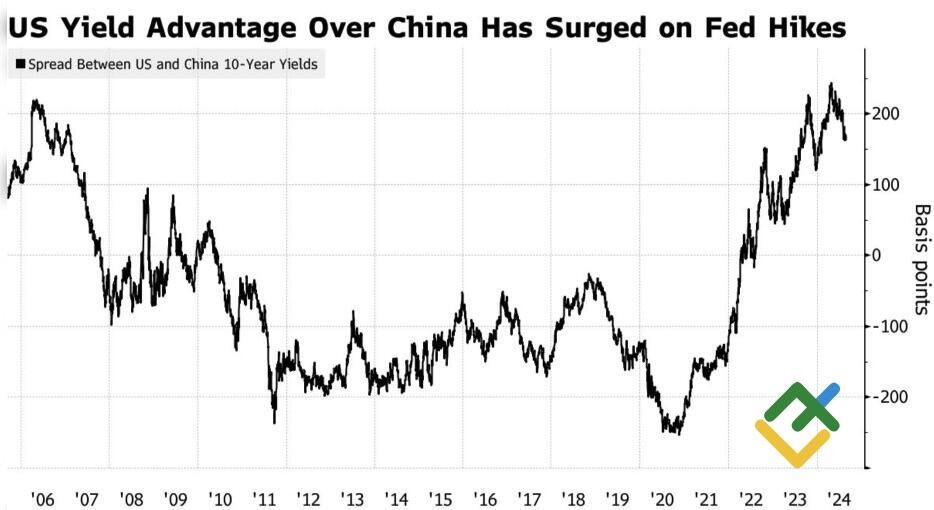
The challenging economic outlook for China has prompted exporters and international businesses to purchase US dollars. Macquarie estimates that the accumulation stands at approximately $500 billion since 2022. Eurizon SLJ Capital puts the figure at $1 trillion and suggests that the return of capital to China will likely drag the USDCNH pair down by 10%. This process was initiated by a narrowing of the US-China bond yield differential, driven by the Fed’s intention to cut rates.
US and China government bond yields spread
Source: Bloomberg.
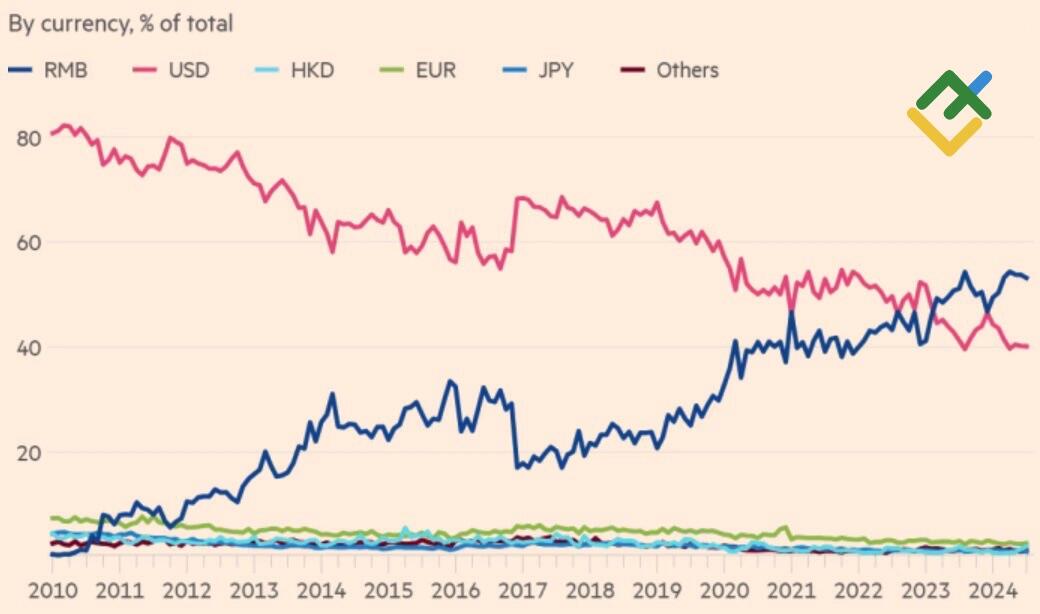
The winding down of carry trade operations and the narrowing yield spread are not the only factors behind the yuan’s appreciation. Just as dedollarization puts pressure on the USD index, the growing share of the renminbi in international payments increases demand for this currency. Its use in cross-border transactions has reached a record high of 53%. In comparison, a year ago, the figure was 40%.
Share of renminbi and other currencies in international settlements
Source: Financial Times.
The waning influence of the Trump trade is benefiting those with a bearish outlook on the USDCNH pair. The Republican Party’s return to the White House has caused concern in Beijing due to Trump’s promises to raise import duties, which could result in a renewed trade war. The growing popularity of the Democratic candidate is viewed as the optimal choice for China and its currency.
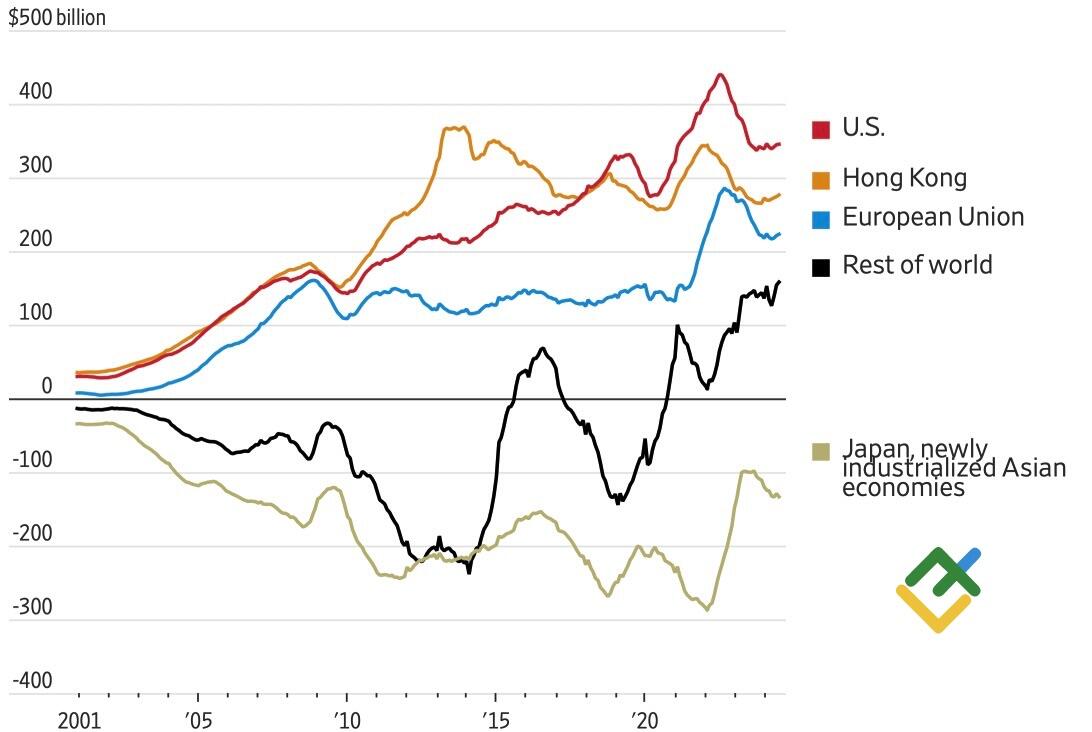
It is evident that both Donald Trump and Kamala Harris present significant challenges for China. According to research from the Rhodium Group, China accounts for 13% of global consumption and 28% of investment. These investments are only viable if Beijing can gain market share by elbowing other countries. China’s reliance on export growth to drive domestic demand is evident in its consistently increasing trade balance.
China’s foreign trade with other countries
Source: Wall Street Journal.
The current wave of discontent in the United States carries the risk of triggering a new round of trade wars, which could further weaken the already fragile Chinese economy. UBS has revised its GDP forecast for 2024 from 4.9% to 4.6% and for 2025 from 4.6% to 4%, citing slowing consumer spending and the government’s reluctance to fully utilize fiscal stimulus.
Monthly USDCNH trading plan
The vulnerability of Asia’s largest economy and the increase in the differential between the US and Chinese bond yield will lead to a pullback in the USDCNH pair. It is not worth buying the pair during falling knives, so it makes sense to open long trades if the pair returns above 7.107.
Price chart of USDCNH in real time mode
The content of this article reflects the author’s opinion and does not necessarily reflect the official position of LiteFinance. The material published on this page is provided for informational purposes only and should not be considered as the provision of investment advice for the purposes of Directive 2004/39/EC.
{{value}} ( {{count}} {{title}} )
This post is originally published on LITEFINANCE.


