The article covers the following subjects:
Major Takeaways
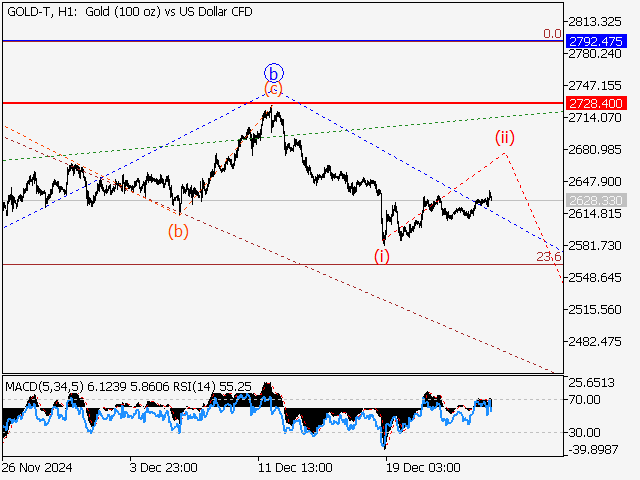
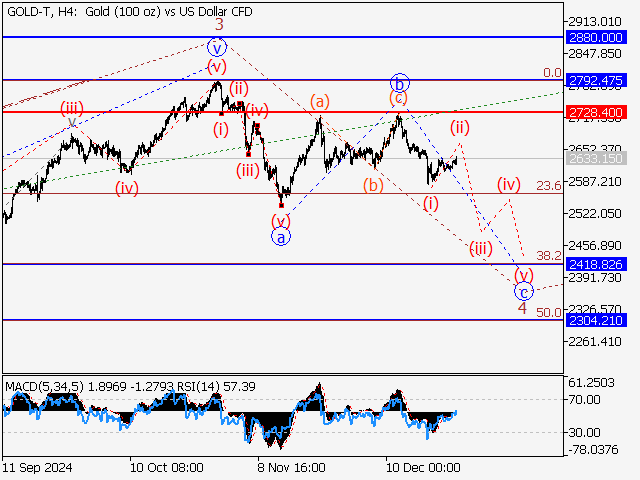
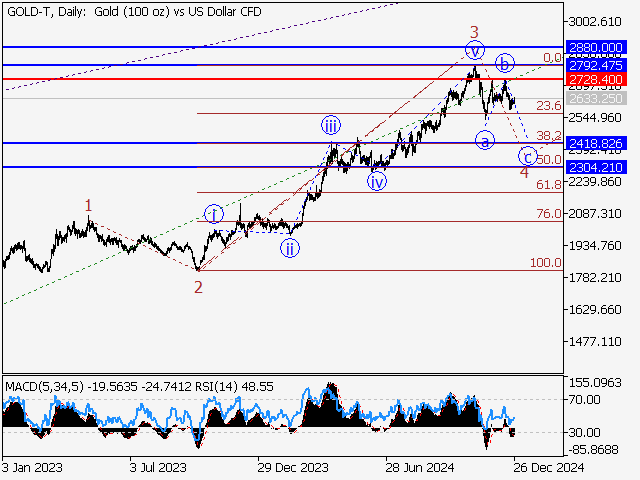
- Main scenario: After the correction ends, consider short positions below the level of 2728.40 with a target of 2418.82 – 2304.21. A sell signal: the price holds below 2728.40. Stop Loss: above 2735, Take Profit: 2418.82 – 2304.21.
- Alternative scenario: Breakout and consolidation above the level of 2728.40. will allow the asset to continue rising to the levels of 2792.47 – 2880.00. A buy signal: the level of 2728.40 is broken to the upside. Stop Loss: below 2720.00, Take Profit: 2792.47 – 2880.00.
Main Scenario
Consider short positions below the level of 2728.40 with a target of 2418.82 – 2304.21 once a correction is completed.
Alternative Scenario
Breakout and consolidation above the level of 2728.40 will allow the pair to continue rising to the levels of 2792.47 – 2880.00.
Analysis
The fifth wave of larger degree (5) is presumably developing on the daily chart, with wave 3 of (5) formed as its part. Apparently, a descending correction is developing as the fourth wave 4 of (5) on the H4 chart, with waves a of 4 and b of 4 formed as its parts. Wave c of 4 has started developing on the H1 chart, within which the first wave of smaller degree (i) of c has formed and a local corrective wave (ii) of c is unfolding. If the presumption is correct, XAU/USD will continue falling to 2418.82 – 2304.21 after the correction is over. The level of 2728.40 is critical in this scenario as a breakout will enable the pair to continue rising to the levels of 2792.47 – 2880.00.
Price chart of XAUUSD in real time mode
The content of this article reflects the author’s opinion and does not necessarily reflect the official position of LiteFinance. The material published on this page is provided for informational purposes only and should not be considered as the provision of investment advice for the purposes of Directive 2004/39/EC.
{{value}} ( {{count}} {{title}} )
This post is originally published on LITEFINANCE.


