The article covers the following subjects:
Key takeaways
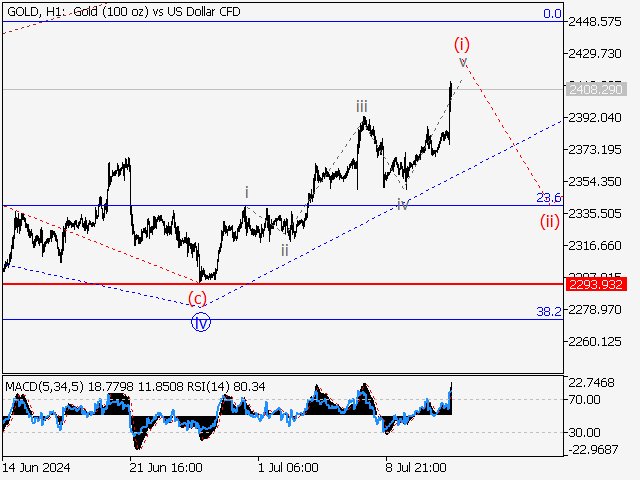
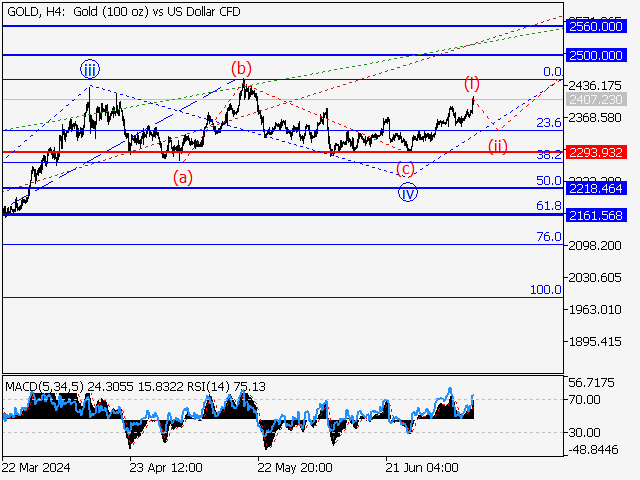
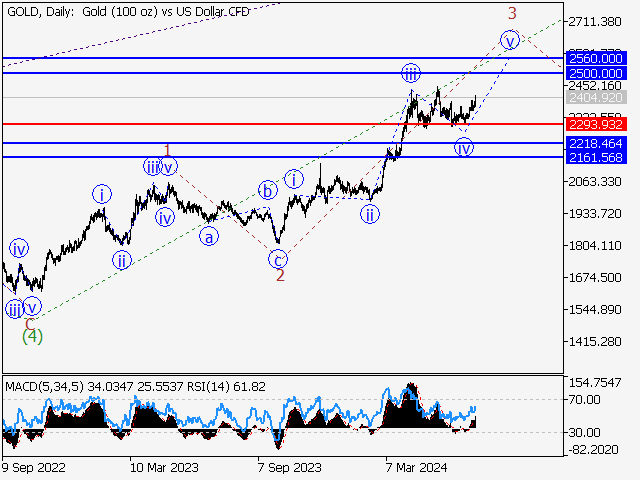
- Main scenario: consider long positions from corrections above the level of 2293.93 with a target of 2500.00 – 2560.00. A buy signal: after the level of 2293.93 is broken. Stop Loss: 2250.00, Take Profit: 2560.00.
- Alternative scenario: breakout and consolidation below the level of 2293.93 will allow the pair to continue declining to the levels of 2218.46 – 2161.56. A sell signal: after the level of 2293.93 is broken. Stop Loss: 2330.00, Take Profit: 2161.56.
Main scenario
Consider long positions from corrections above the level of 2293.93 with a target of 2500.00 – 2560.00.
Alternative scenario
Breakout and consolidation below the level of 2293.93 will allow the pair to continue declining to the levels of 2218.46 – 2161.56.
Analysis
The fifth wave of larger degree 5 is presumably developing on the daily chart, with wave 3 of 5 forming as its part. Apparently, the third wave of smaller degree iii of 3 has formed on the H4 time frame, and a local correction finished developing as the fourth wave iv of 3. The fifth wave v of 3 started developing on the H1 time frame, with wave (i) of v formed as its part. If the presumption is correct, the XAUUSD pair will continue to rise to the levels of 2500.00 – 2560.00 once a local correction (ii) of v ends. The level of 2293.93 is critical in this scenario as a breakout will allow the pair to continue falling to the levels of 2218.46 – 2161.56.
Price chart of XAUUSD in real time mode
The content of this article reflects the author’s opinion and does not necessarily reflect the official position of LiteFinance. The material published on this page is provided for informational purposes only and should not be considered as the provision of investment advice for the purposes of Directive 2004/39/EC.
{{value}} ( {{count}} {{title}} )
This post is originally published on LITEFINANCE.


