
Gold has always held a special place in the world of finance and investment. Since the end of the Gold Standard in 1971, gold has made six major breakouts. Notably, only two of these breakouts retested the breakout levels. These instances occurred during the all-time highs in 1978 and 2009. This article will delve into these historical breakouts, corrections, and the impact on precious metals. We will also explore the significance of the moving average in predicting gold’s performance.
Gold’s Major Breakouts: A Retrospective
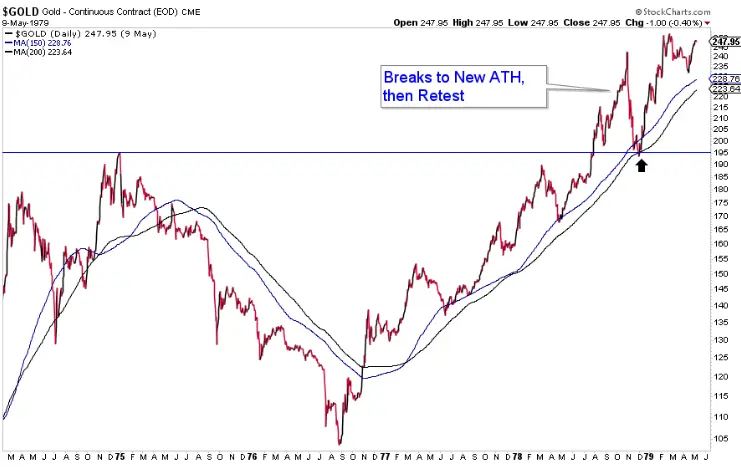
Gold’s journey from 1971 has been remarkable. The first significant breakout came in 1978. From its low in 1976, gold gained an impressive 136% by the time it broke out in 1978. Post-breakout, gold experienced a 25% increase before encountering its first correction. This correction saw a 20% decline, where gold found support at the 200-day moving average. Interestingly, this period also saw gold bottoming near the 38% retracement level.
The second notable breakout occurred in 2009. From its low in 2008, gold surged 80% to reach its breakout in 2009. The post-breakout period witnessed a 21% gain before the first correction. During this correction, gold declined by 15% and bottomed at its 150-day moving average. These historical patterns highlight the significance of the moving average in gold’s performance.
Analyzing the 1978 Gold Breakout
In 1978, gold demonstrated exceptional resilience. The 136% gain from 1976 to 1978 was extraordinary. Investors saw significant returns during this period. The breakout was followed by a strong 25% increase. However, like any financial asset, gold faced a correction. The correction brought gold down by 20%. Despite this decline, the moving average provided strong support.
The 200-day moving average acted as a crucial support level. Investors closely monitored this indicator. Gold bottomed near the 38% retracement level. This retracement level further reinforced the support. The correction period, though challenging, was essential. It allowed gold to consolidate and prepare for future gains. Investors who understood these patterns benefited greatly.
Examining the 2009 Gold Breakout
The 2009 breakout was another milestone in gold’s history. From its low in 2008, gold gained an impressive 80%. This period marked a significant recovery. The breakout saw a subsequent 21% increase. However, similar to 1978, a correction followed. This correction saw gold decline by 15%. Despite the decline, the 150-day moving average provided support.
The moving average once again played a pivotal role. Gold bottomed at this level, indicating strong support. Investors closely watched these indicators. The patterns observed in 2009 mirrored those of 1978. The corrections, though temporary, were crucial. They provided opportunities for consolidation and future growth.
The Role of Precious Metals in Market Stability
Gold, along with other precious metals, plays a crucial role in market stability. During times of economic uncertainty, precious metals serve as a safe haven. The 1978 and 2009 breakouts highlighted this trend. Investors turned to gold to safeguard their investments. The performance of gold during these periods was noteworthy.
Precious metals, including gold, exhibit strong performance during financial crises. They provide a hedge against market volatility. The historical performance of gold underscores its reliability. Investors who diversified their portfolios with precious metals saw significant benefits. This trend continues to hold true today.
The Recent Performance of Gold
Let’s now examine gold’s recent performance. From its low in 2022 to the recent peak, gold gained 50%. The post-breakout gain was 18%. However, gold has since corrected by 6%. Currently, it threatens to break below $2300. A test of $2150-$2175 would mean an 11%-12% correction. If gold loses $2300, a retest of $2100-$2150 is quite likely. Despite potential technical damage, investors should not worry.
Analyzing Gold’s 2022-2024 Trends
Gold’s performance between 2022 and 2024 has been intriguing. Initially, gold experienced a strong rally from its 2022 low. This surge led to a 50% gain, demonstrating gold’s potential during uncertain times. The breakout following this rally resulted in an 18% gain. However, no asset climbs without encountering corrections. Consequently, gold corrected by 6%, raising concerns among investors.
Despite the correction, gold remains above critical levels. The threat of breaking below $2300 looms. A potential test of $2150-$2175 would indicate an 11%-12% correction. Historically, gold has shown resilience in similar scenarios. Investors should note that precious metals often rebound strongly after corrections. The current situation presents a similar opportunity.
If gold does break below $2300, a retest of $2100-$2150 is likely. This possibility might worry some investors. However, historical patterns suggest this correction could be beneficial. After previous corrections, gold has demonstrated substantial gains. Therefore, understanding these patterns is crucial.
Historical Patterns and Future Prospects
Historical data supports the resilience of gold during corrections. In 1978, after retesting its breakout, gold gained 122% in 13 months. Similarly, in 2009, gold gained 63% in 13 months after its retest. These historical trends offer valuable insights into gold’s potential future performance.
Precious metals, including gold, often thrive during economic slowdowns. If the US economy continues to slow, the odds of rate cuts will increase. Consequently, gold and other precious metals will likely see a resurgence. Investors should consider these factors when evaluating their portfolios. The current correction might be a strategic buying opportunity.
Precious metals have consistently provided a hedge against economic instability. Gold, in particular, has shown strong performance during market downturns. This resilience makes it a valuable asset for investors seeking stability. As gold navigates its current phase, historical patterns provide a roadmap for future gains.
Strategic Investment Opportunities
Investors should view the current correction as a strategic opportunity. Precious metals, especially gold, have a history of rebounding strongly. The potential for future gains remains high. By understanding historical trends, investors can make informed decisions. The 6% correction, though concerning, is not unprecedented. Similar patterns have led to significant gains in the past.
Moreover, if the US economy slows further, the likelihood of rate cuts will rise. This scenario would boost gold and other precious metals. Historical data reinforces this outlook. After significant corrections, gold has often seen substantial rebounds. Therefore, staying informed and strategic is essential.
Gold’s resilience and potential for future gains make it a valuable addition to any investment portfolio. Precious metals provide stability during economic uncertainties. By analyzing trends and making strategic decisions, investors can maximize returns. The current phase offers a unique opportunity to capitalize on gold’s potential. Understanding and leveraging these insights is crucial for long-term success.
In conclusion, gold’s recent performance, though marked by corrections, presents significant opportunities. Historical patterns and current economic indicators suggest potential future gains. Investors should remain vigilant and strategic, using this period to strengthen their portfolios. Precious metals, including gold, continue to be reliable assets during uncertain times. The current correction could indeed be a golden opportunity for savvy investors.
Gold and the Moving Average
The moving average plays a crucial role in analyzing gold’s performance. During corrections, gold often finds support around its moving average levels. For instance, during the 1978 correction, gold found support at the 200-day moving average. Similarly, in the 2009 correction, it found support at the 150-day moving average. These levels act as significant indicators for investors.
Precious metals, particularly gold, show distinct patterns around these moving averages. Investors can use these patterns to make informed decisions. Understanding the moving average can help predict potential corrections and breakouts. Therefore, keeping an eye on these levels is essential for anyone investing in gold.
Precious Metals: An Investment Haven
Gold, along with other precious metals, has always been a safe haven for investors. During economic uncertainties, the demand for precious metals rises. This trend was evident during the 1978 and 2009 breakouts. Investors turned to gold as a secure investment. The historical performance of gold shows its resilience and reliability.
In recent times, precious metals have shown similar trends. As the global economy faces uncertainties, gold remains a popular choice for investors. The recent correction in gold prices might worry some, but history suggests a potential rebound. Therefore, understanding the historical context of gold and its breakouts can provide valuable insights for future investments.
The Current Market Scenario
Presently, gold is navigating through a critical phase. The recent gains from its low in 2022 to the peak have been notable. However, the subsequent correction raises questions about its short-term future. If gold breaks below $2300, a test of $2150-$2175 is likely. Yet, this potential correction could be a strategic buying opportunity.
Precious metals, including gold, often face corrections. These corrections, while temporary, pave the way for future gains. Investors should view these periods as opportunities rather than setbacks. The historical patterns of gold’s performance during corrections support this perspective. Therefore, staying informed and strategic is crucial for maximizing returns.
The Future of Gold
Looking ahead, gold’s future appears promising. Historical data indicates strong rebounds after significant corrections. If the current correction continues, it could offer a prime buying opportunity. Investors should keep an eye on the moving average levels and potential support zones.
Precious metals, particularly gold, have a history of bouncing back robustly. As the global economy continues to evolve, the demand for gold is likely to increase. Rate cuts, economic slowdowns, and other factors will influence gold’s performance. Therefore, staying informed and prepared is essential for capitalizing on future opportunities.
Conclusion
In conclusion, gold’s historical performance provides valuable insights for investors. The significant breakouts in 1978 and 2009, along with their corrections, highlight key patterns. The moving average plays a crucial role in predicting gold’s performance. Precious metals, including gold, remain a safe haven during economic uncertainties. As gold navigates through its current phase, understanding these historical patterns is essential.
Investors should view the current correction as a strategic opportunity. Gold’s resilience and potential for future gains make it a valuable addition to any investment portfolio. Therefore, staying informed, analyzing trends, and making strategic decisions will maximize returns in the long run.
Click here to read our latest article on Buy Now Pay Later Debt
This post is originally published on EDGE-FOREX.


