
A Spinning Top candlestick pattern is a neutral technical analysis pattern that can indicate a potential trend reversal or continuation.
This pattern features a small body positioned at the center of the candlestick, as well as long upper and lower shadows. The candlestick pattern reflects market uncertainty, where neither buyers nor sellers hold a clear advantage.
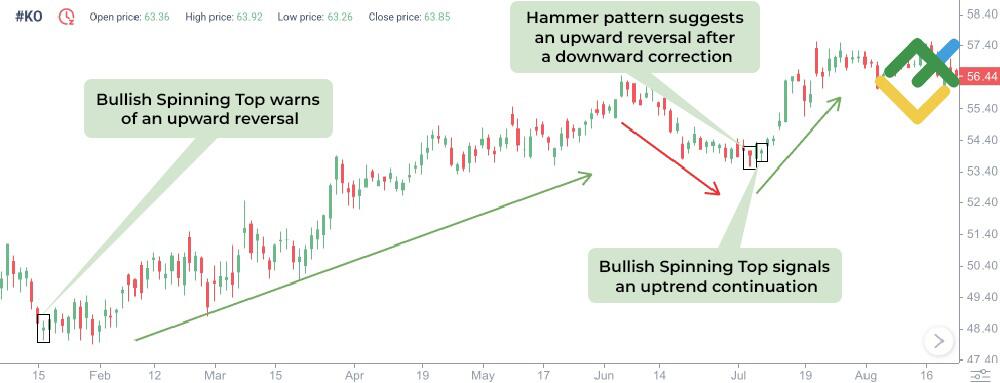
The appearance of a Spinning Top after a prolonged upward or downward movement can warn of an imminent change of price direction. The pattern should be confirmed by other indicators.
The absence of a strong trend after a Spinning Top formation suggests market consolidation. In this case, traders should wait for further developments. Ignoring this pattern can lead to mistakes during trading.
Let’s analyze the essence, signals, and methods of trading with a Spinning Top pattern in more detail.
The article covers the following subjects:
Major Takeaways
- A Spinning Top is a common candlestick pattern, signaling uncertainty in the market. It has a small body and long shadows, which may point to a possible trend reversal.
- The impact of a Spinning Top is usually moderate. It alerts about a possible trend reversal or consolidation and should be confirmed with other indicators.
- Distinctive features: a short body (real price change) with long shadows (volatility within a trading period), indicating uncertainty between bulls and bears.
- When trading a Spinning Top pattern, it is crucial to wait for confirmation from other signals or indicators before opening a trade in the expected trend direction.
- The best trading strategy involves combining a Spinning Top with support/resistance levels, the MACD, RSI, Stochastic, Bollinger Bands, OBV, MFI, and other indicators. Besides, it is advisable to use the pattern in combination with other candlestick and chart patterns like a Hammer/Hanged Man, variations of a Star pattern, Engulfing, etc.
- A Spinning Top appears in all markets and can be found on all time frames. However, it tends to be most effective on older time frames from H1.
- A take-profit order should be set at the nearest resistance/support level, while a stop-loss order should be placed slightly below/above the low/high of a Spinning Top, depending on the prevailing trend.
What is the Spinning Top Candlestick Pattern?
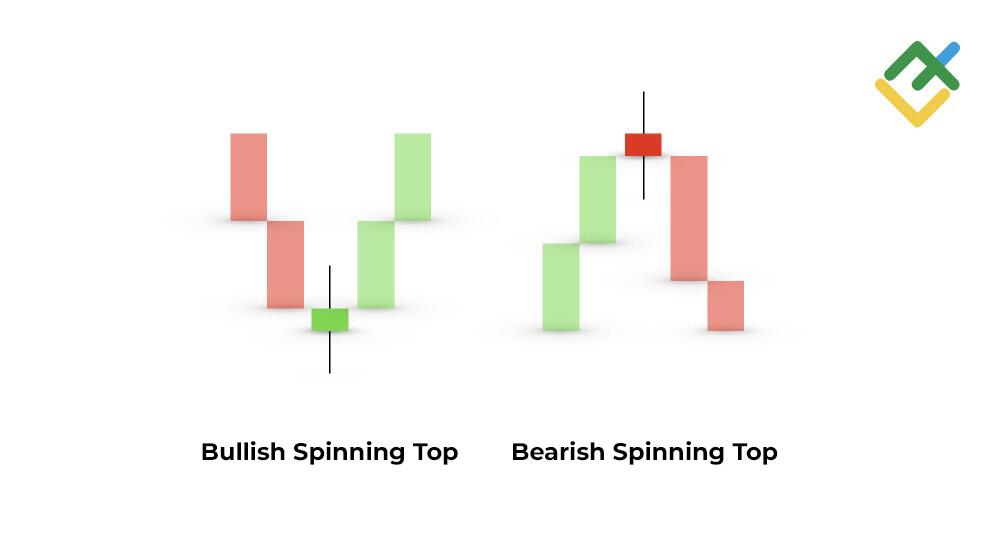
A Spinning Top is a neutral candlestick pattern that signifies uncertainty in the market. It features a small bullish (white or green) or bearish (black or red) body with long upper and lower shadows. The body should be much smaller than the total length of the candlestick, confirming an equilibrium between buyers and sellers.
The pattern’s long wicks indicate intense market activity during a trading session. However, the opening and closing prices are at nearly the same level, suggesting that neither buyers nor sellers are in control.
A Spinning Top candlestick often appears after an uptrend or downtrend and signals a future price reversal or consolidation. It is not a standalone signal and should be confirmed by subsequent candlesticks.
Following an upward trend, a Spinning Top may signal the exhaustion of bullish momentum, while after a downtrend, it can indicate a weakening of bearish pressure.
It is crucial to analyze a Spinning Top in the context of the overall chart and use additional indicators to confirm the signal before making trading decisions.
How is a Spinning Top Candlestick Formed?
A Spinning Top candlestick pattern indicates uncertainty in the market, often appearing during a sideways trend or a consolidation phase.
There is a small difference between the closing and opening prices during trading, which creates a small candlestick body. Long upper and lower shadows indicate a tense struggle between bulls and bears.
A Spinning Top typically forms during a strong trend and can signal either a continuation or a potential reversal. It is essential to check technical indicators and carry out a fundamental analysis to interpret the signal correctly.
Spinning Top Pattern Signals
A Spinning Top pattern appears when the body of a candlestick is relatively small compared to its shadows, suggesting uncertainty in the market. A Spinning Top is not a strong reversal signal by itself, but it warns of a potential shift in market sentiment.
The pattern’s long shadows demonstrate that buyers and sellers tried to take control during a trading period, but neither side could hold the advantage.
The small real body shows that buying and selling pressure has evened out by the end of a period. A Spinning Top often indicates that the prevailing trend is losing momentum and the market is pausing to determine its further direction.
How to Trade the Spinning Top Candlestick Pattern
Here is how you can use a Spinning Top pattern in trading:
- Identify the pattern. Look for candlesticks with a short body in the middle and long shadows. The color of the body (bullish or bearish) is not crucial but can provide additional information. A Spinning Top formed after an uptrend hints at a possible bearish reversal, while after a downtrend, it hints at an upward reversal.
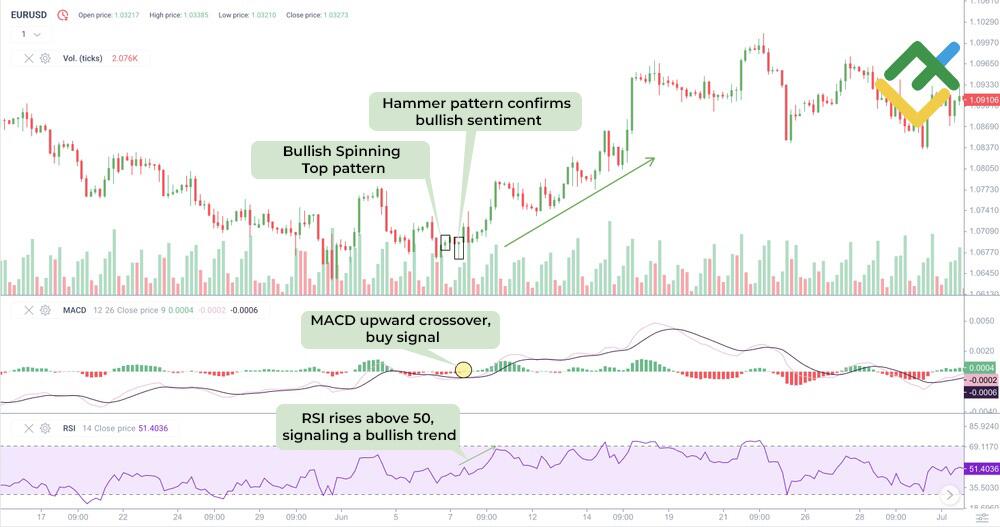
- Confirm the signal. Do not rush to open a trade right after a Spinning Top appears. Wait for confirmation. For example, when the lower shadow breaks through the support or the upper shadow pierces the resistance. Additionally, use technical indicators such as the RSI, MACD, and Stochastic to confirm whether the asset is overbought or oversold.
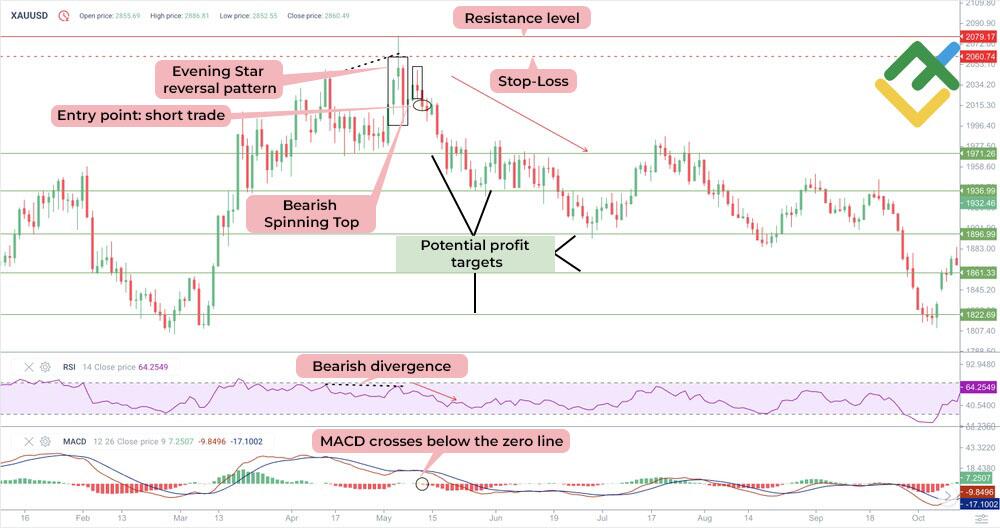
- Determine the entry points and stop-loss levels. For instance, to open a short trade after an uptrend, you need to confirm the breakout of the support line, located at the low of the Spinning Top. To initiate a long trade after a downtrend, you should confirm the breakout of the resistance line, which is at the high of the Spinning Top. It is advisable to place a stop-loss order above the pattern’s high for short trades and below the low for long trades. This approach will help you avoid false breakouts.
- Set profit targets. Place a take-profit order in advance using support and resistance levels, the Fibonacci indicator, or other technical analysis tools. Aim for a risk/reward ratio of at least 1:2, or preferably 1:3.
- Manage risks. Never risk more than 1%–2% of your deposit in a single trade. Remember that a Spinning Top does not guarantee 100% profit. It is only a signal that requires confirmation and proper risk management.
Confirming Spinning Top Patterns
Although a Spinning Top candlestick pattern represents indecision in the market, the pattern by itself is not reliable and should be confirmed with other indicators.
The subsequent candle confirms the Spinning Top signal. A breakout of the bullish Spinning Top’s high indicates a potential uptrend, while a breakout of the low indicates a bearish trend.
Besides, you can use technical tools such as the RSI or MACD to confirm the strength of a trend. An increase in trading volumes during a breakout is a strong confirmation signal. Moreover, you can validate a Spinning Top by using reversal candlestick patterns, such as the Engulfing, Piercing Line/Dark Cloud Cover, or Hammer/Hanging Man.
Analyzing all these factors together helps improve the effectiveness of trading with a Spinning Top candlestick pattern.
Spinning Top Price Targets and Stop Loss Levels
In order to determine the profit targets when trading Spinning Top candlesticks, you need to analyze the market situation.
If a Spinning Top emerges following an uptrend, the potential target may be the support level of the previous trend. In a downtrend, the target would instead be the resistance level. A more conservative approach suggests placing a take-profit order at a distance equal to the height of the Spinning Top candlestick, measured from the entry point in the direction of the expected movement.
A stop-loss order is typically set beyond the high or low of the Spinning Top candlestick — below the low for long trades and above the high for short positions. Besides, it is crucial to consider market volatility, as you may need to place a stop-loss order slightly further away to prevent a trade from getting closed prematurely due to market noise.
Spinning Top Chart Pattern Example
Let’s explore an example of a Spinning Top candlestick pattern on the hourly chart of the Nvidia Corp. stock.
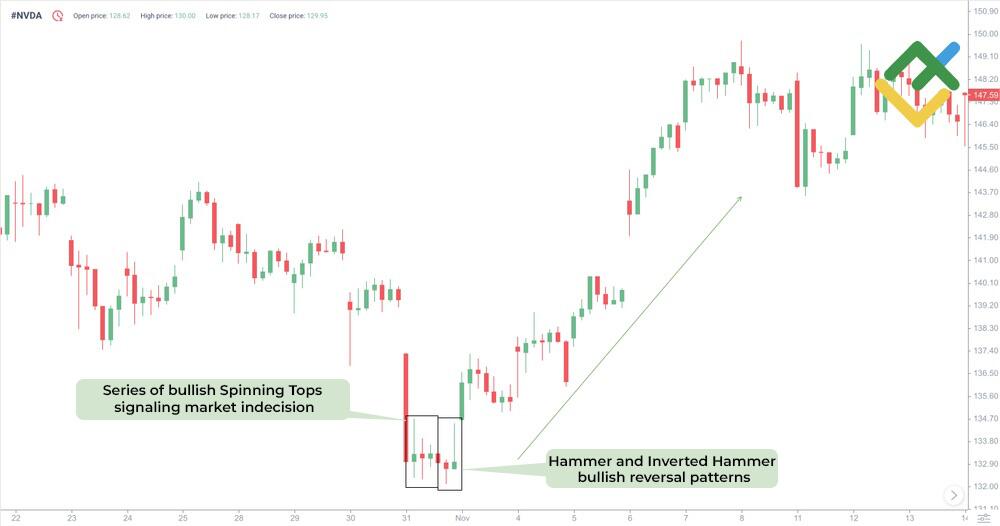
A series of green and red Spinning Tops forms following the price decline and the appearance of the large Bearish Marubozu candlestick.
In this case, Spinning Top patterns signal uncertainty in the market, meaning that the price may continue falling or reverse upwards.
The subsequent formation of the Hammer and Inverted Hammer reversal patterns confirms that bullish sentiment prevails in the market. Therefore, long trades can be considered with targets at the nearest resistance levels. A stop-loss order should be placed below the lower shadow of the Hammer pattern.
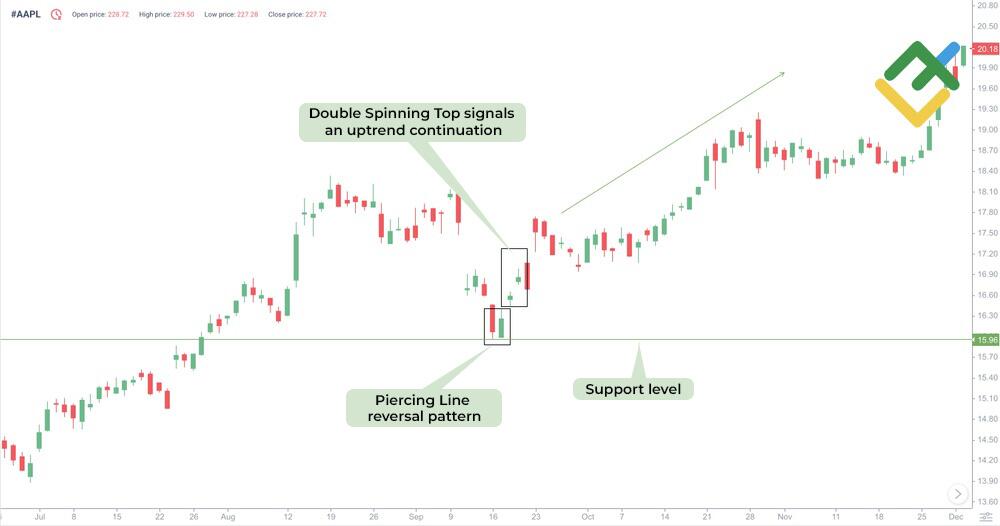
Double Spinning Top Candlestick
A Double Spinning Top is a rare but significant signal on a price chart. It occurs when two Spinning Top candles appear consecutively.
The first candlestick indicates market indecision and struggle between bulls and bears, while the second candlestick boosts this uncertainty.
You should treat such a pattern cautiously since it warns of a possible trend reversal or a prolonged consolidation. Avoid opening a position straight away. It is better to wait for a confirming signal.
A breakout of a key support or resistance level can serve as a confirmation and help make informed decisions regarding opening a long or short trade.
The screenshot below shows a Double Spinning Top pattern with upward gaps, which confirms a stronger Piercing Line reversal pattern.
Limitations of Using the Spinning Top
A Spinning Top candlestick pattern has several disadvantages. The main one is its weak predictive power. It reflects only fluctuations and the battle between bulls and bears but does not clarify who will dominate. Therefore, it is essential to confirm the signal with indicators or other candlestick patterns.
Relying on a Spinning Top as the sole signal to enter a trade is highly risky. Traders should watch out for false breakouts and sudden reversals, which can occur due to the low volatility often present during the pattern’s formation. Additionally, it is crucial to consider the overall market context — a Spinning Top that appears at the top of an uptrend is generally more bearish than one that forms at the bottom of a downtrend.
When trading a Spinning Top, it is important to confirm the signal with a subsequent candlestick. If the next candle closes above the Spinning Top’s body, it may indicate a potential uptrend. Conversely, a close below the body could signal a possible downtrend.
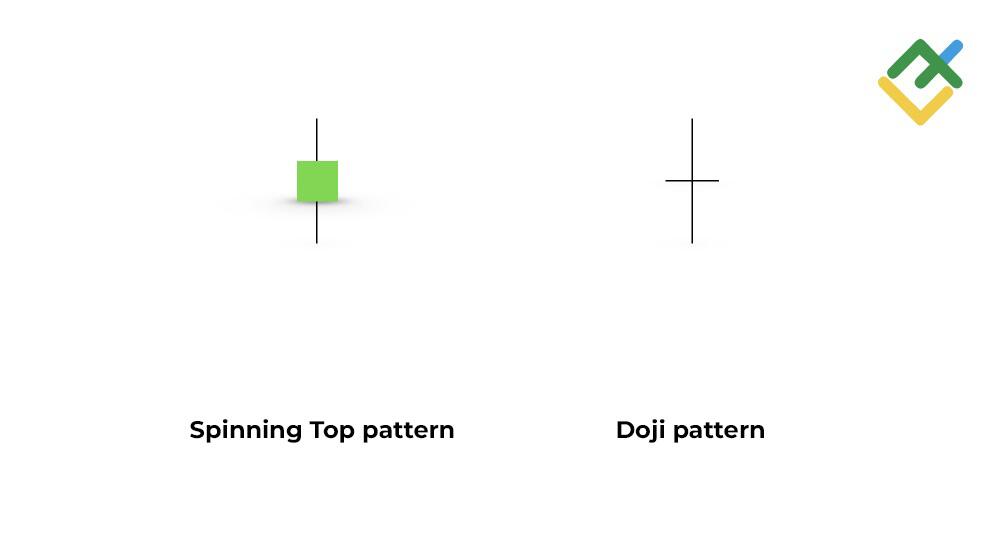
What Is the Difference Between a Spinning Top and a Doji?
Spinning Top and Doji candles are Japanese candlestick patterns that signal a possible price reversal.
The main difference lies in the body of the candlesticks. A Spinning Top has a short but prominent body with long upper and lower shadows. This pattern indicates the confrontation between buyers and sellers.
A Doji candlestick pattern has little to no body, with the opening and closing prices either the same or very close. Its long shadows reflect market indecision, showing that the forces of buyers and sellers are roughly equal and changes are possible.
The Bottom Line
A Spinning Top candlestick pattern is a valuable tool for technical analysis, often indicating either a potential trend reversal or continuation. When used alongside other indicators and patterns, this candlestick can help traders make more informed decisions.
Notably, a Spinning Top pattern should not be used in isolation — it needs to be confirmed by subsequent candles, technical indicators, and fundamental factors. The correct application and interpretation of this pattern can significantly improve the efficiency of a trading strategy.
Try trading a Spinning Top candlestick pattern on the LiteFinance free demo account.
Get access to a demo account on an easy-to-use Forex platform without registration
Spinning Top Candlestick Pattern FAQs
A Spinning Top signifies a state of market indecision. Its small body with long shadows reflects a balance of power between buyers and sellers, showing that neither side has a clear edge. This pattern suggests that a trend reversal or consolidation may be on the horizon.
A Spinning Top itself is a neutral pattern, meaning it is neither bullish nor bearish. Its color only hints at potential movement. Thus, the context in which it appears on the price chart, additional signals from other candlestick patterns and technical indicators are more important.
When trading a bullish Spinning Top candlestick, you should wait for confirmation. If a bullish candlestick appears after the pattern, consider a long trade with a stop-loss set below the low of the Spinning Top. The price target is the nearest resistance level.
A downtrend may begin after a bearish Spinning Top, especially if a bearish candlestick forms afterward. However, you should always confirm the signal with other indicators and patterns.
A bullish Spinning Top is typically green or white, indicating that the closing price is higher than the opening one. However, the key features of the pattern are its small body and the length and placement of the shadows. While the candle’s color can reinforce the signal, it does not guarantee a 100% price decline.
The content of this article reflects the author’s opinion and does not necessarily reflect the official position of LiteFinance broker. The material published on this page is provided for informational purposes only and should not be considered as the provision of investment advice for the purposes of Directive 2014/65/EU.
According to copyright law, this article is considered intellectual property, which includes a prohibition on copying and distributing it without consent.
{{value}} ( {{count}} {{title}} )
This post is originally published on LITEFINANCE.


