
The article covers the following subjects:
Major Takeaways
- Main scenario: After correction ends, consider short positions below the level of 161.90 with a target of 148.50 – 138.65. A sell signal: if the price holds below 161.90. Stop Loss: above 162.20, Take Profit: 148.50 – 138.65.
- Alternative scenario: Breakout and consolidation above the level of 161.90 will allow the pair to continue rising to the levels of 170.00 – 175.41. A buy signal: the level of 161.90 is broken to the upside. Stop Loss: below 161.50, Take Profit: 170.00 – 175.41.
Main Scenario
Consider short positions below the level of 161.90 with a target of 148.50 – 138.65 once the correction is completed.
Alternative Scenario
Breakout and consolidation above the level of 161.90 will allow the pair to continue rising to the levels of 170.00 – 175.41.
Analysis
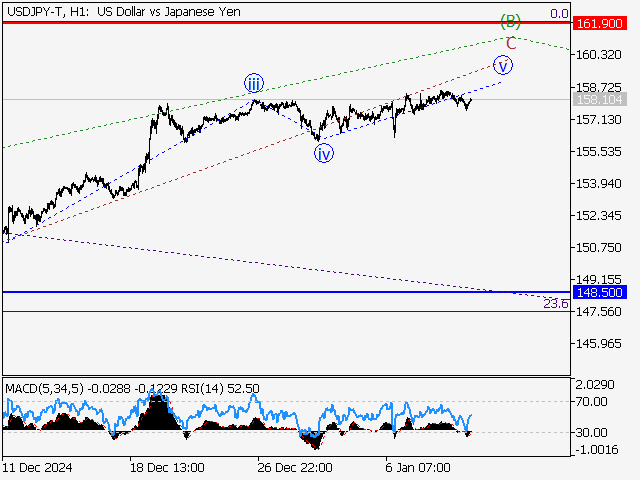
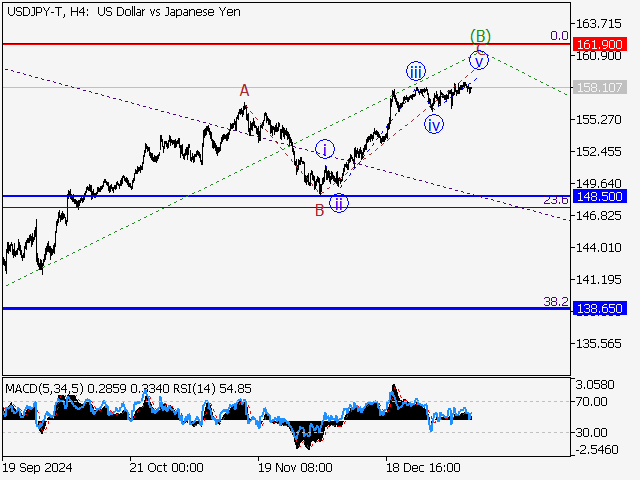
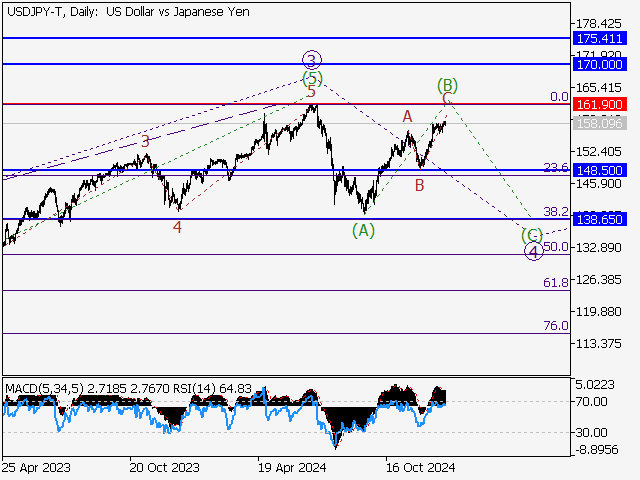
The daily time frame shows that an ascending wave of larger degree 3 is presumably formed, and a bearish correction is developing as the fourth wave 4, with wave (А) of 4 completed as its part. A corrective wave (В) of 4 is presumably nearing completion on the H4 chart, with wave С of (В) forming as its part. Apparently, the fifth wave of smaller degree v of C is nearing completion on the H1 chart. After its completion, if this assumption is correct, the USD/JPY pair will continue to sink to 148.50 – 138.65. The level of 161.90 is critical in this scenario as a breakout will enable the pair to continue rising to the levels of 170.00 – 175.41.
This forecast is based on the Elliott Wave Theory. When developing trading strategies, it is essential to consider fundamental factors, as the market situation can change at any time.
Price chart of USDJPY in real time mode

The content of this article reflects the author’s opinion and does not necessarily reflect the official position of LiteFinance. The material published on this page is provided for informational purposes only and should not be considered as the provision of investment advice for the purposes of Directive 2004/39/EC.
{{value}} ( {{count}} {{title}} )
This post is originally published on LITEFINANCE.