
Understanding the intricacies of candlestick analysis is extremely important in trading. Among various candlestick patterns, a Doji Star stands out in particular, signaling a possible trend reversal. The formation of this pattern directly indicates a struggle between buyers and sellers, highlighting the state of equilibrium in the market.
The ability to recognize a Doji Star and correctly interpret its signals allows you to anticipate shifts in market sentiment and make more informed trading decisions. This article is devoted to the analysis of the Doji Star, its characteristics, and strategies for trading this pattern.
The article covers the following subjects:
Major Takeaways
- A Doji Star is a reversal pattern on price charts, consisting of a candlestick from the preceding trend, a Doji candlestick, and a confirming candlestick.
- A Doji Star is easy to recognize: look for a small Doji body separated by a gap from the previous candlestick, indicating a change in market sentiment.
- Key features: small range of Doji fluctuations; a gap after the previous candlestick; located at the end of an uptrend or downtrend.
- The pattern forms due to market uncertainty when there is a struggle between bulls and bears, signaling a possible reversal.
- You can open a trade once the reversal is confirmed by the next candlestick. It is better to set a stop-loss beyond the Doji high/low to avoid false breakouts.
- It is essential to confirm the pattern with other indicators to filter out false signals and use it in combination with support/resistance levels.
- Pros: early reversal identification. Cons: requires confirmation; false signals are possible.
- A Doji Star pattern can be found in any financial market, including Forex. However, it is more common on the charts of volatile instruments and time frames higher than H1.
What is the Doji Star Candlestick Pattern?
A Doji Star is a Japanese candlestick pattern that indicates a potential reversal. The pattern occurs at the top of an uptrend or at the bottom of a downtrend.
Key elements: a candlestick with a long body reflecting the current trend, followed by a price gap, and a Doji candlestick with a small body and long shadows. A Doji Star is confirmed by the next impulse candlestick moving in the opposite direction.
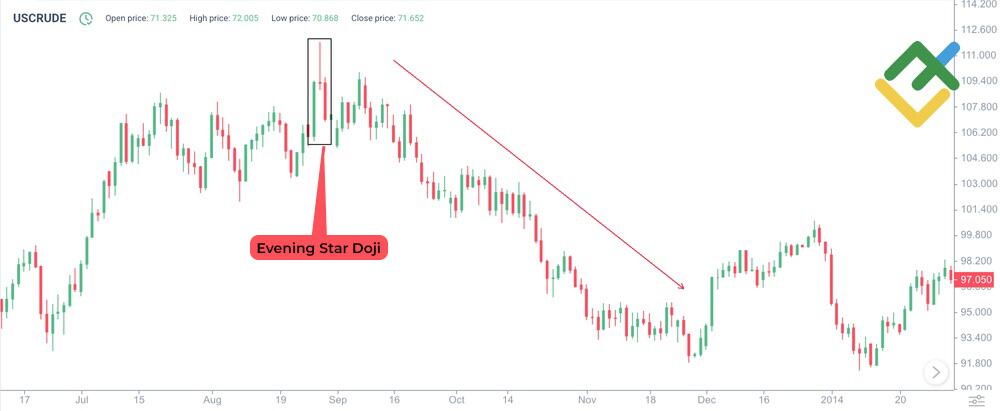
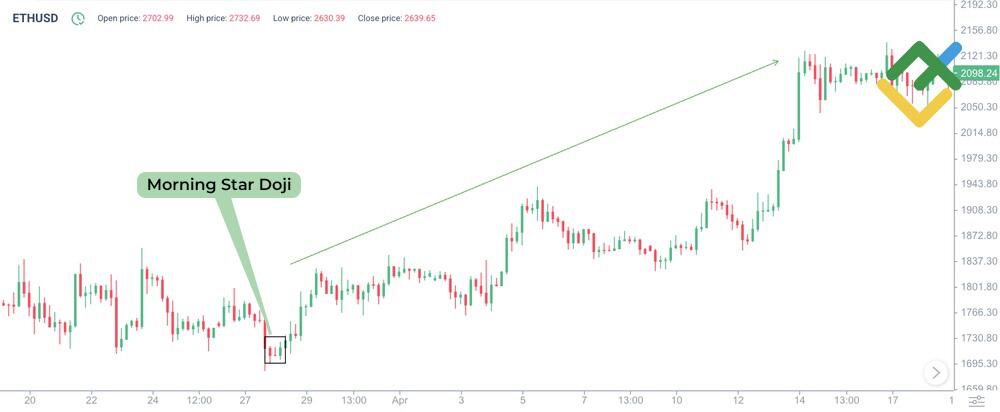
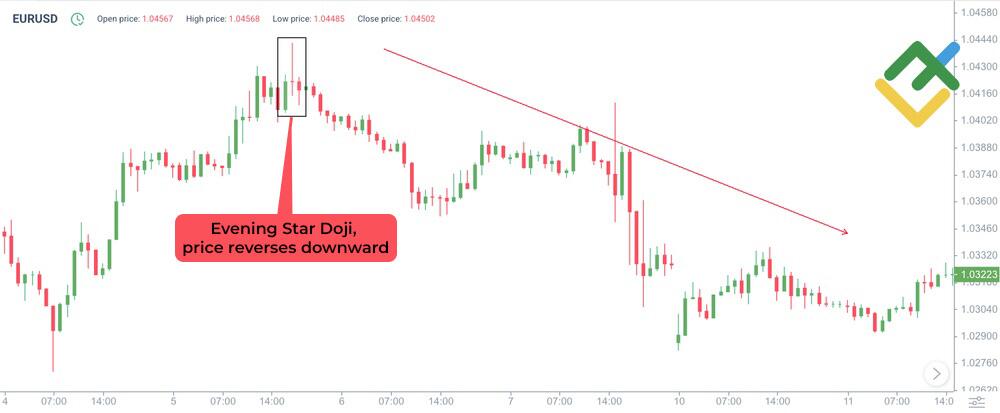
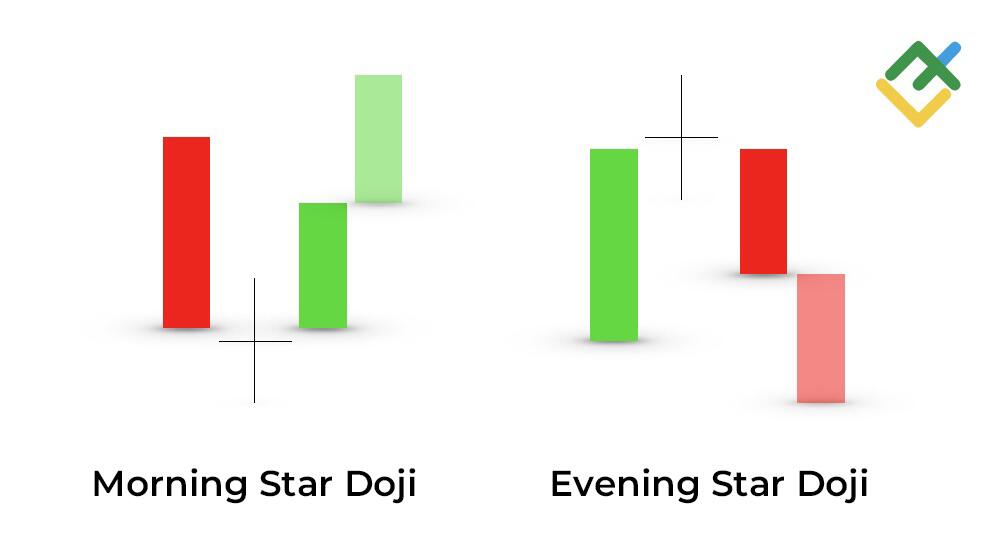
A bullish Doji Star candlestick, often referred to as Morning Star Doji, appears after a downtrend and indicates a potential start of an uptrend. A bearish Doji Star candlestick, also known as Evening Star Doji, forms after an uptrend and signals a possible decline in prices.
Types
A Doji Star pattern is a significant trend reversal signal. It consists of several candlesticks. The middle candlestick is a Doji. Its small body indicates market uncertainty.
The position of the Doji relative to the preceding and following candlesticks determines the type of signal and its strength. Let’s look at the main types of this pattern.
Identifying the Bullish Doji Star Pattern
Features and interpretation of a bullish Doji Star pattern:
- Preceding downtrend. The pattern forms after a prolonged price decrease.
- The first candle is bearish. This long downward candlestick (red or black) confirms the current bearish trend.
- The second candle is a Doji. It has a small body, with almost equal opening and closing prices, which indicates uncertainty in the market. This candlestick forms with a downward gap after the previous candlestick.
- The third candle is bullish. It is a long green or white candle that closes significantly above the middle of the first bearish candle.
- A Doji Star suggests a trend reversal. The uncertainty in the Doji candlestick is replaced by a strong bullish impulse, which signals that bulls are taking control, and an uptrend begins. Besides, confirmation from subsequent candlesticks is required.
Identifying the Bearish Doji Star Pattern
A bearish Doji Star pattern signals a downward trend reversal. The following characteristics can be identified:
- This pattern appears during an uptrend in the market.
- As a rule, the first upward candlestick has a very long body, confirming the ongoing bullish momentum.
- The second candlestick is a Doji with a small or no body at all. A Doji opens with an upward gap after the previous candlestick.
- Confirmation of the reversal: the third candlestick is a long red candle, closing significantly below the middle of the first candle’s body.
- The pattern signals weakening buying and strengthening selling pressure, which may lead to a downtrend.
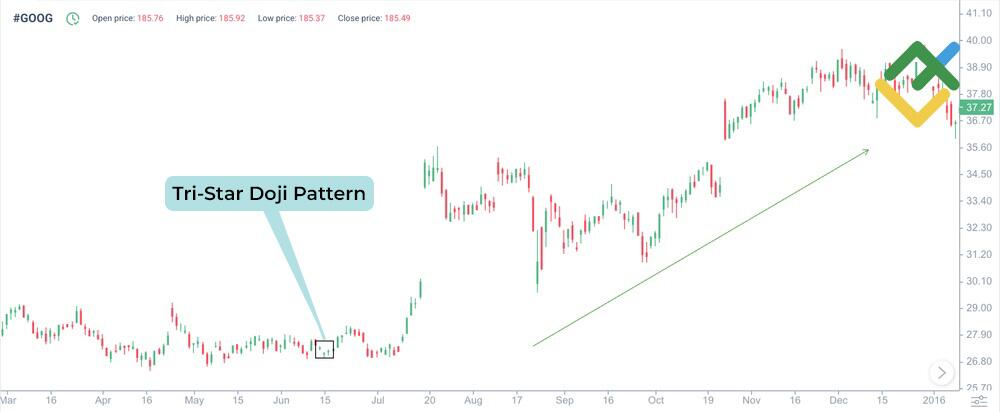
Identifying the Doji Tri-Star
A bearish Tri-Star Doji pattern consists of three consecutive Doji candlesticks, each opening and closing at approximately the same level. The appearance of this pattern in an uptrend signals a potential bearish reversal.
A bullish Tri-Star Doji pattern, on the contrary, forms during a downtrend and foreshadows an upward price reversal. Three Doji candlesticks that open and close at similar levels indicate indecision in the market. An upward trend reversal is possible in the future, although this pattern needs to be confirmed by other indicators.
Trading Strategies Using the Doji Star Pattern
This section provides a detailed overview of effective strategies using the Doji Star pattern for different market conditions.
Doji Star in Uptrends
A bullish Doji Star candlestick pattern may signal a change from a downtrend to an uptrend. The pattern emerges after a prolonged decline, indicating a fading selling pressure and a possible strengthening of buyers.
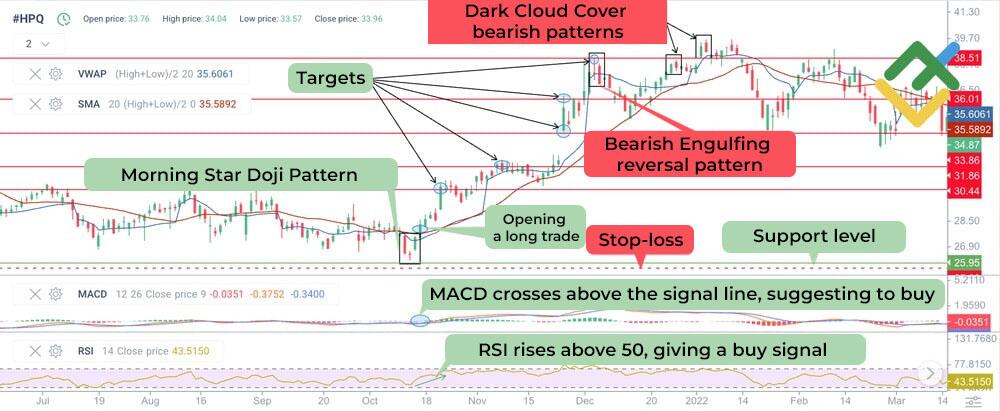
Let’s study an example of trading a bullish Doji Star pattern using the daily HP, Inc. stock chart.
- The chart shows that a bullish Doji Star pattern has formed at the support level after a long price consolidation.
- Key support and resistance levels are identified on the candlestick chart.
- The MACD trend indicator, the RSI stochastic oscillator, and the VWAP volume indicator with the SMA are added to the chart to confirm the potential transition from consolidation to growth. The MACD crosses above the zero line and rises in the positive zone, indicating a buy signal. RSI values have also rebounded from the lower boundary and started to increase, suggesting potential for further gains. The VWAP indicator’s weighted average price and the SMA20 line are below the market price, which also points to a buy signal and confirms the pattern.
- A long trade is opened after a bullish Doji Star pattern forms, with a stop-loss order set below the support level.
- Potential profit targets are at key resistance levels: 30.44, 31.86, 33.86, 36.01, and 38.51. Lock in 50% of the trade at each level.
- Bearish reversal patterns, such as a Dark Cloud Cover and Bearish Engulfing, appear in the 36.01–38.51 range, warning of increased selling activity in this zone. Therefore, it is advisable to exit the trade and lock in profits.
Doji Star in Downtrends
The bearish Doji Star candlestick pattern signals a potential reversal from an uptrend to a downtrend. Trading with this pattern also requires confirmation.
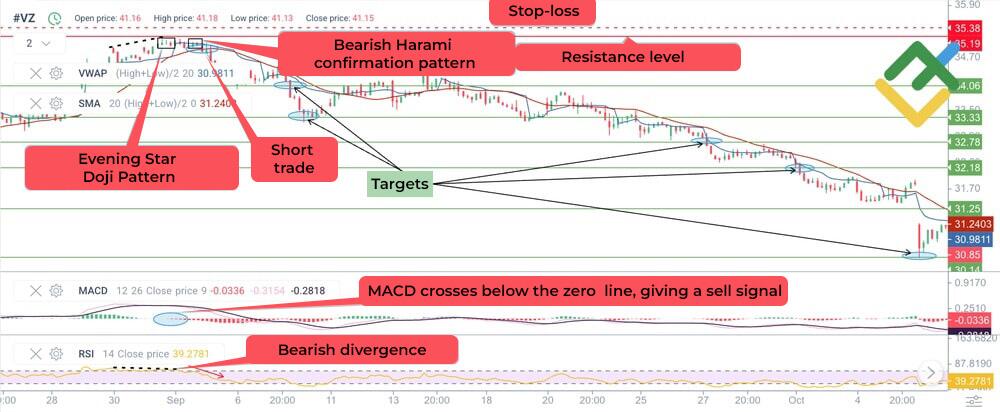
Let’s examine an example of trading a bearish Doji Star pattern on the hourly chart of Verizon Communications Inc. shares.
- A Doji Star has formed near resistance after a prolonged uptrend.
- The key support and resistance levels are determined.
- The MACD trend indicator, the RSI stochastic oscillator, and the VWAP volume indicator with a simple SMA moving average are added. The MACD shows a downward crossover of the zero line and a further decline in the negative zone, which is a sell signal. The RSI indicates a bearish divergence, with values falling from the overbought level. The VWAP indicator’s weighted average price and the SMA20 line are above the market price, pointing to a weakening of the bullish momentum in the market. Thus, a short trade can be opened.
- A Bearish Harami reversal pattern has also formed on the asset’s chart, confirming the Doji Star.
- Short positions are initiated after the pattern has developed, with a stop-loss level placed above the resistance level.
- Potential profit targets are at key support levels: 34.06, 33.33, 32.78, 32.18, 31.25, and 30.14. Lock in 50% of the trade at each level.
- Bulls have picked up momentum at 30.14, warning of a possible upward reversal. At this level, you should lock in the remaining profit and close your trades.
Common Mistakes to Avoid
- Insufficient confirmation. A Doji Star candlestick pattern alone does not guarantee a reversal. False signals may occur, so it is essential to wait for confirmation, such as a breakout of the resistance/support level.
- Weak market context. A Doji Star pattern may appear during consolidation, where it is less significant. Thus, it is crucial to analyze the overall trend and market context. If the market is trending sideways, a Doji Star may simply be a random fluctuation.
- Misidentification. A Doji Star should have a small body and long shadows located above or below the previous candlestick. Incorrect pattern identification can lead to trading mistakes. Therefore, carefully analyze the pattern.
- Excessive self-confidence. Even with confirmation and a favorable market context, stop-loss levels should not be ignored since no pattern guarantees a reversal.
- Lower time frames. Chart patterns on lower time frames, like 1-minute charts, are often subject to market noise and generate more false signals. Therefore, it is preferable to use higher time frames, such as daily or weekly charts, for better reliability.
Pros and Cons
Like any other pattern, a Doji Star has its advantages and disadvantages, which should be considered when making trading decisions.
|
Pros |
Cons |
|
A strong reversal signal. The pattern often foreshadows a trend reversal, especially after prolonged upward or downward trends. |
Requires confirmation. The signal becomes more reliable only when confirmed by subsequent candlesticks. |
|
Easy to identify. It is visually distinct from other patterns due to the unique shape of the Doji candlestick. |
The pattern can generate false signals. It does not always lead to a reversal, especially in highly volatile markets or when there is no clear trend. |
|
It can be used to determine the best entry point. |
The effectiveness of the pattern depends on the overall market context, support/resistance levels, and other technical indicators. |
|
Relatively easy to use. The pattern does not require complex calculations or in-depth knowledge of chart analysis methods. |
Difficult to interpret. Identifying a Doji candlestick can be challenging, especially when other candlesticks with small bodies are nearby. |
Doji Star vs Other Candlestick Patterns
Let’s analyze how a Doji Star differs from other similar types of Doji candlestick patterns.
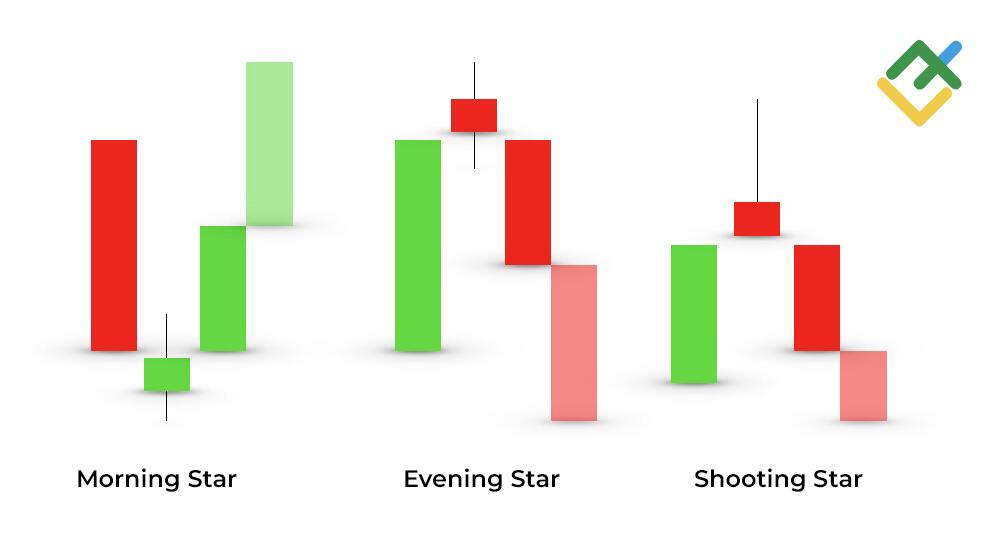
- A Doji Star features a candlestick with a small body (often virtually absent) and long shadows, indicating market indecision. It requires additional confirmation.
- An Evening Star pattern occurs during an uptrend when a small candlestick body (star) appears at the top with an upward gap, followed by a bearish candlestick. This pattern is a strong reversal signal. Unlike a Doji Star, an Evening Star Doji forms at the end of an uptrend.
- A Morning Star pattern is the opposite of an Evening Star. It forms during a downtrend when a star (small body) appears with a downward gap, followed by a confirming candlestick. Moreover, a Morning Doji Star pattern provides a strong signal of an upward reversal, especially when supported by high trading volume.
- A Shooting Star pattern forms after an uptrend and consists of two candles. The second candlestick in this pattern has a small real body and a long upper shadow. In contrast to a Doji Star, this candlestick is not necessarily a Doji. It signals a potential downward reversal.
Conclusion
Although a Doji Star is a strong signal, it requires confirmation from other technical analysis tools. A bullish Doji Star forms after a downward price movement and indicates that intense selling pressure is likely to subside. A bearish Doji Star appears at the end of an uptrend and warns of an imminent price decline.
Try trading a Doji Star candlestick pattern in your trading system on a LiteFinance demo account.
Get access to a demo account on an easy-to-use Forex platform without registration
Doji Star Candle Pattern FAQs
A Doji Star is a reversal pattern consisting of three candles. The first one is a large candlestick reflecting the prevailing trend. The second one is a Doji, signaling market uncertainty, as the price closes very near to where it opened. The third candlestick confirms the trend reversal.
The success rate of a Doji Star depends on confirmation by subsequent candlesticks and the overall market situation. It is advisable to consider trading volumes and other indicators to increase the reliability of the signal. This candlestick pattern is more effective at key support and resistance levels.
A Doji Star can appear in both bullish and bearish markets. A bullish pattern occurs during a downtrend, followed by an increase. A bearish pattern, on the contrary, develops during an uptrend and signals an imminent price drop.
A bearish Doji Star forms during an uptrend. First, a long white or green candlestick appears, followed by a Doji, and finally, a red candlestick completes the pattern. This pattern signals a possible downward trend reversal.
A bullish Doji Star appears during a downtrend. A large bearish candlestick is followed by a Doji. Afterward, a bullish candlestick confirms a reversal. This pattern signals a potential change to an uptrend.
The strategy involves opening a trade after the reversal is confirmed by the third candlestick of a Doji Star. A stop-loss order is set below the Doji candle level. A take-profit order is determined based on support/resistance levels or other technical indicators.
You can trade a Doji Star after the third confirmation candlestick appears. Long trades should be opened once a bullish Doji Star forms. A short trade should be initiated when a bearish Doji Star appears. It is advisable to use a stop-loss order to limit potential losses and a take-profit order to secure gains.
A Doji Star can be a good signal of a bullish reversal if several conditions are met: the pattern is formed in a downtrend and validated by a subsequent bullish candlestick, with additional confirmation from other technical indicators.

The content of this article reflects the author’s opinion and does not necessarily reflect the official position of LiteFinance broker. The material published on this page is provided for informational purposes only and should not be considered as the provision of investment advice for the purposes of Directive 2014/65/EU.
According to copyright law, this article is considered intellectual property, which includes a prohibition on copying and distributing it without consent.
{{value}} ( {{count}} {{title}} )
This post is originally published on LITEFINANCE.


