TRX is the native cryptocurrency of the TRON blockchain platform, enabling users to develop decentralized applications (dApps) and share digital content. The platform’s main feature is its high speed: TRON can process thousands of transactions per second. This also helps significantly reduce commissions, increasing the platform’s popularity among users and developers.
This article will analyze expert forecasts for the TRX rate. Whether you are a beginner or an experienced trader, this knowledge will help you make more informed trading decisions and better navigate the dynamic world of cryptocurrencies.
The article covers the following subjects:
Highlights and Key Points: (TRX) Tron Price Prediction 2024-2030
-
Current Price: $0.16000
-
Experts presume the price could range from 0.13 to 0.20 by the end of 2024, but the average price will unlikely exceed 0.14.
-
In 2025, TRX could trade in the range of 0.20-0.35, with an average value of about 0.26.
-
Based on long-term estimates, the TRX price may reach 1.73 by 2030. Experts also suggest growth to 1.8 if a strong bullish trend develops.
-
Most analysts agree that TRX will grow steadily over the next five years. New developments and the TRON blockchain’s unique ecosystem will likely positively impact the coin’s popularity and value. At the same time, such risks as high volatility and regulatory changes cannot be ruled out. Nevertheless, TRX can be a profitable long-term investment.
TRX Price Today Coming Days and Week
When forecasting the TRX/USD exchange rate for the near term, focus on several critical factors. Monitor technological updates and developments within the TRON blockchain, as they can drive adoption and investor interest. Pay attention to overall market sentiment towards cryptocurrencies, which significantly impacts price movements. Stay updated on regulatory news, as changes in cryptocurrency regulations can affect market dynamics. Analyze trading volumes and liquidity to gauge market strength and potential volatility. Additionally, watch for new partnerships and integrations with other blockchain projects, as they can enhance Tron’s utility and attractiveness to investors.
Analysts’ TRX Price Projections for 2024
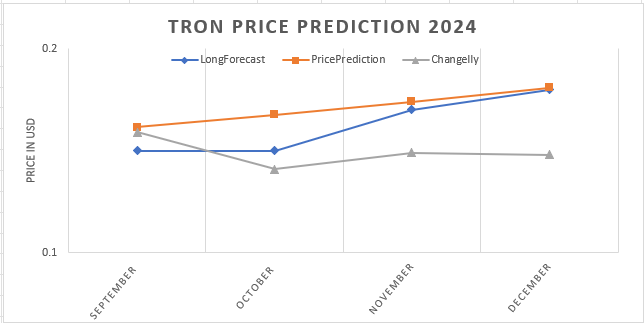
Most experts agree that TRXUSD will likely trade in a bullish range in 2024. This outlook is based on positive development trends within the TRON blockchain, technological improvement, and rising general interest in cryptocurrencies.
LongForecast
Price range for 2024: $0.14 – $0.20 (estimated as of 10.10.2024).
LongForecast‘s outlook for the rest of 2024 suggests slight growth. The token’s minimum price is expected to reach 0.14 in October and hit 0.17 by year-end.
|
Month |
Opening, $ |
Min.– Max., $ |
Closing, $ |
|
October |
0.15 |
0.14-0.20 |
0.15 |
|
November |
0.15 |
0.15-0.18 |
0.17 |
|
December |
0.17 |
0.17-0.19 |
0.18 |
PricePrediction
Price range for 2024: $0.1541 – $0.1808 (estimated as of 10.10.2024).
PricePrediction presumes that the TRON price may reach an average of 0.1732 in the last months 2024. The minimum and the maximum prices will likely be 0.1541 and а 0.1808. A pronounced bullish trend with eventual pullbacks will presumably develop until the end of the year.
|
Month |
Minimum, $ |
Average price, $ |
Maximum, $ |
|
October |
0.1541 |
0.1601 |
0.1677 |
|
November |
0.1590 |
0.1665 |
0.1741 |
|
December |
0.1657 |
0.1732 |
0.1808 |
Changelly
Price range for 2024: $0.121 – 0.149 (estimated as of 10.10.2024).
Analysts at Changelly forecast slight growth for TRX up to the end of the year. The minimum price will likely be 0.121 in October, while the maximum of 0.149 could be reached in November.
|
Month |
Minimum, $ |
Average price, $ |
Maximum, $ |
|
October |
0.121 |
0.131 |
0.141 |
|
November |
0.131 |
0.140 |
0.149 |
|
December |
0.130 |
0.139 |
0.148 |
Coin Price Forecast
Price range for 2024: $0.13 – 0.20 (estimated as of 10.10.2024).
Based on Coin Price Prediction‘s outlook, the TRX rate will hit around 0.20 by year-end.
|
Year |
Mid-Year, $ |
Year-end, $ |
|
2024 |
0.13 |
0.20 |
TRXUSD Technical Analysis
To conduct a technical analysis of TRXUSD, we will use various indicators. Moving averages will help identify trends by smoothing price fluctuations. The relative strength index (RSI) will indicate overbought and oversold areas. We can estimate the asset’s volatility and eventual trend reversals using Bollinger Bands. The MACD indicator determines the trend’s strength, direction, and possible pivot points.
Additionally, we will use chart patterns. For example, triangles are used to identify trend continuation, while Head and Shoulders are used to spot reversals. Flags and pennants indicate short-term trend corrections.
Get access to a demo account on an easy-to-use Forex platform without registration
TRXUSD Forecast For Next Three Months
TRXUSD’s daily chart demonstrates a slight upward move following a recent pullback from Fibonacci‘s retracement of 0.5 (0.14362). The price approached a level of 0.16000, which represents an important local resistance and can further determine the trend’s direction. A breakout of this zone will create conditions for continued growth, with targets at 0.17000 (previous local maximum) and 0.18000 (maximum since 2021). If the upward momentum continues, the key psychological level of 0.20000 may be retested.
On the other hand, an eventual pullback will shift support to a 0.5 Fibonacci level (0.14669) and a 0.618 Fibonacci level (0.14000), where the price can bounce to the upside. These levels are important points where an upward movement could resume.
The MACD indicator shows weak upward dynamics: the indicator lines are close to each other, indicating market uncertainty. If the lines cross upwards, this may signal continued growth. Meanwhile, the stochastic oscillator is in the overbought zone (above 80), which increases the likelihood of a correction shortly. A downward crossover of the stochastic lines will confirm the risk of a reversal.
The decrease in volumes indicates a weakening of the current upward momentum. For confident growth to continue, volumes must increase, confirming buying activity.
The chart also shows the bearish engulfing candlestick pattern – a reversal signal indicating a possible trend change to the downside. This pattern is especially strong if it occurs after a long upward movement, signaling that the sellers have seized the initiative. If the bearish momentum is confirmed, expect the beginning of a downward move.
Thus, the price behavior near the level of 0.16000 will give clues on TRXUSD’s further moves. Following the indicators’ signals and volumes is important to determine the most plausible trend direction.

Long-Term TRXUSD Analysis for 2024-2025
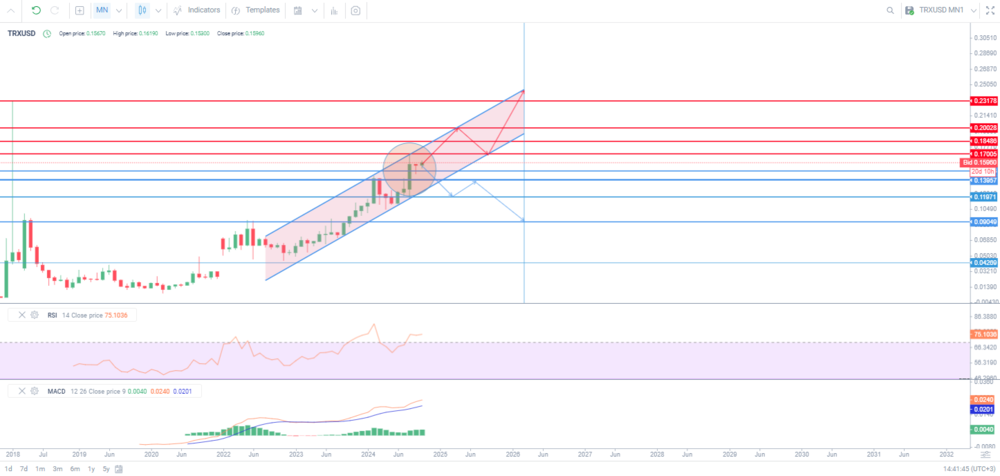
The chart shows that the TRXUSD price has stably evolved in an ascending channel on the one-month time frame. Key resistance levels are marked at 0.17050, 0.18486, and 0.20208, whereas support levels are at 0.13957, 0.11971, and 0.08049.
The RSI indicator is in the overbought zone, pointing to a possible correction. At the same time, the MACD indicates a bullish trend as its histogram continues to rise and the lines have crossed to the upside.
The chart also shows a bearish harami pattern formed in September 2024, which is a signal for a possible downward reversal after an upward movement. This candlestick pattern indicates a weakening buying activity, which means that the asset price may fall below the minimum of the bearish harami, or trading volumes will decrease. The occurrence of this signal amid other signs of slowing growth, such as high RSI values, increases the chance of a correction in the coming months.
Thus, the price may decline to the nearest support level of 0.14000 or 0.12000 in 3-6 months, which will be a normal correction within a long-term uptrend. The rate may recover in 6-12 months and rally to test resistance levels at around 0.18500 and 0.20000.
If the bullish momentum continues, TRX may reach 0.2300. Although the overall trend remains upward, it is worth monitoring the price reaction to the key levels and waiting for additional confirmation to assess the likelihood of further growth or a deeper correction in the coming months.
|
Month |
TRXUSD projected values |
|
|
Minimum, $ |
Maximum, $ |
|
|
October 2024 |
1.53000 |
0.16500 |
|
November 2024 |
0.16000 |
0.17000 |
|
December 2024 |
0.17000 |
0.18000 |
|
January 2025 |
0.18000 |
0.18500 |
|
February 2025 |
0.18500 |
0.19000 |
|
March 2025 |
0.19000 |
0.20000 |
|
April 2025 |
0.20000 |
0.19000 |
|
May 2025 |
0.19000 |
1.85000 |
|
June 2025 |
1.85000 |
0.18000 |
|
July 2025 |
0.18000 |
0.17000 |
|
August 2025 |
0.17000 |
0.18500 |
|
September 2025 |
0.18500 |
0.19000 |
|
October 2025 |
0.19000 |
0.20000 |
TRXUSD Long-Term Trading Plan
The price has repeatedly faced resistance at 0.1700-0.1800, which has led to slower growth and pullbacks. Therefore, this zone is defined as a key area. A breakout of the 0.1700 level may signal a continuation of the uptrend, targeted at the next resistance of 0.1800. Consolidation above this level will indicate an increase in demand. Then, the price will likely grow to 0.2000. Having reached this level, the price will cross an important psychological barrier, which can strengthen the bullish momentum. It would be reasonable to lock partial profits at that level.
The support level at 0.1400 is also an important zone from which the price can rally if a correction occurs. Historically, this level has served as strong support during market rollbacks. After a fall below 0.1400, the price may pull back to 0.1600. If the price continues declining and breaks a level of 0.1300, the downward move may reach critical support at 0.1000. Consider exiting positions if there are no signs of recovery.
Monitor the MACD and Stochastic indicators to identify signals for a trend reversal. An upward crossover of the MACD lines or Stochastic’s oversold signals may indicate favorable conditions for buying.
Start trading with a trustworthy broker
Expert Projections for TRX Price in 2025
Leading agencies offer a detailed analysis of the current situation and the factors that shape the TRX price. Let’s examine expert conclusions and consider the key factors influencing the coin’s rate next year.
LongForecast
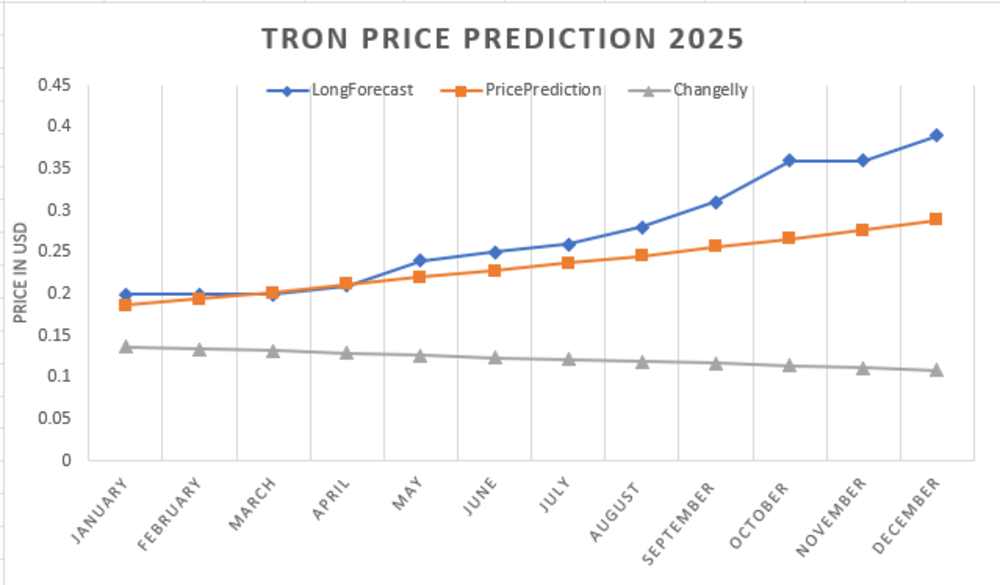
Price range for 2025: $0.18 – $0.39 (estimated as of 10.10.2024).
LongForecast suggests that the sideways range of 2024 will transform into a strong bullish trend in 2025. Opening at 0.18, the price will steadily grow throughout the next twelve months, reaching a peak of 0.40 in December.
|
Month |
Opening, $ |
Min.– Max., $ |
Closing, $ |
|
January |
0.18 |
0.18-0.21 |
0.20 |
|
February |
0.20 |
0.19-0.21 |
0.20 |
|
March |
0.20 |
0.19-0.21 |
0.20 |
|
April |
0.20 |
0.20-0.22 |
0.21 |
|
May |
0.21 |
0.21-0.26 |
0.24 |
|
June |
0.24 |
0.23-0.27 |
0.25 |
|
July |
0.25 |
0.24-0.28 |
0.26 |
|
August |
0.36 |
0.26-0.30 |
0.28 |
|
September |
0.28 |
0.28-0.33 |
0.31 |
|
October |
0.31 |
0.31-0.39 |
0.36 |
|
November |
0.36 |
0.33-0.39 |
0.36 |
|
December |
0.36 |
0.34-0.40 |
0.37 |
PricePrediction
Price range for 2025: $0.1662 – $0.2886 (estimated as of 10.10.2024).
Price Prediction Network projects the TRON price to vary from 0.2479 to 0.2886 by the end of 2025. The coin is expected to reach an average of 0.2565, which suggests positive market sentiment and a bullish trend.
|
Month |
Minimum, $ |
Average price, $ |
Maximum, $ |
|
January |
0.1662 |
0.1818 |
0.1870 |
|
February |
0.1804 |
0.1891 |
0.1943 |
|
March |
0.1897 |
0.1967 |
0.2019 |
|
April |
0.1976 |
0.2045 |
0.2117 |
|
May |
0.2000 |
0.2086 |
0.2199 |
|
June |
0.2083 |
0.2170 |
0.2282 |
|
July |
0.2165 |
0.2235 |
0.2369 |
|
August |
0.2293 |
0.2279 |
0.2458 |
|
September |
0.2256 |
0.2325 |
0.2572 |
|
October |
0.2331 |
0.2418 |
0.2665 |
|
November |
0.2421 |
0.2490 |
0.2762 |
|
December |
0.2479 |
0.2565 |
0.2886 |
Changelly
Price range for 2025: $0.0755 – $0.158 (estimated as of 10.10.2024).
Experts at Changelly anticipate a bearish trend, expecting the TRON price to head for 0.0755-0.109 by the end of 2025. Their forecast reflects pessimism about the coin’s market values and potential for growth.
|
Month |
Minimum, $ |
Average price, $ |
Maximum, $ |
|
January |
0.155 |
0.158 |
0.137 |
|
February |
0.105 |
0.156 |
0.134 |
|
March |
0.101 |
0.155 |
0.132 |
|
April |
0.105 |
0.154 |
0.129 |
|
May |
0.101 |
0.152 |
0.127 |
|
June |
0.0973 |
0.151 |
0.124 |
|
July |
0.0936 |
0.150 |
0.122 |
|
August |
0.0900 |
0.148 |
0.119 |
|
September |
0.0864 |
0.147 |
0.117 |
|
October |
0.0828 |
0.146 |
0.114 |
|
November |
0.0791 |
0.144 |
0.112 |
|
December |
0.0755 |
0.143 |
0.109 |
Coin Price Forecast
Price range for 2025: $0.24 – $0.22 (estimated as of 10.10.2024).
According to Coin Price Forecast, the TRON price will settle at 0.24 in the first six months of 2025. By year-end, the TRXUSD value is projected to hit 0.22.
|
Year |
Mid-Year, $ |
Year-end, $ |
|
2025 |
0.24 |
0.22 |
Expert Projections for TRX Price in 2026
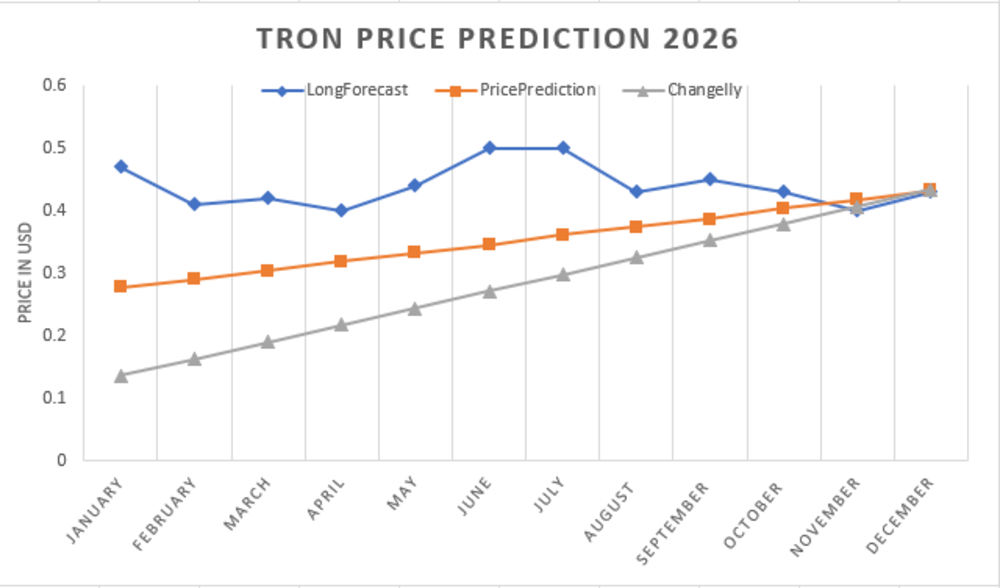
Most experts agree that a bullish scenario should be prioritized in 2026.
LongForecast
Price range for 2026: $0.37 – $0.54 (estimated as of 10.10.2024).
Analysts at LongForecast expect the altcoin to rise, fluctuating from $0.37 to $0.54 throughout 2026 after its growth in 2025.
|
Month |
Opening, $ |
Min.– Max., $ |
Closing, $ |
|
January |
0.37 |
0.34-0.40 |
0.47 |
|
February |
0.37 |
0.37-0.44 |
0.41 |
|
March |
0.41 |
0.39-0.45 |
0.42 |
|
April |
0.42 |
0.37-0.43 |
0.40 |
|
May |
0.40 |
0.40-0.47 |
0.44 |
|
June |
0.44 |
0.44-0.54 |
0.50 |
|
July |
0.50 |
0.47-0.54 |
0.50 |
|
August |
0.50 |
0.40-0.50 |
0.43 |
|
September |
0.43 |
0.42-0.48 |
0.45 |
|
October |
0.45 |
0.40-0.46 |
0.43 |
|
November |
0.43 |
0.37-0.43 |
0.40 |
|
December |
0.40 |
0.40-0.46 |
0.43 |
PricePrediction
Price range for 2026: $0.2437 – $0.4325 (estimated as of 10.10.2024).
According to PricePrediction.net, the TRX cryptocurrency is set to grow in 2026, ranging from 0.2437 to 0.4325. Experts anticipate an average price of 0.3837 by the end of 2026.
|
Month |
Minimum, $ |
Average price, $ |
Maximum, $ |
|
January |
0.2437 |
0.2693 |
0.2770 |
|
February |
0.2619 |
0.2747 |
0.2905 |
|
March |
0.2674 |
0.2802 |
0.3042 |
|
April |
0.2812 |
0.2914 |
0.3183 |
|
May |
0.2928 |
0.3031 |
0.3328 |
|
June |
0.3019 |
0.3122 |
0.3450 |
|
July |
0.3056 |
0.3184 |
0.3606 |
|
August |
0.3209 |
0.3312 |
0.3733 |
|
September |
0.3283 |
0.3411 |
0.3865 |
|
October |
0.3445 |
0.3547 |
0.4036 |
|
November |
0.3561 |
0.3689 |
0.4178 |
|
December |
0.3734 |
0.3837 |
0.4325 |
Changelly
Price range for 2026: $0.273 – $0.396 (estimated as of 10.10.2024).
Analysts at Changelly expect the TRON price to consistently grow in 2026. The projected range is at 0.100-0.433. The average price may reach 0.344, suggesting gradual growth throughout the year.
|
Month |
Minimum, $ |
Average price, $ |
Maximum, $ |
|
January |
0.100 |
0.163 |
0.136 |
|
February |
0.125 |
0.183 |
0.163 |
|
March |
0.150 |
0.203 |
0.190 |
|
April |
0.175 |
0.223 |
0.217 |
|
May |
0.200 |
0.243 |
0.244 |
|
June |
0.224 |
0.263 |
0.271 |
|
July |
0.249 |
0.283 |
0.298 |
|
August |
0.274 |
0.303 |
0.325 |
|
September |
0.299 |
0.324 |
0.352 |
|
October |
0.324 |
0.344 |
0.379 |
|
November |
0.349 |
0.364 |
0.406 |
|
December |
0.373 |
0.384 |
0.433 |
Coin Price Forecast
Price range for 2026: $0.28 – $0.31 (estimated as of 10.10.2024).
Coin Price Forecast anticipates a bullish trajectory for the TRON price up to mid-2026. In the middle of the year, the price will likely hit 0.24 and grow to 0.26 by year-end.
|
Year |
Mid-Year, $ |
Year-end, $ |
|
2026 |
0.24 |
0.26 |
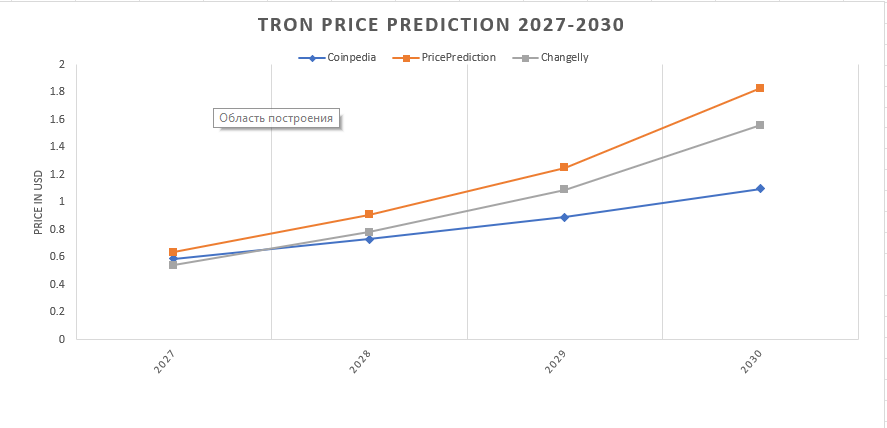
Long-Term TRX Forecast for 2027-2030
Experts’ forecasts for the TRXUSD rate in 2027-2030 suggest significant growth.
CoinPedia
CoinPedia‘s analysis presumes the coin will hit a new all-time high of 1.10 by 2030. This bullish scenario highlights growing positive sentiment regarding the Tron value.
|
Year |
Potential low, $ |
Average price, $ |
Potential high, $ |
|
2027 |
0.114 |
0.357 |
0.59 |
|
2028 |
0.234 |
0.487 |
0.73 |
|
2029 |
0.297 |
0.593 |
0.89 |
|
2030 |
0.4167 |
0.753 |
1.10 |
PricePrediction
PricePrediction believes TRON will gather momentum in 2027-2030 to break a level of $1 in 2029. This indicates investors’ growing confidence in the altcoin’s future performance.
|
Year |
Minimum, $ |
Average price, $ |
Maximum, $ |
|
2027 |
0.5223 |
0.5414 |
0.6355 |
|
2028 |
0.7079 |
0.7349 |
0.9082 |
|
2029 |
1.05 |
1.08 |
1.25 |
|
2030 |
1.47 |
1.52 |
1.83 |
Changelly
Changelly forecasts TRX’s growth in 2027-2030. The maximum price is expected to reach 0.542 and 1.32 in 2027 and 2030, respectively. Ongoing developments in the DeFi ecosystem and the growing number of platform users are expected to drive TRX’s growth.
|
Year |
Minimum, $ |
Average price, $ |
Maximum, $ |
|
2027 |
0.454 |
0.469 |
0.542 |
|
2028 |
0.623 |
0.646 |
0.783 |
|
2029 |
0.893 |
0.922 |
1.09 |
|
2030 |
1.28 |
1.32 |
1.56 |
Coin Price Forecast
Coin Price Forecast predicts overall growth for the TRX price. However, quotes will likely fluctuate throughout the whole 4-year period.
|
Year |
Mid-Year, $ |
Year-end, $ |
|
2027 |
0.30 |
0.34 |
|
2028 |
0.35 |
0.39 |
|
2029 |
0.41 |
0.44 |
|
2030 |
0.41 |
0.38 |
Recent Price History of the (TRX) Tron coin
The price of the Tron (TRX) cryptocurrency has seen significant volatility since its launch in 2017. Starting from $0.008, the TRX coin experienced massive growth, reaching an all-time high of $0.30 in early 2018. However, the decline of the crypto market soon brought the price back down to $0.01 by the end of 2018. Over the next few years, TRX struggled to regain its highs, trading between $0.01 and $0.05. In 2021, TRX reached $0.18 amid a resurgent crypto market.
However, 2022 saw prices decline to an average of $0.05 due to broader crypto market weakness. Currently, TRX is trading at around $0.16000, with a market cap of $9.35 billion. As per Tron price predictions, the long-term prospects look bullish, with expert forecasts suggesting TRX could reach over $1 in 2029.
What factors influence the TRX Price?
The TRX price is affected by many factors, including overall sentiment in the cryptocurrency market, supply and demand levels, regulatory changes, technological upgrades to the TRON network, partnerships, economic events, and global trends in the financial sector.
-
Network Upgrades. The upcoming Tron Periander upgrade will boost Tron’s network capabilities and EVM compatibility. This could have a positive effect on TRX’s price.
-
Regulatory Issues. The ongoing court case between Tron’s founder and the SEC could negatively impact investor confidence and TRX price.
-
Macroeconomics. Potential interest rate hikes by the Federal Reserve in 2024 could result in declining crypto prices, including TRX, across the board.
-
Technical Analysis. The TRX price chart shows an upward trend, with support around $0.047. If this holds, TRX could climb to resistance at $0.09.
-
Legal/regulatory and macroeconomic issues may offset network upgrades and bullish technical indicators.
Conclusion: Is It Worth Investing in TRX?
Regarding TRX’s market performance, investing in Tron is a good option for long-term portfolios. Current prices around $0.16000 present a good entry point, with forecasts suggesting TRX could reach over $0.18 by 2024 and continue appreciating to hit highs between $0.73 and $1.52 by 2030.
The key advantages are Tron’s robust blockchain technology and ecosystem catering to content. However, regulatory disputes and potential market volatility remain risks worth monitoring. Analysts presume that TRX is poised for steady, incremental growth.
TRX Price Prediction FAQ
The current price of TRX is around $0.16000, as of today, 17.10.2024.
The success of TRON as a blockchain, along with the growth of DeFi and NFTs on the platform, could support the price above 0.2000, with the potential for growth up to and beyond 0.2500. The TRX price could fall to 0.0800 or lower if unfavorable factors arise.
Experts suggest that the price of 1 TRX will fluctuate at $0.2-$0.3 if current trends continue. However, much depends on market factors, regulatory changes, and the overall development of the crypto asset sector, which can affect the price.
TRX is a promising investment due to TRON’s development as a platform for DApps, DeFi, and NFTs, its high transaction speeds, low fees, and the strong support from a team led by Justin Sun.
The TRX price is influenced by various factors. Like other cryptocurrencies, TRON is affected by regulatory changes in the crypto market, the global economic climate, and conditions specific to the cryptocurrency sector. The project’s competitiveness and the development of the blockchain platform are also crucial.
According to some long-term forecasts, TRON (TRX) may reach $1 by 2030 or later if blockchain technology and the TRON ecosystem develop sustainably, along with favorable conditions in the cryptocurrency market.
If TRON continues to enhance its technology, expand its ecosystem, and attract new projects, TRX has the potential for long-term growth. However, as with any cryptocurrency, success will depend on market conditions and the platform’s ability to adapt to changing trends
Further developments in the TRON blockchain, including improved scalability, the introduction of new technologies, and the advancement of decentralized applications (dApps), could significantly increase investor interest. This contributes to a larger demand for TRX and, as a result, its price growth.
Price chart of TRXUSD in real time mode

The content of this article reflects the author’s opinion and does not necessarily reflect the official position of LiteFinance. The material published on this page is provided for informational purposes only and should not be considered as the provision of investment advice for the purposes of Directive 2004/39/EC.
{{value}} ( {{count}} {{title}} )
This post is originally published on LITEFINANCE.


