
Financial analysts are optimistic about the S&P 500’s future and expect growth after the recent downturn. A potential interest rate cut by the Fed also fuels this optimism. Despite geopolitical tensions and inflation risks, forecasts point to a long-term uptrend, making the S&P 500 an appealing investment.
Analysts expect that the stock prices comprising the S&P 500 index will rise. Significant growth is projected in 2024 and will continue despite various economic and geopolitical challenges.
The article covers the following subjects:
Highlights and Key Points: S&P 500 Forecast 2024–2030
- Sales Growth and Dividend Yield. The S&P 500 is anticipated to grow significantly by the end of 2024, reflecting optimism in sales growth and dividend yield over the next decade.
- Valuation and Rise. A substantial rise in valuation is expected, with an increase by the end of 2024 and 2025, indicating a bullish market trend.
- Economic Outlook. Despite challenges, a positive economic outlook is highlighted, suggesting a long-term upward trajectory for the S&P 500.
- Stock Prices. The securities are predicted to increase in value significantly, strengthening the S&P 500 index.
- Earnings Per Share. The high level of EPS is due to the upward movement of the S&P 500 index.
S&P 500 Price Today Coming Days and Week
The S&P 500 has recently been in the spotlight thanks to the most optimistic year-end forecast by Wall Street experts. The price is expected to reach $6 200 by the end of 2024. This upward revision is due to a significant rise in stock prices that surpassed prior expectations. Improved earnings, solid US economic growth, and potential changes in the Fed’s interest rate policy were the key factors bolstering this optimistic view.
Get access to a demo account on an easy-to-use Forex platform without registration
S&P 500 Price Forecast for 2024
The S&P 500 index continues to captivate investors and shows steady growth. CoinPriceForecast predicts that the price will hit $5 475 in early August and close at $6 084 in December. Analysts are assured of an uptrend given global events, investors’ sentiment, and US economic policy.
CoinPriceForecast
Price Range: $4 769 – $6 084 (as of July 30, 2024)
CoinPriceForecast predicts the S&P 500 to rise significantly by the end of 2024. The rate may reach $6 084 in December. This uptrend reflects optimism regarding the earnings and prospects of the companies included in the index for the next decade.
| Year | Year-End, $ |
|---|---|
| 2024 | 6 084 |
LongForecast
Price Range: $4 928 – $6 367 (as of July 30, 2024)
According to LongForecast, the S&P 500 index will rise by December 2024. In August, the price will start at $5 468 and close the year at $5 812. Analysts’ optimism is based on the positive outlook for corporate earnings, although significant price fluctuations are possible during this period.
| Month | Open, $ | Min–Max, $ | Close, $ |
|---|---|---|---|
| August | 5 468 | 4 928 – 5 916 | 5 454 |
| September | 5 454 | 5 059 – 6 054 | 5 658 |
| October | 5 658 | 5 534 – 6 367 | 5 950 |
| November | 5 950 | 5 295 – 6 093 | 5 694 |
| December | 5 694 | 5 405 – 6 219 | 5 812 |
S&P 500 Index Technical Analysis
Technical analysis of the S&P 500 requires various tools and indicators. When analyzing the price movements, short-term (daily and weekly) and long-term (monthly) time frames are utilized. Besides, multiple indicators can be helpful for technical analysis. Moving averages (SMA and EMA) help determine the direction of the trend, and the RSI and MACD oscillators are used to assess the trend’s strength and spot potential reversals.
Bollinger Bands gauge volatility and indicate the oversold/overbought condition. The on-balance volume indicator helps monitor changes in trading volumes and identify trends. Popular patterns such as “Triangles” and price channels provide signals of potential trend continuation or reversals. These tools allow you to forecast the S&P 500 price movements more accurately, considering current market conditions and historical price dynamics.
blog
Promo code
#SPX Analysis For Next Three Months
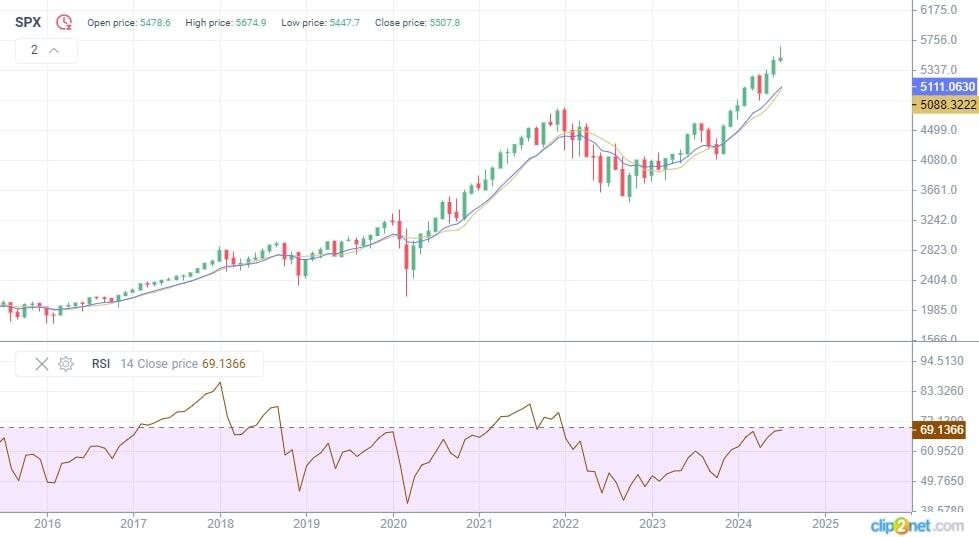
The S&P 500 technical analysis for the next three months shows several key scenarios on the weekly time frame. The index is currently trading at the upper Bollinger band, indicating the highest level of volatility and potential market overheating.

The RSI is at 68, near the overbought zone, signaling potential short-term corrections. At the same time, the on-balance volume has been growing since October 2022. Trading volumes are increasing, which confirms the strength of the current trend.

The EMA and SMA moving averages almost coincide below the current price, which signals a potential correction. If the index breaks through the current resistance level near the upper boundary of Bollinger Bands, the price may grow to $5 700 – $5 800.
However, if the correction starts, the support level may shift to $4 600 and $5 300, where the EMA and SMA can provide support. Overall, the short-term outlook suggests that the growth may continue with potential corrections.
Long-Term S&P 500 Technical Analysis for 2024
The S&P 500 long-term technical analysis for 2024 suggests several key scenarios given current market conditions and technical indicators. At the beginning of 2024, the index traded at $5,622, representing a new historic high. The S&P 500 may continue to trend upward over the year if it breaks through the nearest resistance level of $5 700. A breach of this level may boost the further growth to $5 800 – $5 900.
The SMA and EMA show that the short-term averages are below the long-term averages on the monthly time frame, indicating a potential correction. The RSI at 69 is close to the overbought zone, which may signal short-term pullbacks or a growth slowdown.
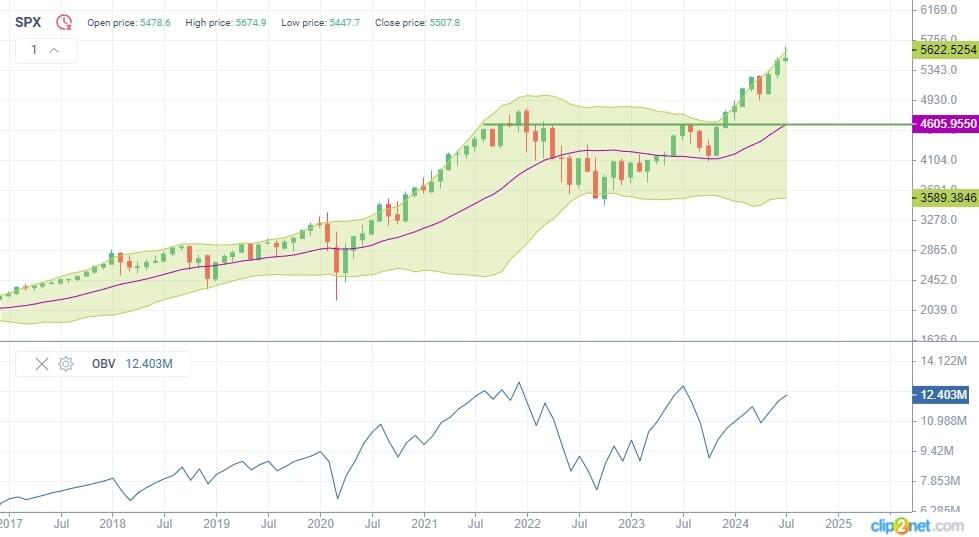
The Bollinger Bands reveal that the index is near the upper boundary of the range, which may indicate higher volatility and the possibility of short-term corrections. The on-balance volume indicator has been rising since October 2023, confirming the bullish trend and bolstering positive outlooks.
The main support line is at $4 600. In case of a significant decline, the price will fall to this mark. Nevertheless, given the positive technical signals and current market conditions, the long-term outlook for 2024 remains optimistic, and the price may rise to $5 800 – $5 900.
| Month | S&P 500 price forecast (SPX) | |
|---|---|---|
| Minimum, $ | Maximum, $ | |
| August 2024 | 5 152 | 6 110 |
| September 2024 | 5 417 | 6 263 |
| October 2024 | 5 707 | 6 597 |
| November 2024 | 5 453 | 6 305 |
| December 2024 | 5 571 | 6 239 |
Long-term trading plan for S&P 500 (SPX)
Let’s determine the targets for the next 3-month period and next 12-month period as well.
Targets for 3 months:
- Target resistance level: $5 700.
- If the asset breaks through this level, the price may grow to $5 800 – $5 900.
- If a correction starts, the price will unlikely breach the support level of $5 300 – $5 400.
- Recommendations:
- If the asset breaks through $5 700, consider long trades with the target at $5 800.
- Once the index reaches the upper boundary of the Bollinger Bands and the RSI values exceed 70, short trades can be opened.
- Risks and corrections:
- Short-term corrections towards $5 300 – $5 400 may unfold.
- Stop-loss: $5 250.
Targets for the year:
- Target resistance level: $5 800 – $5 900.
- The price may grow during the year if the current uptrend continues.
- Target support level: $4 800.
- Recommendations:
- If the price breaches and consolidates above the $5 800 level, open long trades with the target of $5 900 – $6 000.
- Should the price drop below $4 800, consider short trades.
Start trading with a trustworthy broker
S&P 500 Price Predictions for 2025
The S&P 500 forecast for 2025 suggests that the long-term uptrend may continue, given current economic indicators and positive corporate earnings reports. The index may reach new highs despite potential fluctuations. General optimism among investors and stable economic growth will fuel this uptrend.
CoinPriceForecast
Price Range: $6 123 – $6 544 (as of July 30, 2024)
According to CoinPriceForecast, the S&P 500 Index will rise to $6 544 by the end of 2025, starting at $6 123 in the mid-year. This forecast reflects optimism about US economic policy and sustained corporate earnings growth.
| Year | Mid-Year, $ | Year-End, $ |
|---|---|---|
| 2025 | 6 123 | 6 544 |
LongForecast
Price Range: $5 660 – $8 898 (as of July 30, 2024)
LongForecast predicts steady growth of the S&P 500 index in 2024. In January, the price will reach $6 086 and rise to $8 316 in December. This uptrend is due to bullish market sentiment, potential positive economic data, and solid corporate earnings.
| Month | Open, $ | Min–Max, $ | Close, $ |
|---|---|---|---|
| January | 5 812 | 5 660 – 6 512 | 6 086 |
| February | 6 086 | 5 822 – 6 698 | 6 260 |
| March | 6 260 | 6 044 – 6 954 | 6 499 |
| April | 6 499 | 6 499 – 7 539 | 7 046 |
| May | 7 046 | 6 572 – 7 562 | 7 067 |
| June | 7 067 | 6 655 – 7 657 | 7 156 |
| July | 7 156 | 6 677 – 7 683 | 7 180 |
| August | 7 180 | 6 867 – 7 901 | 7 384 |
| September | 7 384 | 7 240 – 8 330 | 7 785 |
| October | 7 785 | 7 332 – 8 436 | 7 884 |
| November | 7 884 | 7 436 – 8 556 | 7 996 |
| December | 7 996 | 7 734 – 8 898 | 8 316 |
S&P 500 Price Predictions for 2026
As for 2026, the S&P 500 is still the center of investors’ attention. The value of the index will depend on the Fed’s monetary policy, inflation, and the US economic condition.
CoinPriceForecast
Price Range: $6 544 – $7 488 (as of July 30, 2024)
According to CoinPriceForecast, in 2026, the S&P 500 will start trading at $6 544 and reach $6 988 within the first six months. By the end of the year, the price will likely rise to $7 488, reflecting strong bullish sentiment and favorable economic conditions.
| Year | Mid-Year, $ | Year-End, $ |
|---|---|---|
| 2026 | 6 988 | 7 488 |
LongForecast
Price Range: $6 791 – $9 805 (as of July 30, 2024)
LongForecast predicts that the S&P 500 index will trade at high levels in early 2026, but the price may undergo high volatility. Despite a temporary decline, the price will grow by the end of the year, maintaining the bullish trend.
| Month | Open, $ | Min–Max, $ | Close, $ |
|---|---|---|---|
| January | 8 316 | 7 419 – 8 535 | 7 977 |
| February | 7 977 | 7 959 – 9 157 | 8 558 |
| March | 8 558 | 7 496 – 8 624 | 8 060 |
| April | 8 060 | 7 925 – 9 117 | 8 521 |
| May | 8 521 | 8 521 – 9 805 | 9 164 |
| June | 9 164 | 7 703 – 9 164 | 8 283 |
| July | 8 283 | 7 420 – 8 536 | 7 978 |
| August | 7 978 | 7 978 – 9 191 | 8 590 |
| September | 8 590 | 6 791 – 8 590 | 7 302 |
| October | 7 302 | 7 045 – 8 105 | 7 575 |
| November | 7 575 | 7 408 – 8 524 | 7 966 |
| December | 7 966 | 7 090 – 8 158 | 7 624 |
Recent Price History of S&P 500
The S&P 500 financial instrument has traversed through notable price levels over the years, highlighting significant moments in its trajectory:
- Pandemic Low. In March 2020, the SPX fell sharply due to global economic uncertainty amidst covid restrictions.
- Recovery Rally. After a drop to the 2020 low, the S&P 500 rate began to grow due to the Fed’s monetary stimulus measures and economic recovery.
- Record Highs. By 2021, the index rate reached new all-time highs. The increase was driven by economic recovery, rising corporate earnings, and general market optimism.
- Interest Rate Concerns. From December 2021 to July 2022, the price traded in a bearish trend. At the same time, the quotes significantly fluctuated due to market concerns about further key rate hikes.
- The price has been recovering after a strong bearish trend since September 2023.
- The S&P 500 has reached new record highs during tough economic times. The current all-time high is $5 674.

Identifying these critical years and price levels is crucial for investors using the S&P 500 price forecast to inform their strategies, providing a historical context to anticipate future market movements.
Long-Term S&P 500 Predictions 2027–2030
CoinPriceForecast predicts that the S&P 500 Index will grow steadily in the coming years. From mid-2027 through the end of 2030, the price may increase to more than $10 000. Investors can expect significant gains, given current trends and economic conditions.
| Year | Mid-Year, $ | Year-End, $ |
|---|---|---|
| 2027 | 7 724 | 8 375 |
| 2028 | 8 603 | 8 613 |
| 2029 | 8 703 | 9 415 |
| 2030 | 10 024 | 10 718 |
Factors That Can Affect S&P 500 price
When making trading and investment decisions, it is important to consider the following factors affecting the S&P 500 index rate:
- Earnings Per Share. The aggregate earnings of US companies comprising the S&P 500 index impact significantly the price outlook. A higher EPS signals a potential uptrend.
- Economic Indicators. Indicators such as GDP growth, unemployment rate, and consumer spending gauge the economic condition and influence the future S&P 500 rate trajectory.
- Interest Rates. Higher interest rates may increase companies’ borrowing costs, lowering corporate earnings and negatively impacting the S&P 500 index.
- Global Market Trends. The movement of indices around the world may affect the value of SPX.
- Investor Sentiment. Investor valuations and expectations based on general financial conditions, news, and market forecasts can cause significant fluctuations in the S&P 500 price.
Investing in the S&P 500 requires knowledge and experience. Such a highly volatile asset is not suitable for everyone. You need to consider the fundamentals and be able to predict market changes.
Is It Worth Investing in S&P 500?

The S&P 500 remains an attractive investment, given current forecasts and market trends. Based on current data, the S&P 500 Index will show steady growth in the coming years, with an increase to more than $10 000 by 2030. Key factors such as central bank policies, global economic conditions, and the financial performance of the companies comprising the index will determine its direction.
Before investing in the S&P 500, remember that the index is a key indicator of the US stock market’s health. The index combines growth potential and certain risks depending on economic cycles and corporate earnings.
Long-term investments require assessing your financial goals, risk tolerance, and ability to withstand market fluctuations. Besides, portfolio diversification and monitoring market trends can help you make more informed decisions.
S&P 500 Price Prediction FAQ
The S&P 500 index is currently trading at $5 478.9 as of today, 30.07.2024.
Yes, the S&P 500 is expected to rise. Forecasts suggest a significant increase to more than $10 000 by 2030. Favorable economic conditions and corporate earnings fuel this optimism.
The S&P 500 is expected to grow in 2024, hitting $6 367 at the end of the year. Positive economic trends bolster the forecasts.
The 2025 forecast suggests that the S&P 500 index will increase from $5 660 to $8 898 by the end of the year, indicating a bullish trend, supported by favorable economic conditions and corporate earnings.
The S&P 500 index is projected to reach $10 718 in 2030, reflecting long-term growth driven by solid market trends and economic activity.
Over the next decade, the S&P 500’s yields could vary widely due to macroeconomic factors such as inflation, interest rates, AI technology development, and global economic conditions. Wall Street experts maintain cautious optimism.
Investing in the S&P 500 now may be sensible, considering the current positive growth outlook and long-term upside potential. With the index expected to increase to more than $10 000 by 2030, investing in the S&P 500 can be profitable. However, evaluating your financial goals and readiness to withstand market fluctuations is essential.
Price chart of SPX in real time mode

The content of this article reflects the author’s opinion and does not necessarily reflect the official position of LiteFinance. The material published on this page is provided for informational purposes only and should not be considered as the provision of investment advice for the purposes of Directive 2004/39/EC.
{{value}} ( {{count}} {{title}} )
This post is originally published on LITEFINANCE.


