I welcome my fellow traders! I have made a price forecast for the USCrude, XAUUSD, and EURUSD using a combination of margin zones methodology and technical analysis. Based on the market analysis, I suggest entry signals for intraday traders.
The euro price reached the first buy target yesterday.
The article covers the following subjects:
Major Takeaways
- USCrude: Oil is declining within a short-term downtrend.
- XAUUSD: Gold sellers held the resistance zone 2940 – 2933.
- EURUSD: The euro reached the Target Zone 1.0514 – 1.0486.
Oil Price Forecast for Today: USCrude Analysis
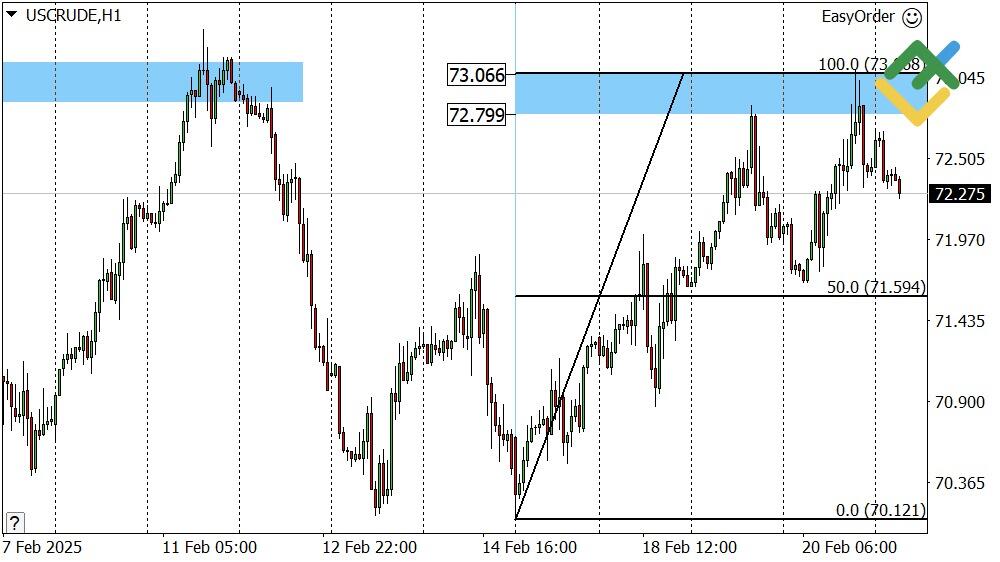
Oil prices tested the resistance (А) 73.06 – 72.79 yesterday, and the short-term trend remained bearish. So, opening short trades at the resistance level (A) was a wise decision, with the first target at 71.69 and the second target near 70.12. Since today is Friday and holding short-term trades over the weekend is not advisable, set a Stop Loss at breakeven for open trades.
If the resistance (А) is broken to the upside, the correction will continue with a target at resistance (В) 74.53 – 74.13.
USCrude Trading Ideas for Today:
Hold shorts near resistance (А) 73.06 – 72.79. TakeProfit: 71.58, 70.12. StopLoss: breakeven.
Gold Forecast for Today: XAUUSD Analysis
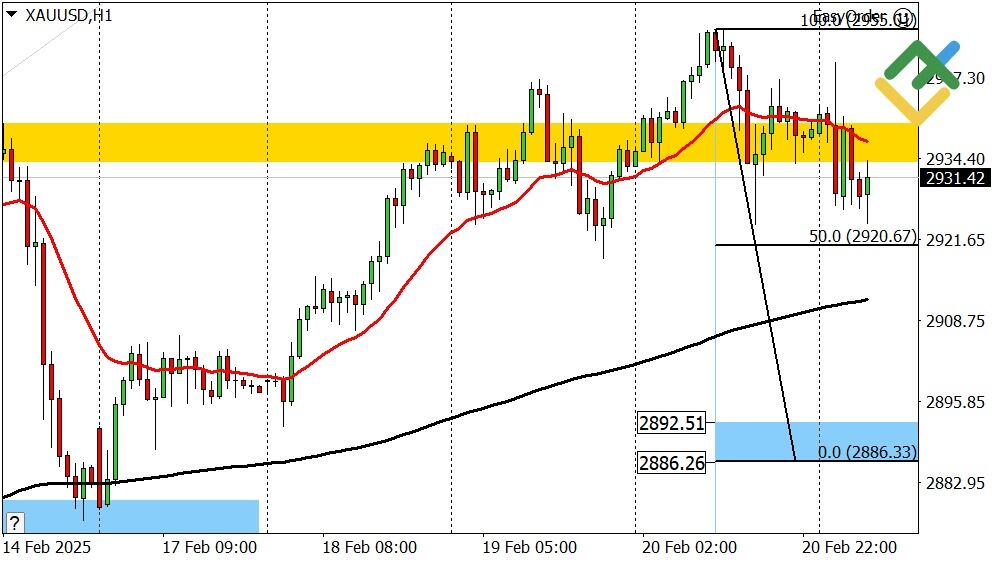
Gold attempts to break above the Gold Zone 2940 – 2933 and settle higher. If it manages to do so, the next growth target of the short-term uptrend will be the Target Zone 3008 – 2996. If sellers hold their positions in the golden zone, a downward correction will start.
If so, the price may fall to the support (A) 2892 – 2886. Once this zone is tested, new longs can be considered, with the first target at 2920 and the second one near 2955.
XAUUSD Trading Ideas for Today:
Watch the market.
Euro/Dollar Forecast for Today: EURUSD Analysis
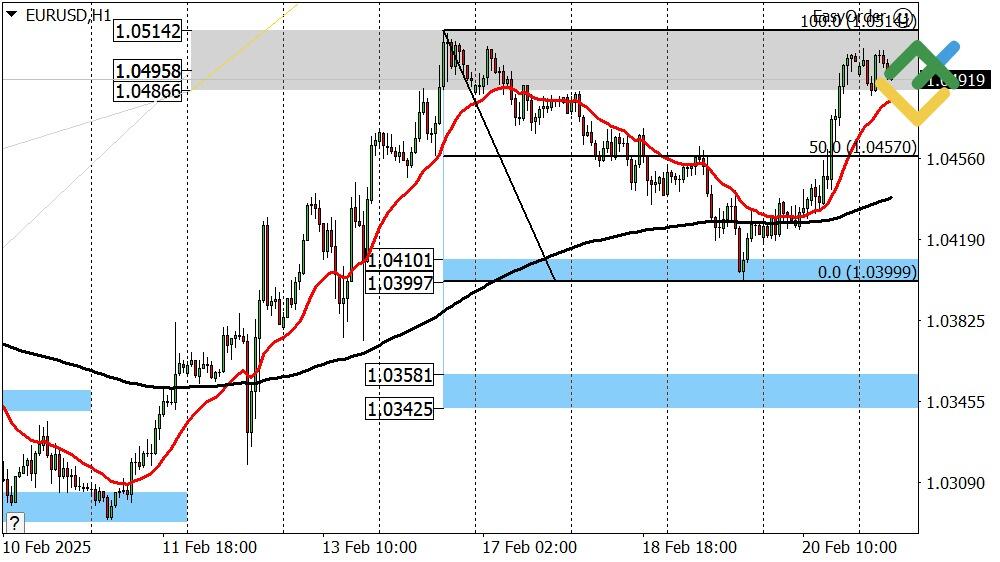
The first target for euro longs from support (А) 1.0410 – 1.0399 was reached yesterday at 1.0457. The growth continued afterward, closing the day near the Target Zone 1.0514 – 1.0486, so the remaining portion of the longs can be closed today at an advantageous price.
If the Target Zone is broken to the upside, the next buy target will be the Gold Zone 1.0601 – 1.0590. If this zone is held by sellers, a bearish correction will develop with a target at support (А) 1.0410 – 1.0399.
EURUSD Trading Ideas for Today:
Watch the market.
Would you like to learn more about technical analysis methods and principles? Explore our comprehensive guide.
P.S. Did you like my article? Share it in social networks: it will be the best “thank you” 🙂
Ask me questions and comment below. I’ll be glad to answer your questions and give necessary explanations.
Useful links:
- I recommend trying to trade with a reliable broker here. The system allows you to trade by yourself or copy successful traders from all across the globe.
- Use my promo code BLOG for getting deposit bonus 50% on LiteFinance platform. Just enter this code in the appropriate field while depositing your trading account.
- Telegram chat for traders: https://t.me/litefinancebrokerchat. We are sharing the signals and trading experience.
- Telegram channel with high-quality analytics, Forex reviews, training articles, and other useful things for traders https://t.me/litefinance
Price chart of EURUSD in real time mode
The content of this article reflects the author’s opinion and does not necessarily reflect the official position of LiteFinance broker. The material published on this page is provided for informational purposes only and should not be considered as the provision of investment advice for the purposes of Directive 2014/65/EU.
According to copyright law, this article is considered intellectual property, which includes a prohibition on copying and distributing it without consent.
{{value}} ( {{count}} {{title}} )
This post is originally published on LITEFINANCE.


