
I welcome my fellow traders! I have made a price forecast for the USCrude, XAUUSD, and EURUSD using a combination of margin zones methodology and technical analysis. Based on the market analysis, I suggest entry signals for intraday traders.
The euro reversed its short-term downtrend yesterday.
The article covers the following subjects:
Highlights and key points
-
USCrude: Oil has reversed its short-term downtrend.
-
XAUUSD: Gold continues to strengthen. The bullish target is the Target Zone 2, 2629 – 2619.
-
EURUSD: The euro reversed its short-term downtrend yesterday. Now, the bullish target is the upper Target Zone 1.1279 – 1.1254.
Oil price forecast for today: USCrude analysis
Oil reversed its short-term downtrend and broke through the resistance (B) 69.65 – 69.20 yesterday. The main bullish target is the upper Target Zone 74.59 – 73.70.
Consider long trades on a bearish correction at the strong support (A) 68.82 – 68.56 and support (B) 67.52 – 67.13 once these zones are tested.
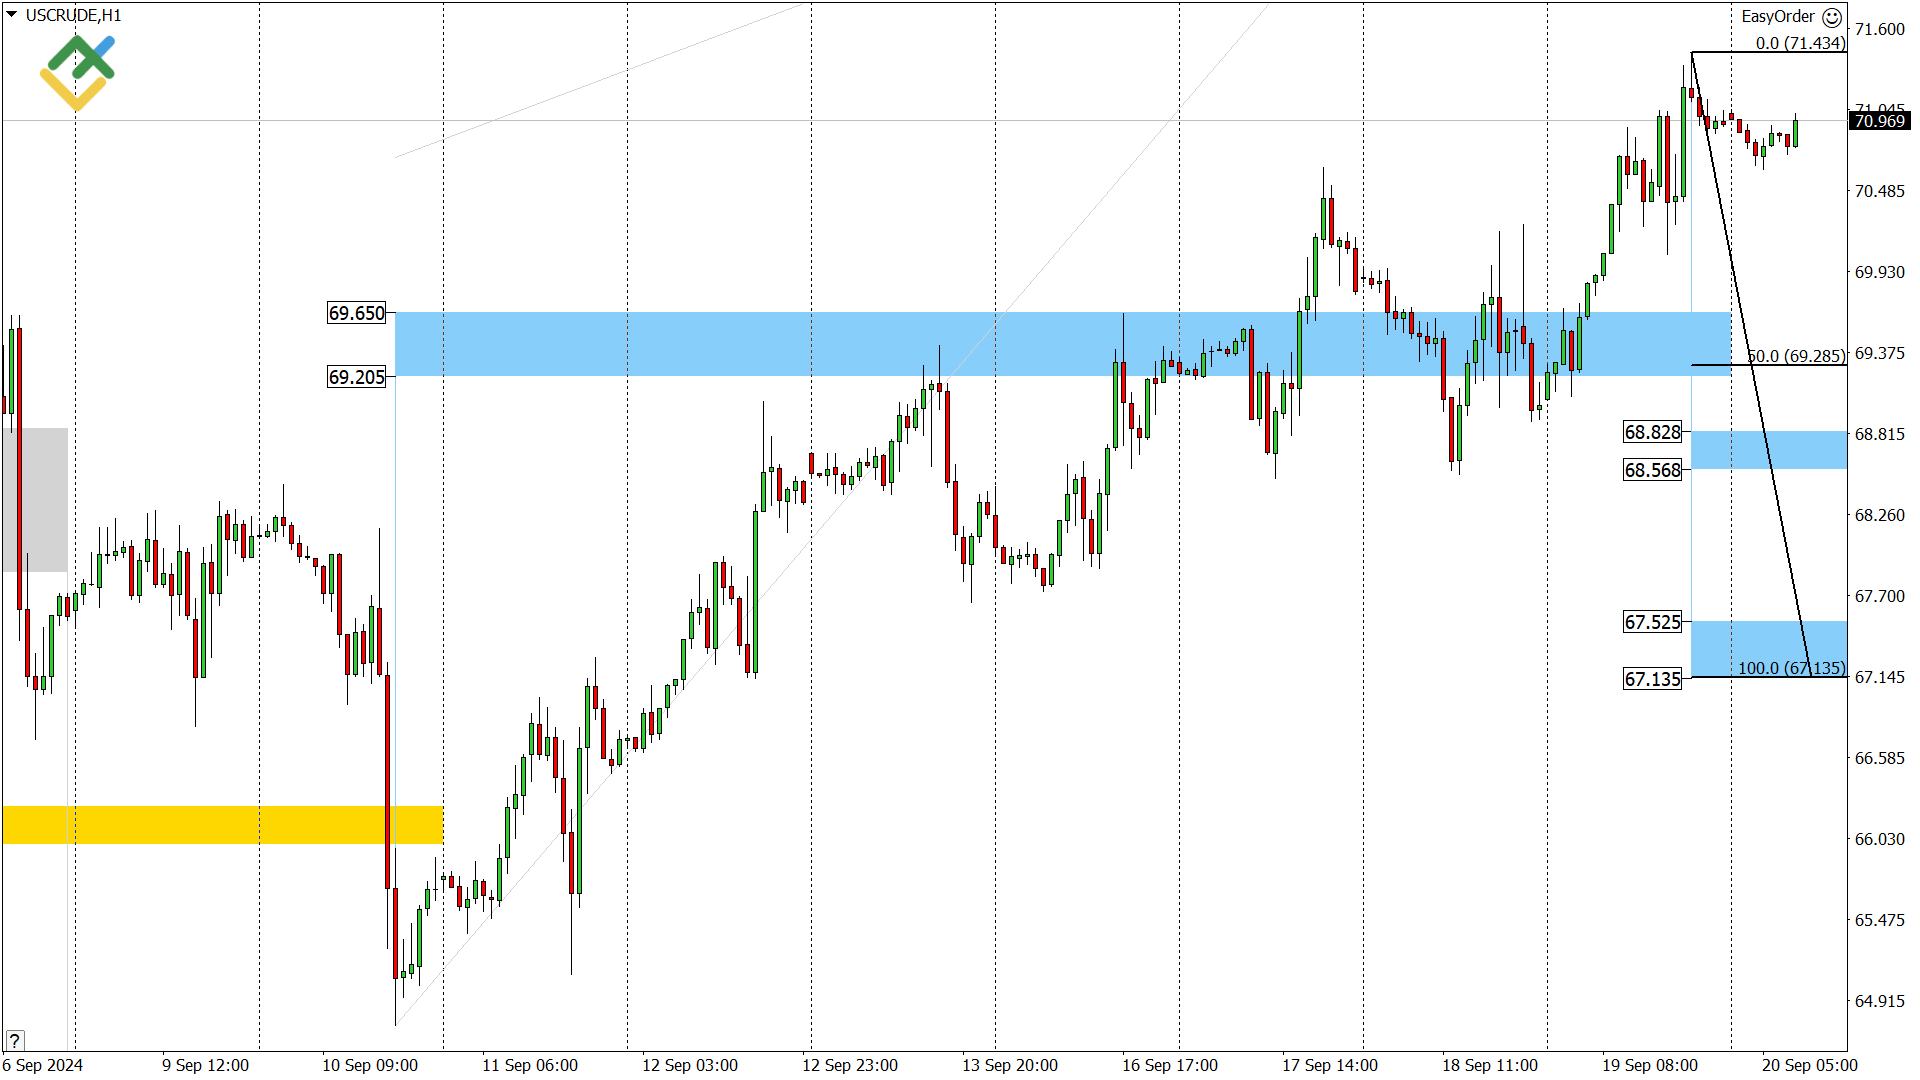
USCrude trading ideas for today:
-
Buy at support (A) 68.82 – 68.56. TakeProfit: 70.00, 71.43. StopLoss: 68.03.
-
Buy at support (B) 67.52 – 67.13. TakeProfit: 69.28, 71.43. StopLoss: 66.33.
Gold forecast for today: XAUUSD analysis
Gold continues to trade in a short-term uptrend. If the price consolidates above the September 18 high today, the Target Zone 2629 – 2619 will become the next bullish target. Once the Target Zone is tested, traders may close their high-volume long positions, leading to a downward correction.
If the correction starts at current prices, the quotes may fall to the support (A) 2547 – 2542 and support (B) 2521 – 2513. Once these areas are tested, consider long trades again.
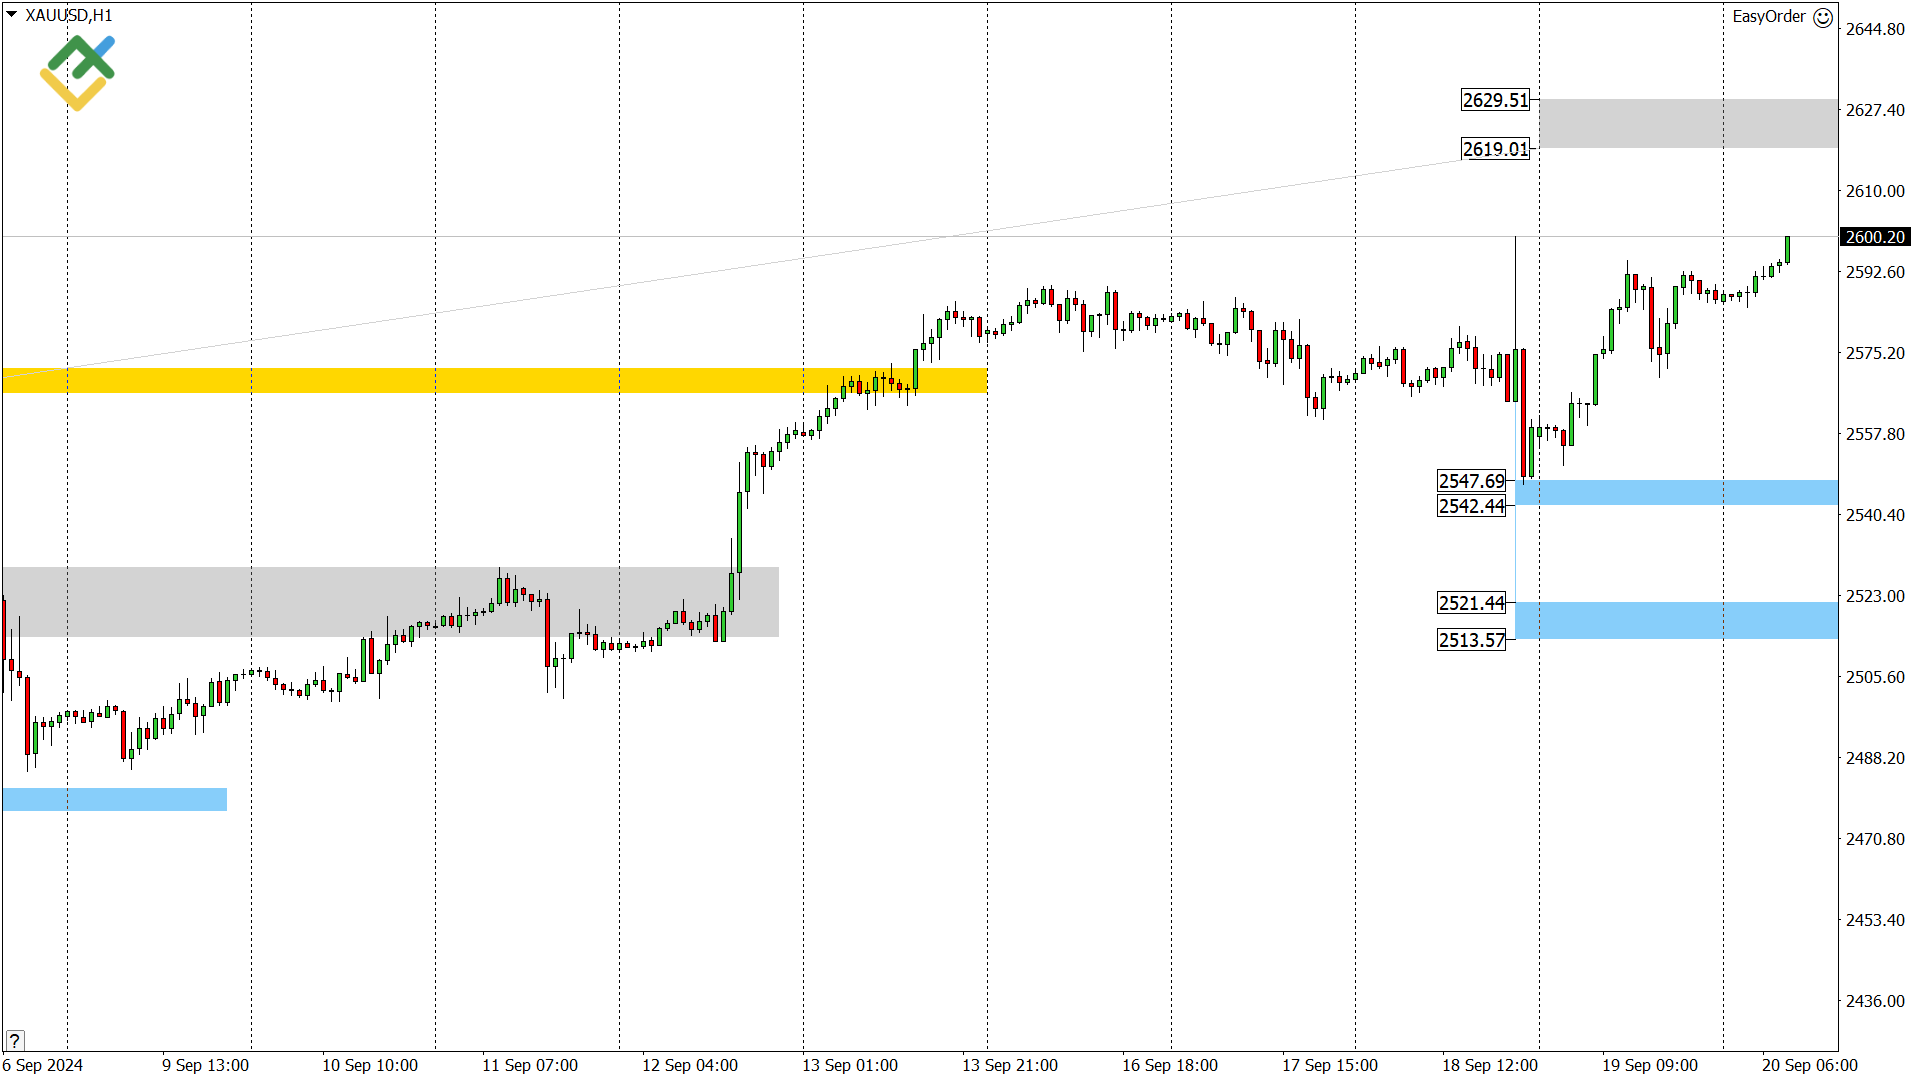
XAUUSD trading ideas for today:
Buy at support (B) 2521 – 2513. TakeProfit: 2556, 2600. StopLoss: 2497.
Euro/Dollar forecast for today: EURUSD analysis
The euro reversed its short-term downtrend yesterday. Now, the upper Target Zone 1.1279 – 1.1254 is the bullish target. Consider long trades on a correction at the strong support (A) 1.1105 – 1.1096 and support (B) 1.1063 – 1.1050.
If the price exceeds the September 18 high today, the support zones should be shifted. If the asset breaches the support (B) today, the short-term uptrend will reverse.
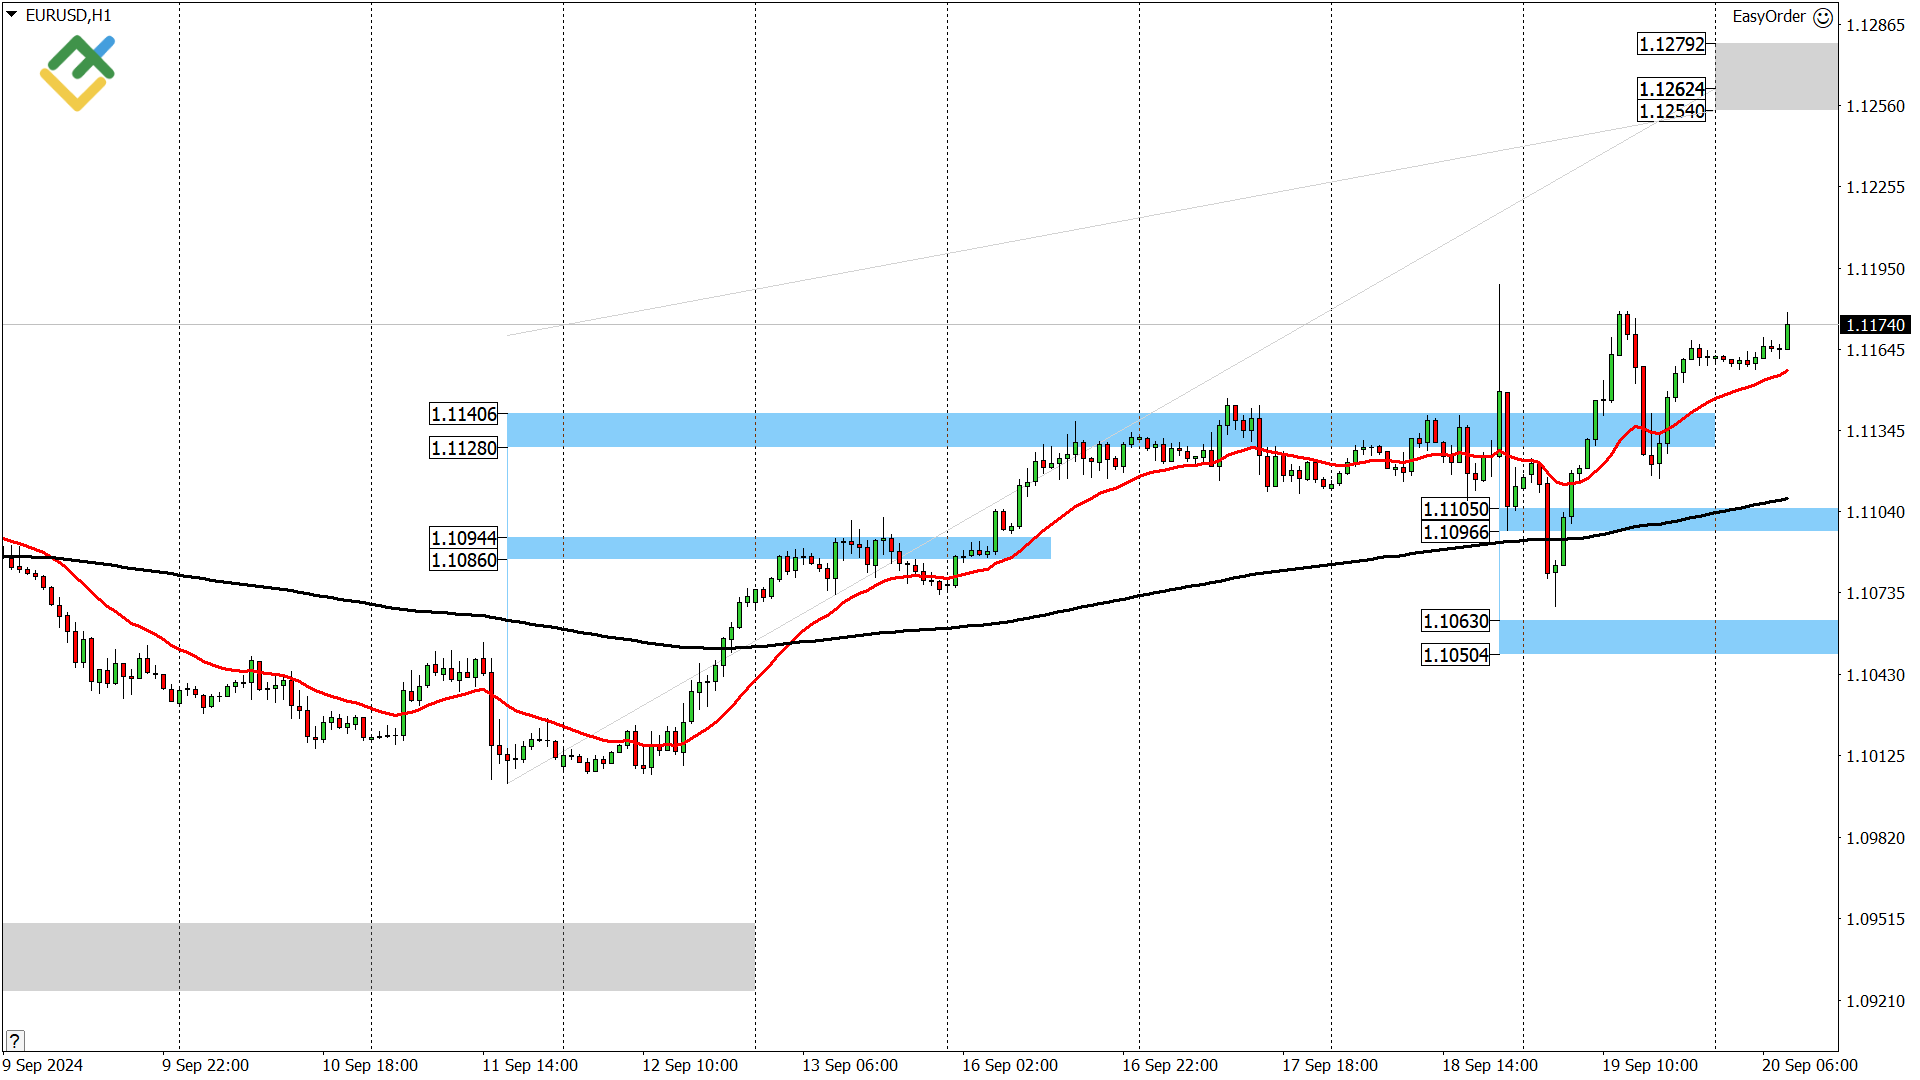
EURUSD trading ideas for today:
-
Buy at support (A) 1.1105 – 1.1096. TakeProfit: 1.1142, 1.1189. StopLoss: 1.1077.
-
Buy at support (B) 1.1063 – 1.1050. TakeProfit: 1.1119, 1.1189. StopLoss: 1.1021.
P.S. Did you like my article? Share it in social networks: it will be the best “thank you” 🙂
Ask me questions and comment below. I’ll be glad to answer your questions and give necessary explanations.
Useful links:
- I recommend trying to trade with a reliable broker here. The system allows you to trade by yourself or copy successful traders from all across the globe.
- Use my promo code BLOG for getting deposit bonus 50% on LiteFinance platform. Just enter this code in the appropriate field while depositing your trading account.
- Telegram chat for traders: https://t.me/litefinancebrokerchat. We are sharing the signals and trading experience.
- Telegram channel with high-quality analytics, Forex reviews, training articles, and other useful things for traders https://t.me/litefinance
Price chart of EURUSD in real time mode

The content of this article reflects the author’s opinion and does not necessarily reflect the official position of LiteFinance. The material published on this page is provided for informational purposes only and should not be considered as the provision of investment advice for the purposes of Directive 2004/39/EC.
{{value}} ( {{count}} {{title}} )
This post is originally published on LITEFINANCE.


