
Technical analysis encompasses various chart and candlestick patterns that reflect traders’ sentiment and behavior in financial markets. These chart patterns, in combination with technical indicators, help traders make more informed trading decisions.
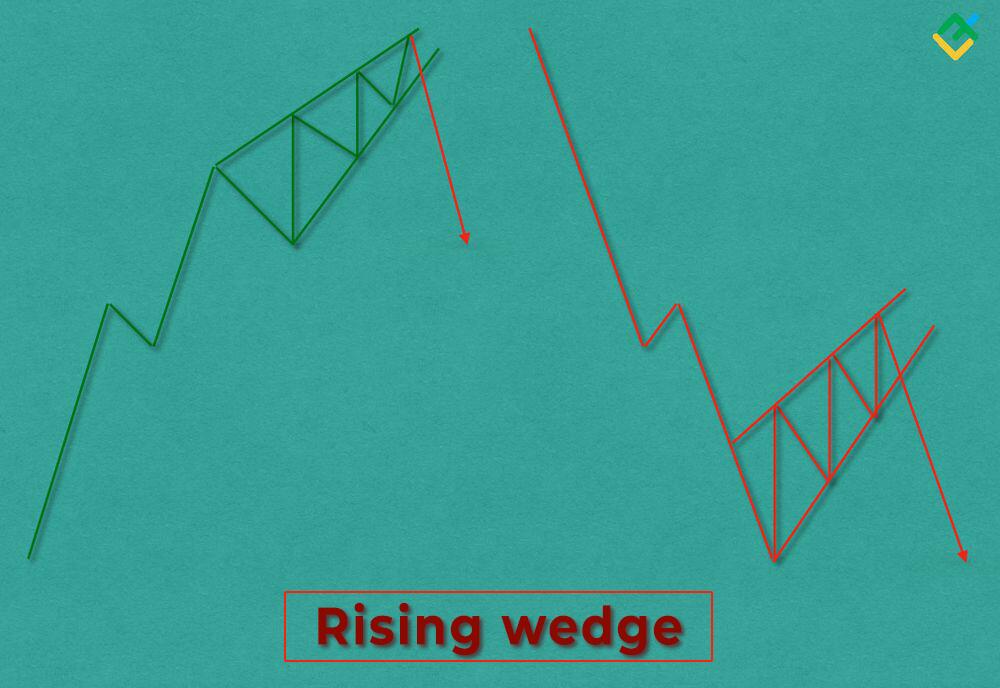
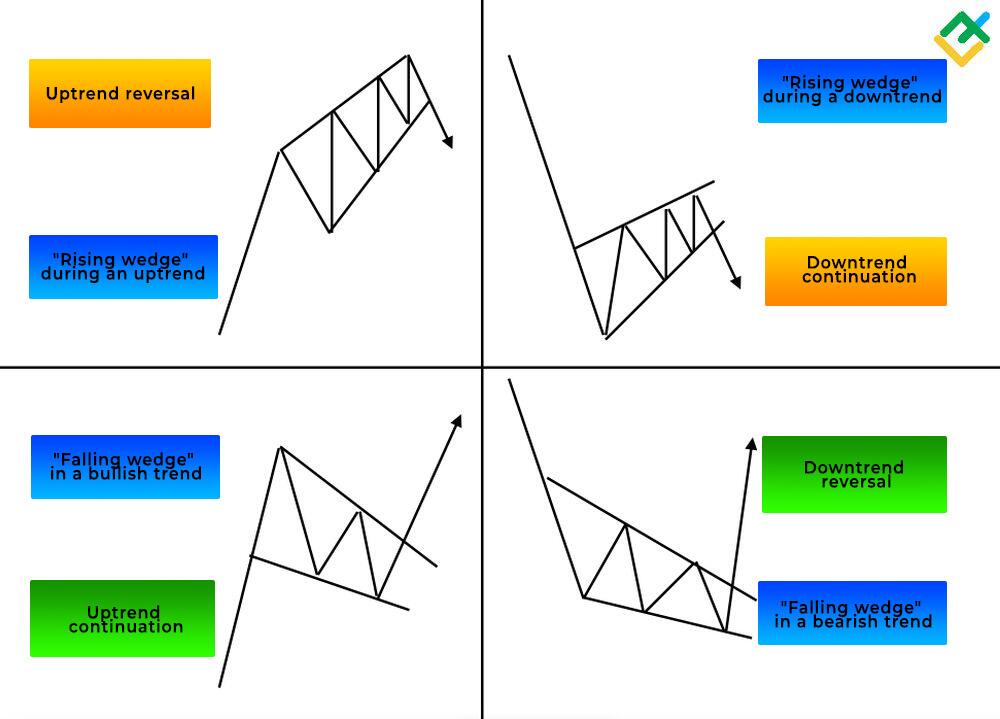
One of these price patterns is a “Rising wedge” bearish pattern, signaling a change from an uptrend to a downtrend or the continuation of a bearish trend.
This article discusses the effectiveness of the trading pattern and the likelihood of its appearance on a chart, signaling an upcoming reversal.
The article covers the following subjects:
Key Takeaways
|
Main Thesis |
Conclusions and Key Takeaways |
|
“Rising Wedge” chart pattern definition |
A “Rising wedge” is a technical analysis chart pattern, signaling the upcoming downward trend reversal. When this pattern forms within a bearish trend, it suggests increasing pressure from sellers and a further price decline. |
|
Pattern identification on a price chart |
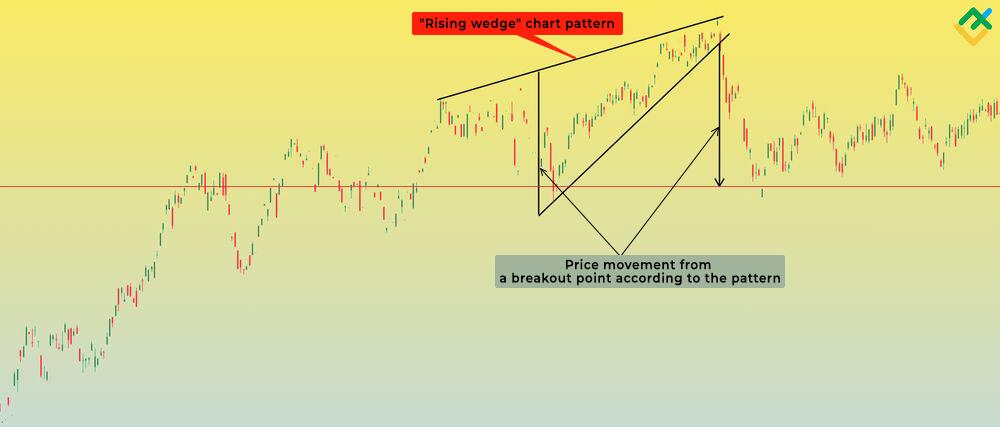
A “Rising wedge” pattern occurs on the chart when the price moves higher within a narrowing ascending channel, marked by higher highs and higher lows. The pattern formation is characterized by small trading volumes. However, once a “Wedge” pattern is complete, an impulsive breakout of the pattern’s lower line leads to an increase in trading volumes. |
|
“Rising wedge” pattern key features and distinguishing characteristics |
The “Rising wedge” pattern stands out from similar patterns due to its steeper slope of the support line compared to the diagonal resistance line. Additionally, this formation is a large price pattern of technical analysis. Thus, its construction can take several days and even months. |
|
What does the pattern indicate, and how does it affect the market |
The pattern suggests that bullish momentum is fading, signaling a potential downward trend reversal or a continuation of the downtrend. |
|
Why a “Rising wedge” pattern emerges on the chart |
A “Rising wedge” pattern shows that buyers struggle to influence the asset’s value but do not allow bears to reduce the quotes significantly. In fact, the power balance between bulls and bears is roughly equal during the pattern’s formation. Eventually, a large player enters the market and starts to lock in profits, increasing the trading volume considerably and leading to a potential reversal. |
|
“Rising wedge” pattern pros and cons |
The “Rising wedge” pattern offers clear trading rules and predefined take-profit and stop-loss levels, making it advantageous. This pattern is easily identifiable on the price chart, and determining the entry point is straightforward. The pattern may appear in almost all financial markets, including Forex, stocks, commodities, and cryptocurrencies. The pattern’s disadvantages include its complex structure. Some traders may confuse a “Rising wedge” with an “Ascending triangle.” This mistake can result in misinterpreting the future trend, as an “Ascending triangle” indicates an upward trend reversal or continuation of an uptrend. In rare cases, the price may move sharply upward after the formation of a “Rising wedge.” This usually happens against the backdrop of positive fundamental factors. |
|
How to trade a “Rising wedge” |
You need to identify the “Rising wedge” pattern on the chart and pinpoint the key support and resistance levels. Next, wait for the breakout of the pattern’s lower boundary. Once the signal is confirmed, short trades can be opened. A take-profit level is calculated based on the wedge’s height. A stop loss is set below the lower boundary of the pattern. |
|
Pattern trading strategies |
When trading a “Rising wedge”, swing trading or long-term trading strategies are best since this pattern typically forms on higher time frames. |
|
Time frames on which the pattern occurs |
A “Rising wedge” pattern can be determined on the H1 and higher time frames. On lower time frames, the pattern may give false signals. Besides, it is often difficult to correctly identify the pattern on such charts. |
What is a Rising Wedge?
A “Rising wedge” pattern is commonly known as a bearish technical analysis chart pattern that forms at the highs during an uptrend or in the middle of a downtrend and signals a bearish price reversal.
Experienced traders can quickly spot the pattern on the chart. It is a narrowing price formation in an ascending channel, characterized by higher lows and higher highs.
Notably, the diagonal support line in the pattern is steeper compared to the resistance line. This signals the gradual exhaustion of bulls and the growing pressure on the price from the sellers.
The narrowing of the wedge at the peak implies further breaching of the diagonal support line, indicating a bearish trend reversal. Once the price breaks through the pattern from above, short trades can be opened.
After a breakout to the downside, the price may reverse to test the support level. A rebound from the support line usually confirms the presence of a “Rising wedge” pattern.
However, a support breakout usually occurs impulsively without confirmation when trading volumes are high. Therefore, it is advisable to look for an entry into a short trade on lower time frames to avoid missing on a position.
What Do Rising Wedges Look Like?
A “Rising wedge” pattern is a large price formation appearing on higher time frames.
The pattern formation at the end of an uptrend or in the middle of a downtrend follows this sequence:
-
The price steadily increases within the converging diagonal lines of support and resistance while the volumes are low. The lower trend line has a steeper slope.
-
Over time, support and resistance levels converge, creating a wedge shape.
-
As the pattern develops, the price lows and highs increase. The trading range between these points gradually shrinks.
-
Trading volumes usually decrease during a “Rising wedge” formation and rise when the pattern is pierced.
-
The price breaks through the trend line from above at the peak of the pattern, signaling a price reversal and creating selling opportunities.
A “Rising wedge” pattern reveals the growing tension in the market and suggests a potential trend reversal.
What Causes Rising Wedges?
A “Rising wedge” pattern reflects the supply and demand changes in the market and is influenced by the following factors:
-
Supply growth. When the pattern forms, sellers become active in the market. Bulls lock in the profit on long trades and open short trades, leading to a rapid increase in supply. Although buyers still dominate the market, a “Rising wedge” indicates a gradual waning of their strength.
-
As the pattern forms, the demand for the asset gradually decreases, leading to a slowdown in price growth despite aggressive purchases.
-
Historical and swing resistance levels. As a rule, a “Rising wedge” pattern develops at historical or swing highs, where a lot of short trades were previously initiated.
-
Fundamental and psychological factors. When detecting a “Rising wedge” pattern on the price chart, it is important to study the fundamental factors affecting the asset’s value. Sometimes, after the pattern formation, the price starts to grow instead of falling, driven by positive news. Additionally, the more market participants identify the pattern on the chart, the stronger the downward movement will be.
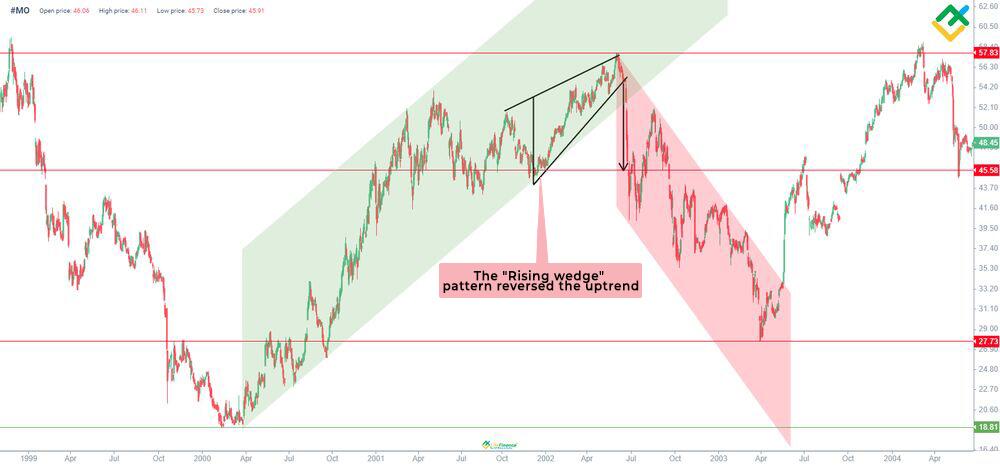
Review an example of a “Rising wedge” pattern’s influence on the trend change on the Altria Group Inc. chart below.
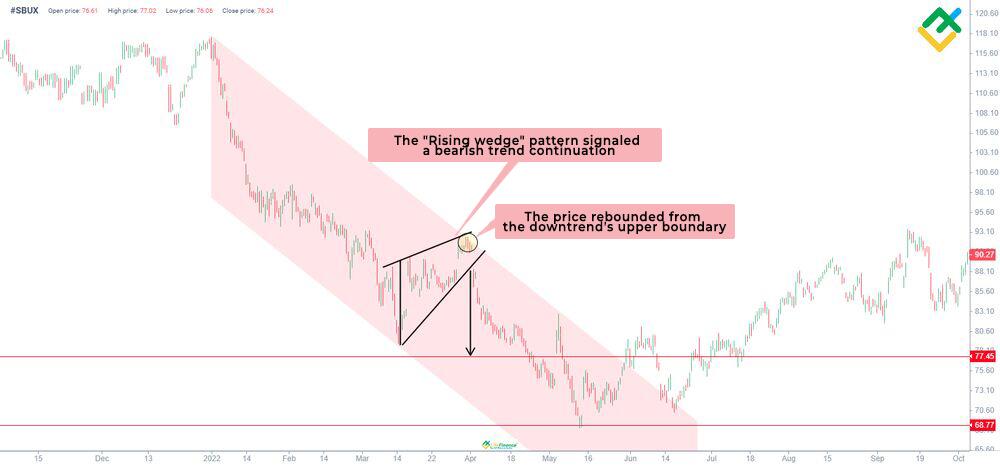
During a downtrend, the rising wedge pattern often indicates a continuation of the trend. An illustration of this pattern is demonstrated below on the 4-hour chart of Starbucks Corporation shares.
What Rising Wedges Indicates?
Although a “Rising wedge” may seem straightforward and similar to other patterns, it suggests significant shifts in the market situation:
-
Trend reversal. The diagonal support line breakout within the pattern signals that bears have taken control, and the quotes have reversed downward.
-
Loss of bullish momentum. Despite the sharp growth of lows, bullish movement in the narrowing price range points to the fading of buyers’ strength.
-
Change of market sentiment. As a “Rising wedge” pattern matures, the market sentiment becomes more cautious.
-
Price movement in a narrow ascending channel. Two converging trend lines demonstrate the consolidation of the security’s price and signal the imminent impulse during the pattern’s breakout.
-
Decrease in trading volume. Declining trading volume during the “Rising wedge” pattern formation indicates the weakening of bullish momentum in the market. When the price pierces the wedge from above, rising market volume confirms sellers’ strength and indicates a potential downward reversal or strengthening of bearish momentum.
-
Pattern formation at historical highs. Typically, a “Rising wedge” emerges at historical resistance levels, indicating that the price struggles to keep rising.
As a result, a “Rising wedge” pattern warns market participants about the impending shift from an uptrend to a downtrend, creating selling opportunities.
How To Identify Rising Wedges Pattern
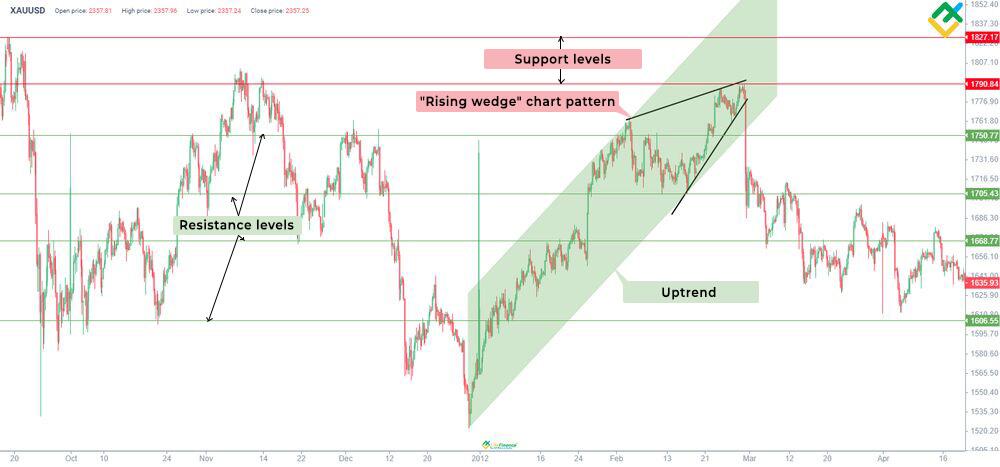
Let’s analyze the construction of a “Rising wedge” pattern on the 4-hour XAUUSD chart step by step:
-
Firstly, you should pinpoint key support and resistance levels to understand where a pattern may occur.
-
Next, identify a pattern visually on the chart near the resistance line. The pattern is characterized by sharp price fluctuations in a narrowing ascending channel with higher highs and higher lows.
-
At the same time, the ascending structure of this pattern features a steeper support line and a less sharply sloped resistance line. The price is moving in a narrowing trading range, forming a wedge.
-
The market volume is also essential. As the pattern evolves, volume should be low, reflecting the inability of bulls to push the price higher.
-
In order to make sure that the wedge is ascending, you should wait until the price breaks through the pattern amid increased volume.
A “Rising wedge” pattern has emerged on the gold chart during a bullish trend. Once it was completed, the price began to decline rapidly. Essentially, the pattern has warned traders in advance about the upcoming trend change and gave signals to open short positions.
How To Trade Rising Wedge
To trade a “Rising wedge” pattern effectively, you should study the rules of entering and exiting the market according to this pattern. The pattern provides early signals of a trend reversal or continuation of a downward movement. Thus, it is important to wait for a pattern’s lower boundary breakout and confirm it before making trading decisions.
Let’s analyze two examples of trading a “Rising wedge” pattern below.
Trading a “Rising wedge” in a bullish trend
Trading a “Rising wedge” pattern in a bullish trend involves opening short positions once the pattern is formed at the high, at the end of the uptrend. Let’s analyze this strategy in more detail using the EURUSD currency pair hourly chart.
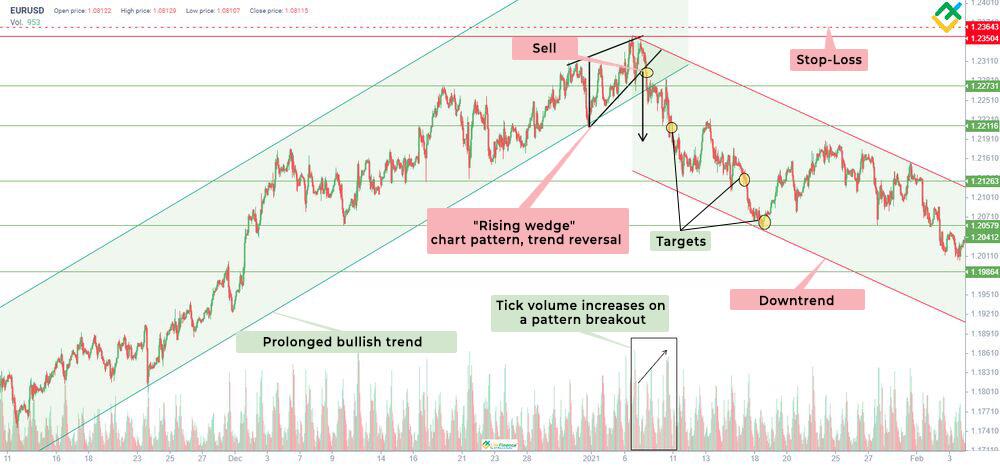
The chart shows a prolonged upward movement of the EURUSD price. Afterward, a “Rising wedge” occurs in the 1.2273–1.2350 range.
The breaching of the pattern’s lower boundary, accompanied by higher volumes after the bulls’ unsuccessful attempt to pierce the historical resistance of 1.2350, became a signal to open short trades.
Besides, the chart shows an impulse breakout of the uptrend’s lower boundary. The price tested the lower boundary again after the breaching, serving as the final confirmation of the uptrend’s reversal.
In this scenario, a stop-loss order should be placed above the “Rising wedge” pattern and the key resistance of 1.2350. The nearest profit target is 1.2211. You can also secure profits partially by placing the order at 1.2126 and 1.2057, thereby maximizing the potential profit.
Trading a “Rising wedge” in a bearish trend
Trading a “Rising wedge” in a downtrend involves opening short positions once the pattern evolves. Let’s analyze this strategy using the 4-hour ETHUSD chart.
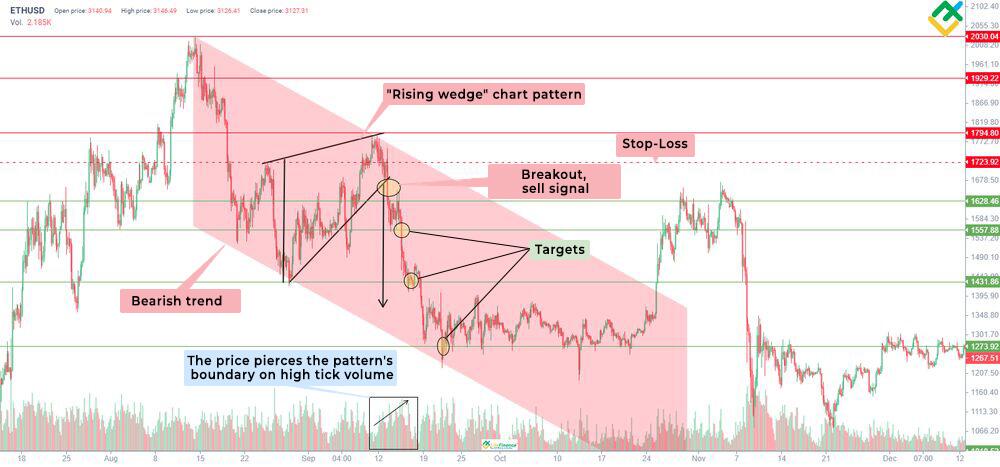
The chart shows the formation of a “Rising wedge” in a wide price range within the downtrend. A temporary upward correction, in the shape of a wedge, has warned market participants about the continuation of the bearish trend.
The pattern’s lower boundary breakout, accompanied by higher trading volumes, serves as a signal to initiate short trades.
In this case, a stop-loss order should be placed above the pattern’s lower line at the 1723.92 level.
The price potential decline trajectory after the breakout equals the distance between the lower and upper boundary at the beginning of the pattern formation, as shown on the chart above. Therefore, the target levels are 1628.46, 1557.88, and 1431.86. Once these marks are reached, one may close most of the trades, keeping about a 5%–10% margin of the total trades. This is necessary to maximize profit if the price continues to drop to historical support levels, where a trend reversal could potentially occur.
Rising Wedge Pattern Confirmation
Like all other technical analysis patterns and indicators, a “Rising wedge” pattern requires confirmation.
The goal of a trader or investor in the market is to generate profits. Therefore, the presence of multiple confirming signals in the market indicates greater profit potential and reduced risks.
-
The most important confirmation of the pattern is the pattern’s lower boundary breakout.
-
A noticeable surge in trading volumes occurring when the price breaks through the pattern serves as an even more substantial validation of a “Rising wedge” pattern, suggesting a shift in sentiment and overall market movement.
-
Another way to confirm the pattern entails analyzing technical indicators and interpreting candlestick patterns to receive signals.
Let’s study a “Rising wedge” pattern confirmation example on the 4-hour Dow Jones Index chart.
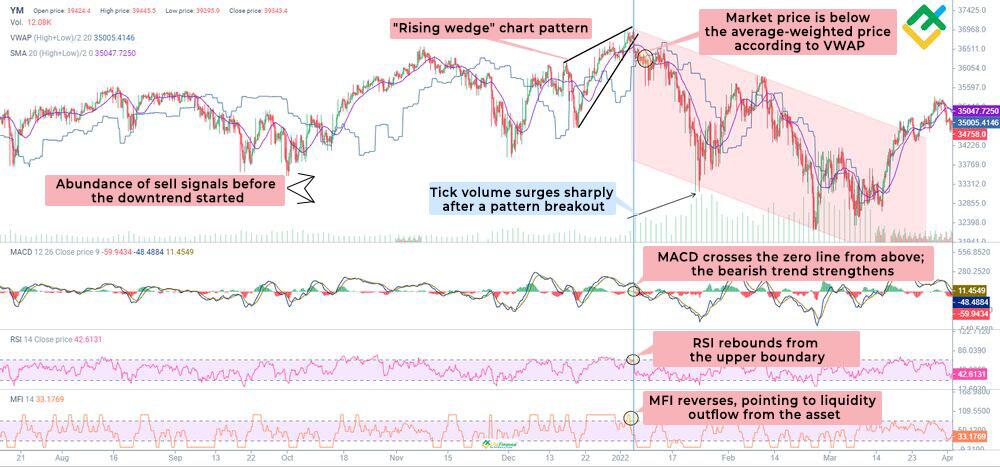
Before the start of a short-term bearish trend in the YM index, a “Rising wedge” pattern developed. Prior to the pattern’s lower boundary breakout, the price was in the overbought zone, according to the RSI, for a long time. Then, the indicator’s values turned sharply downwards.
Meanwhile, the MACD indicator has crossed the zero boundary and declined in the negative zone. Besides, the MFI shows an outflow of liquidity from the asset, accompanied by an increase in tick volume. These signs indicate the beginning of active selling.
Another signal is that the index market price has fallen below the VWAP point and the SMA20 level, indicating the strength of bearish momentum.
Therefore, five confirmation signals of a “Rising wedge” pattern provide the grounds for opening short trades.
What Are The Advantages and Disadvantages of The Rising Wedge?
There is no perfect pattern in technical analysis since each has its own pros and cons.
|
Pros |
Cons |
|
1. Experienced traders can easily identify a “Rising wedge” pattern on a price chart. |
1. Novice traders may confuse the pattern with a “Triangle” or a “Pennant” due to the peculiarities of the pattern. |
|
2. The pattern may occur in various financial markets. |
2. This pattern is not visible on all time frames. Most often, it emerges on H1 and higher time frames. The pattern’s signals are more distinct on older time frames. |
|
3. This chart pattern has its own trading rules, making it simpler to trade. |
3. The pattern is confirmed by technical indicators or candlestick patterns. |
|
4. The pattern offers a more favorable risk/reward ratio, enabling traders to reduce risk and increase potential profit. |
4. A “Rising wedge” pattern can provoke false breakouts, increasing risks and potentially leading to unforeseen losses. |
Conclusion
A “Rising wedge” pattern helps traders determine the current price movement and evaluate the balance of power between bulls and bears amid constantly changing markets.
“Rising wedge” patterns indicate an imminent change from an uptrend to a downtrend and may indicate a continuation of the downtrend.
Furthermore, this pattern is relatively easy to trade, and the signals it generates are highly reliable. However, it is crucial to bolster the confirmation of a “Rising wedge” by utilizing technical indicators and candlestick patterns.
The best way to learn how to identify and use a “Rising wedge” pattern is to sign up for a free LiteFinance demo account. A multifunctional web terminal with an array of trading tools will allow you to improve your trading skills before live trading.
Rising Wedge Pattern FAQ
Once a “Rising wedge” pattern develops in a bullish trend, an uptrend reverses to a downtrend. If the pattern occurs in the middle of a bearish trend, it signifies a continuation of the downtrend.
No, a “Rising wedge” is a bearish technical analysis pattern. The opposite of this pattern is a “Falling wedge,” indicating a bullish price reversal.
In most cases, a “Rising wedge” pattern provides a strong signal for a price reversal. When it forms at the peak, it indicates that the trend is about to change. Sometimes, false breakouts may occur. Besides, the pattern can be confused with a “Triangle” or a “Pennant” pattern. Therefore, you should get additional confirmations of a “Rising wedge.”
Short trades should be opened after the pattern’s lower boundary breakout. Moreover, you should monitor the trading volumes, which are expected to increase during the breakout.
The duration of the “Rising wedge” formation depends on the observed time frame. It may take several weeks, months, or even years for the pattern to fully develop.
The opposite of a “Rising wedge” is a “Falling wedge” pattern, which warns market participants of a trend reversal at the support line or a continuation of upward momentum in a bullish trend.
The pattern tends to be highly accurate, especially when it appears at the end of an uptrend on H4 and higher time frames. In addition, the pattern’s reliability depends on the market conditions and requires additional confirmation by technical indicators and candlestick patterns.
There are “Rising wedge,” “Falling wedge,” and “Expanding wedge” patterns used in technical analysis.
A “Rising wedge” pattern foreshadows a trend reversal at the peak. The pattern usually forms in a narrowing ascending channel. After that, the price breaks through the pattern’s lower line with increased volumes and starts to fall rapidly. The nearest target within the pattern is the swing support level. The price usually breaches this level and continues to drop.
These are two opposite patterns. A “Rising wedge” warns market participants about a bearish reversal, while a “Falling wedge,” on the contrary, signals a change to an upward trend.
The pattern suggests that sustained growth continues in the market. However, as the price approaches a strong resistance level, it loses momentum. The lows grow sharply, while the new highs increase more gradually. The price reaches the resistance and starts to decline. The pattern shows a weakening of the bulls’ strength, allowing bears to take control over the price action.
A “Rising wedge” is an unfavorable sign for companies and long-term investors, as it indicates that the value of their shares will likely drop. As for traders, it makes no difference, as they can profit from both rising or falling stock prices.
A “Rising wedge” pattern can be confirmed by its lower boundary breakout during high trading volumes. Furthermore, additional confirmations can be obtained using trend, stochastic, and volume indicators. For even stronger signals, consider incorporating reversal candlestick patterns.
These are absolutely different patterns. The “Rising wedge” pattern develops within a narrowing ascending channel with boundaries that do not intersect. A “Triangle” pattern can also be of several types and forms in a narrowing channel. Nevertheless, its boundaries eventually cross, leading to a breakout.
A “Rising wedge” is a bearish reversal pattern emerging at the peak or a bearish trend continuation pattern. A “Bull flag” pattern is a bullish continuation pattern. A “Bull flag” involves a downward correction, retracing 30%–50% of the flagpole size. Afterward, the price breaks through the flag and grows by a distance equal to the height of the flagpole.

The content of this article reflects the author’s opinion and does not necessarily reflect the official position of LiteFinance. The material published on this page is provided for informational purposes only and should not be considered as the provision of investment advice for the purposes of Directive 2004/39/EC.
{{value}} ( {{count}} {{title}} )
This post is originally published on LITEFINANCE.


