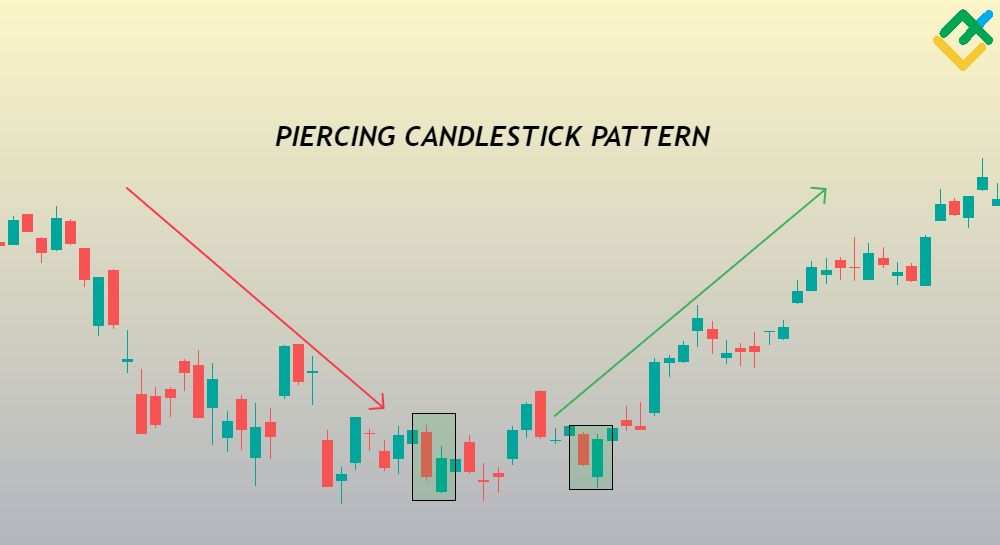
A “Piercing” pattern received its name due to the principle of its construction on the price chart. This Japanese candlestick pattern belongs to reversal patterns and significantly influences an asset’s price movement.
Why is the candlestick pattern rarely found on the chart? What are the peculiarities of the construction of this pattern?
You have probably seen this pattern on the chart but did not devote much attention to it because it is similar to others.
The “Piercing” pattern has some similarities with such candlestick patterns as “Bullish engulfing,” “Bullish counterattack,” and “Bullish belt hold.” However, major differences set the “Piercing” pattern apart from its counterparts.
This article explains these differences and dives into important trading signals the pattern carries.
The article covers the following subjects:
Key Takeaways
|
Key point |
Description |
|
What is a “Piercing” pattern? |
A “Piercing” pattern is a two-day reversal candlestick pattern consisting of the first bearish candlestick and the following bullish candlestick. The first candlestick opens with a significant gap down, and the second candlestick should overlap the first one by at least half by the end of the period. |
|
How to identify a “Piercing” pattern on the chart? |
The pattern is formed at the bottom of a prolonged downward trend. It is quite easy to recognize the “Piercing” pattern, as it is formed in the area of strong support levels. On the chart, if two opposite candlesticks appear, the second of which is bullish and opens with a large gap down, but by the end of the period closes above the opening level and covers the first candlestick halfway, this is the piercing pattern. |
|
How significantly does a “Piercing” pattern affect the market? |
A “Piercing” pattern is a powerful and rare price chart formation. It signals that the market failed to stick to new lows, and bulls started to act actively. The candlestick pattern urges bears to close their trades in anticipation of the downtrend changing to an uptrend. |
|
The “Piercing” pattern features |
Due to the fact that the gap formed after the first candlestick acts as a strong resistance for buyers, the pattern belongs to the reversal patterns of candlestick analysis. The second candlestick covers the gap and half of the bearish candlestick. That is, market sentiment changes sharply to bullish. Sometimes, a bullish candlestick can overlap the body of the first candlestick even more, but not completely. The greater the gap and the smaller the shadow of the second candlestick, the stronger the signal for upward momentum is. |
|
Why does a piercing “Piercing” appear on a chart? |
Like many other reversal patterns, the “Piercing” pattern warns market participants about the end of the downtrend, pointing to the waning strength of bears in the market. The reasons for its formation can be any fundamental factors directly affecting the traded financial instrument. Examples include financial reports on the traded instrument, such as company shares, strong statistical data, economic or political factors, etc. |
|
How to trade a “Piercing” pattern? |
To use the pattern in your trading, you should first identify it on the price chart. Then, it is especially important to determine the support and resistance levels. If you are risk-tolerant, you can open a long trade after the pattern is formed, placing a stop-loss order below the support level. A take-profit order can be set at the nearest resistance level. If a more conservative trading strategy is used, it is better to get additional confirmations after the pattern appears using other candlestick patterns or technical indicators. Once the pattern is fully confirmed, long trades can be opened. |
|
Trading strategies that include the “Piercing” pattern |
The “Piercing” pattern perfectly fits many trading strategies. It can be used in scalping, day trading, and medium—and long-term trading. |
|
Pattern’s pros and cons |
The “Piercing” pattern is easy to identify on the chart. In addition, this pattern has clear rules for use in trading. This allows traders and investors to identify more favorable entry points early in a bullish reversal, reducing risk and increasing the potential profitability of the trade. One of the main disadvantages of this pattern is its rarity. Like many other candlestick patterns, the “Piercing” pattern needs to be confirmed by other reversal patterns. The more reversal patterns that are formed along with the “Piercing” pattern near the support level, the more likely and obvious a bullish trend reversal becomes. |
|
What time frames can the Japanese candlestick pattern be found on? |
The “Piercing” pattern can be found on all time frames. It can be formed on a three-minute chart and on a monthly or three-month chart. However, it most often appears on the daily chart. |
|
How to set stop-loss orders when trading a “Piercing” pattern |
According to the pattern trading rules, stop-loss orders should be placed below the lows of the first and second candlesticks when opening a long trade. It is safer to place a stop-loss order below the support level on which the pattern is formed. It is also important to consider the time frame and value of the asset’s move. |
What Is The Piercing Candlestick Pattern
The “Piercing” candlestick pattern is a Japanese candlestick analysis pattern that forms at the end of a downtrend and signals an upward trend reversal.
The pattern is formed with two candlesticks:
-
First, a bearish candlestick shows that bears control the market;
-
The following candlestick opens below the previous close, forming a gap, thus showing that the bearish trend in the market continues. However, bulls become more active in the market once the second candlestick forms, pushing the quotes to at least the middle of the first candlestick’s body.
This pattern resembles a “Bullish engulfing” candlestick pattern. However, when it comes to engulfing, the second bullish candlestick completely engulfs the first bearish candlestick’s body, closing above it.
Notably, the larger the gap between the first and second candlesticks and the more the bullish candlestick overlaps the bearish one, the more likely a potential upward reversal of the trading instrument becomes.
How The Piercing Pattern Works
The “Piercing” pattern is a bullish candlestick analysis pattern. It signals traders about the increasing demand for a trading instrument.
After a sustained decline in the asset’s value or a prolonged accumulation phase, the pattern forms at the key support levels.
The first bearish candlestick’s body and the gap following it show that the asset is under the full control of sellers. However, the second Japanese candlestick shows a sharp change of sentiment in the market caused by the factors affecting the asset.
When building this pattern, bears should close their short trades or at least reduce their traded volume, as buyers dominate the market.
Nevertheless, the pattern can rarely give false signals. For example, a long bearish candlestick is formed after a bullish candlestick and closes below the previous candlestick’s low. This situation indicates that the reversal signal is false and the downtrend is expected to continue.
The frequency of false reversal signals also depends on the selected time frame. The lower the time frame, the more false signals it generates. On the contrary, the higher the time frame, the stronger and more accurate signals it gives, as higher time frames filter market noise.
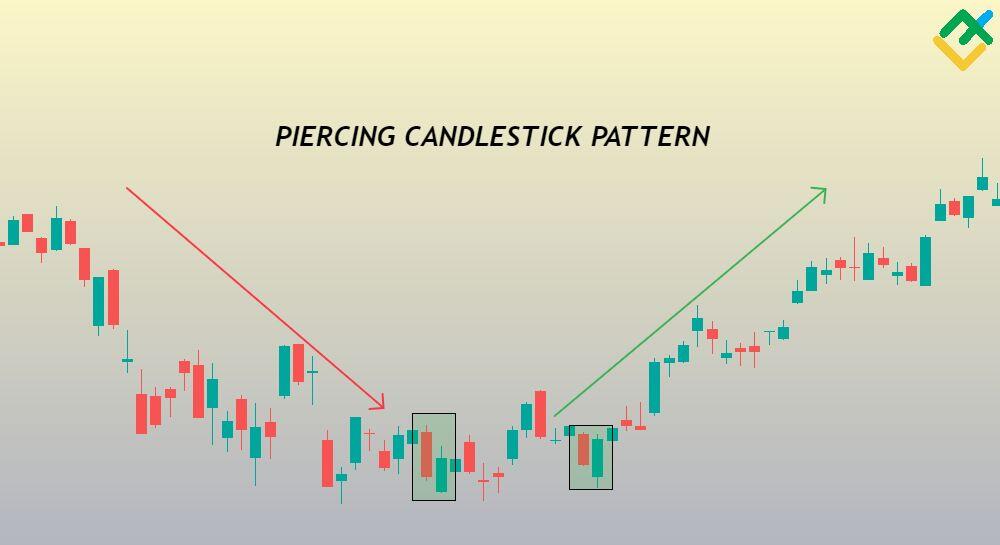
How to Identify a Piercing Pattern
The “Piercing” pattern is relatively easy to spot on the chart as its structure is noticeable at a glance.
The candlestick pattern should meet the following criteria:
-
The pattern is formed at the downtrend’s bottom. First, it is necessary to determine the instrument’s current trend and look for a pattern at its lower boundary.
-
The first candlestick of the pattern should be bearish, demonstrating the strength of sellers in the market. The candlestick shadows can be either present or absent.
-
The second candlestick should open with a gap below the closing price of the previous candlestick. By the end of the period, the second candlestick should overlap the first candlestick at least by half, but not completely. Candlestick shadows can also be formed, but they should be small.
Factors that strengthen the “Piercing” bullish pattern:
-
The more a bullish candlestick overlaps a bearish candlestick, particularly by more than half, the more likely it is that a bottom is forming on the asset.
-
A buy signal is more pronounced if the “Piercing” pattern forms at the downtrend’s end. At the same time, if both candlesticks have no shadows, it strengthens the trend reversal signal. That is, the opening price of the bearish candlestick is at the high, and the closing price is at the low. The opening price of the second candlestick is equal to the low, and the closing price is located at the high for the current period.
-
The reversal signal is also strengthened if the second candlestick opens below and closes above the key support level. This indicates that bears have lost control over the market.
-
An increase in trading volume on the second candlestick also strengthens the pattern and signals that the bearish trend has ended. The sharp increase in volumes is caused by bears closing their positions.
Piercing Pattern Example
The “Piercing” pattern often appears on the charts of stocks, commodities, and indexes.
The candlestick pattern can rarely be found in the currency market.
Let’s analyze some examples of this pattern in this section.
1. Japan’s Nikkei 225 index, M30 chart.
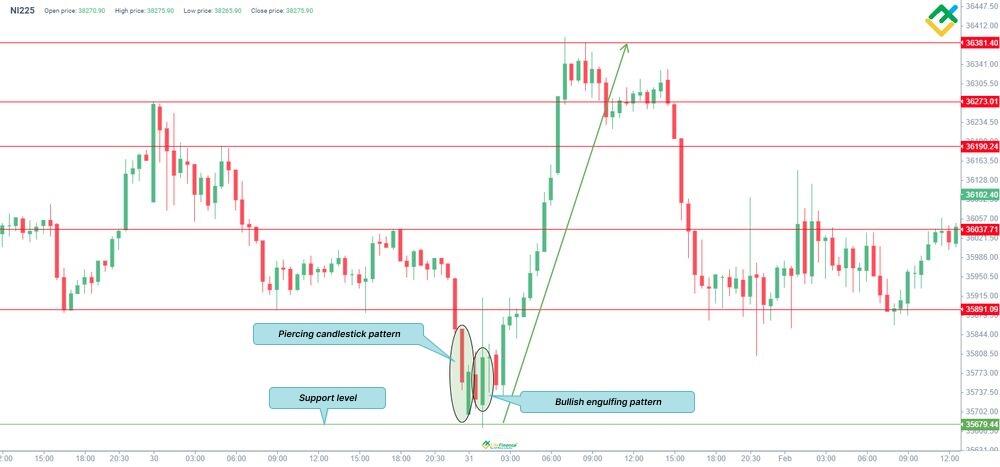
The above chart shows the “Piercing” pattern. Despite the fact that the second candlestick of the pattern has not covered half of the first candlestick, the pattern can be considered complete due to the second candlestick’s tall body and the price settling above the closing price of the previous candlestick. This pattern can also be regarded as an independent “Thrusting line” candlestick pattern when the price of the second candlestick closes slightly above the closing price of the previous bearish candlestick.
In addition, this formation can also be called a “Bullish counterattack” pattern because the body of the second candlestick does not have a lower shadow.
The “Bullish engulfing” pattern that formed next confirmed the market’s bullish sentiment, after which the price began to rise sharply.
2. COFFEE, H1 chart.
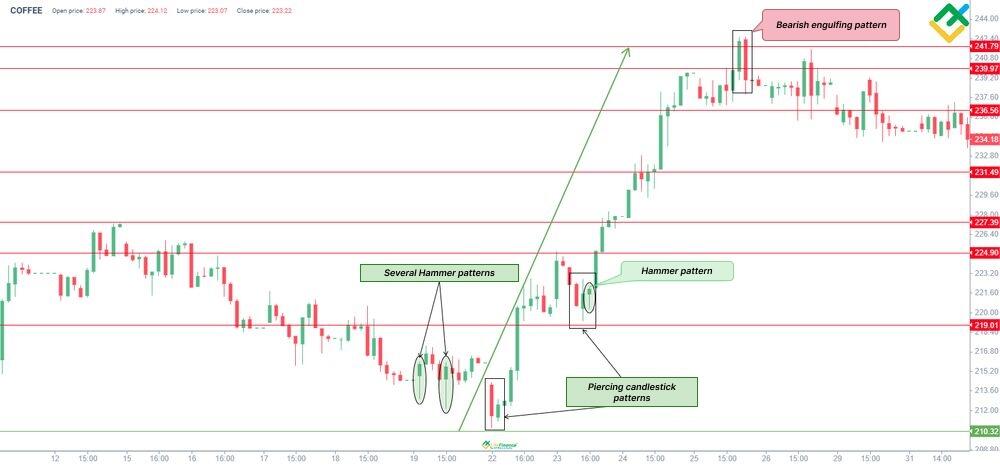
Above is an example of a “Piercing” pattern on the coffee price chart. Before reaching the downtrend’s bottom and forming the “Piercing” pattern, a series of “Hammer” reversal candlestick patterns emerged on the chart, pointing to an upward price reversal.
The “Piercing” pattern marked the low at $210.32, after which the price turned upward and crossed the key level of $219.01 with an impulse candlestick. At this level, another “Piercing” pattern and a “Hammer” pattern appeared, triggering a rally to $241.79.
The “Bearish engulfing” reversal pattern reversed the short-term bullish trend, after which the price of coffee began to decline.
3. Airbus Group, H4 chart.
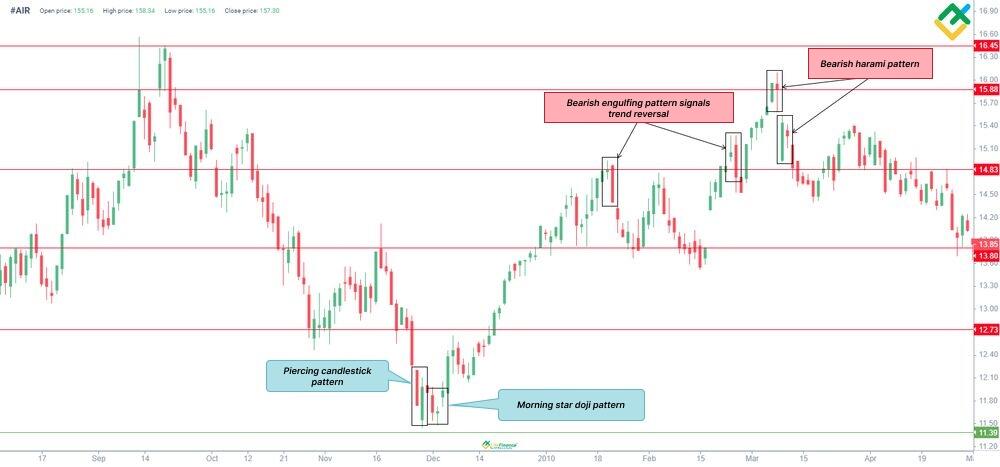
A classic example of the “Piercing” pattern formation can be observed on the chart of Airbus, Europe’s largest aerospace company.
After the pattern was formed, another “Morning star doji” reversal pattern emerged, giving a strong signal for a trend reversal.
The price soared from $11.39 to the resistance level of $14.83, regaining the lost ground. At this key level, the stock formed two “Bearish engulfing” reversal patterns, but the price increased to $15.88. Near this level, bullish momentum began to fade, confirmed by a series of “Bearish harami” patterns, after which the price reversed and began to fall.
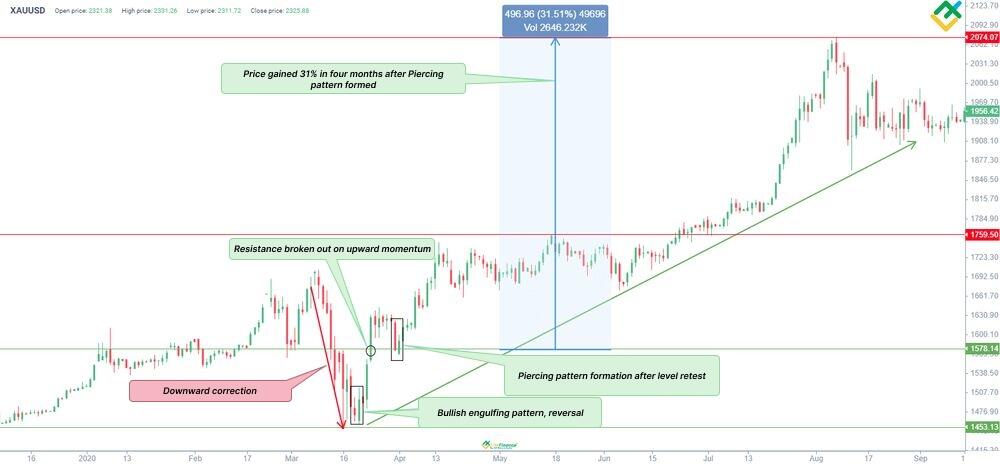
4. XAGUSD, D1 chart.
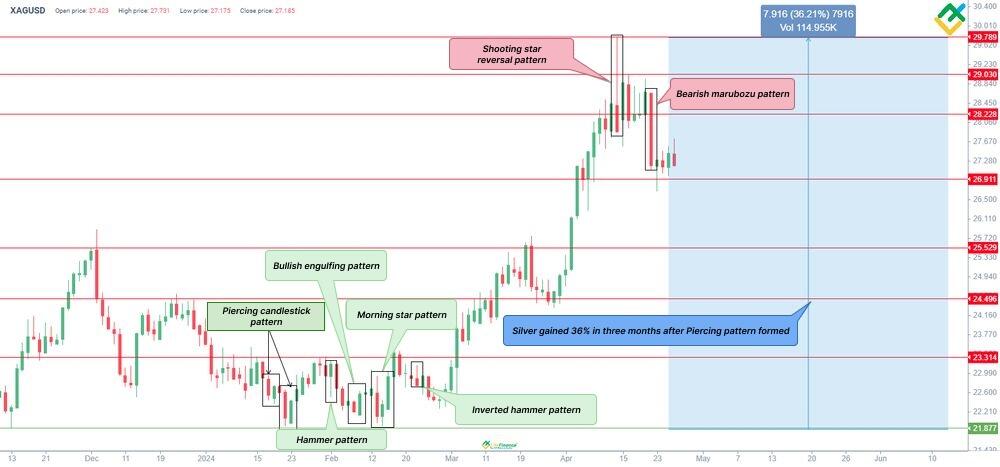
After a prolonged downtrend, silver quotes began to consolidate in the range of $21.87–$23.31.
Notably, the asset formed several bullish reversal patterns of candlestick analysis such as “Hammer”, “Inverted hammer”, “Morning star”, and “Bullish engulfing”. However, the very first trend reversal signal was a series of “Piercing” patterns. The patterns warned about the growing bullish strength before other patterns did. The rest of the patterns only confirmed the asset’s upcoming rally.
Thus, since the “Piercing” patterns emerged, the price of the precious metal added 36% in three months, reaching $29.78 for the first time in three years.
The “Shooting star” with a long upper shadow and “Bearish marubozu” patterns signaled buyers to close their long trades, pushing prices down to $26.91.
How to Trade Piercing Pattern
Despite the fact that the “Piercing” pattern appears quite rarely on the chart, it still predicts the upward trend reversal like other reversal patterns.
Let’s analyze several effective and profitable trading strategies using the “Piercing” pattern.
1. Trading the “Piercing” pattern from support levels using other candlestick patterns.
This trading strategy involves using other candlestick or chart patterns to confirm the “Piercing” pattern on the chart.
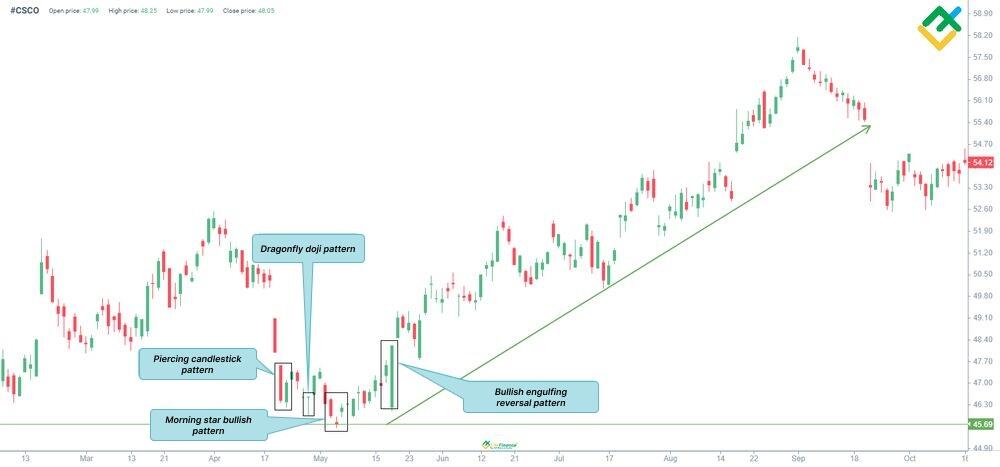
Let’s analyze this strategy using Intel Corp. stock as an example.
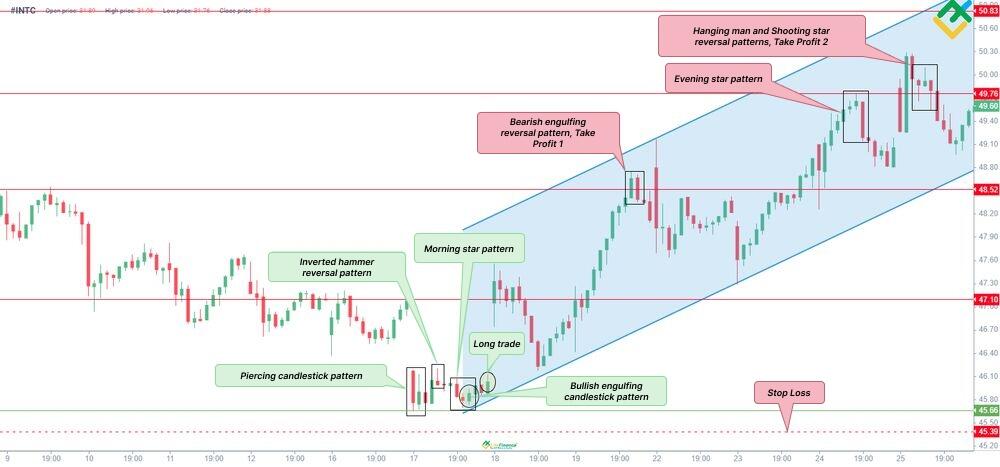
The M30 chart shows that the “Piercing” pattern did not form properly, as the second candlestick did not overlap the first one by half but closed slightly lower. However, it did close at the important support level of $45.66, providing a preliminary signal for a bullish reversal.
In addition to the “Piercing” pattern, the chart shows a series of reversal patterns: “Inverted hammer,” “Morning star,” and “Bullish engulfing.” The combination of these patterns indicates that the asset has reached the trend’s bottom and is ready for an upward reversal.
In this case, a long trade can be opened at $45.66 after all these reversal candlestick patterns have been formed.
The first take-profit order should be set at the resistance level of $48.52, where the “Bearish engulfing” candlestick pattern was formed, signaling a bearish reversal. However, it turned out to be a downward correction within the short-term uptrend.
The remaining part of the long trade can be closed with a profit at $49.76. At this level, bears began to form the “Evening star,” “Hanging man,” and “Shooting star” patterns, warning that bulls are weakening and the trend is about to reverse at its peak.
In this case, a stop-loss order should be placed below the support level of $45.66 and the “Piercing” pattern’s gap.
2. Trading the “Piercing” pattern, confirming it with technical indicators
This trading strategy employs technical indicators to confirm a reversal signal generated by the “Piercing” pattern.
The most useful and effective technical indicators include:
-
Trading volume and cash flow indicators: OBV, MFI, VWAP, Chaikin Oscillator, A/D (Accumulation/Distribution), tick volumes.
-
Trend and volatility indicators: MACD, MA Cross, Bollinger Bands.
- Stochastic indicators and oscillators that allow you to assess the strength of the current trend and potential price reversal levels: RSI, Stochastic.
Let’s test this strategy on the UKBRENT chart.
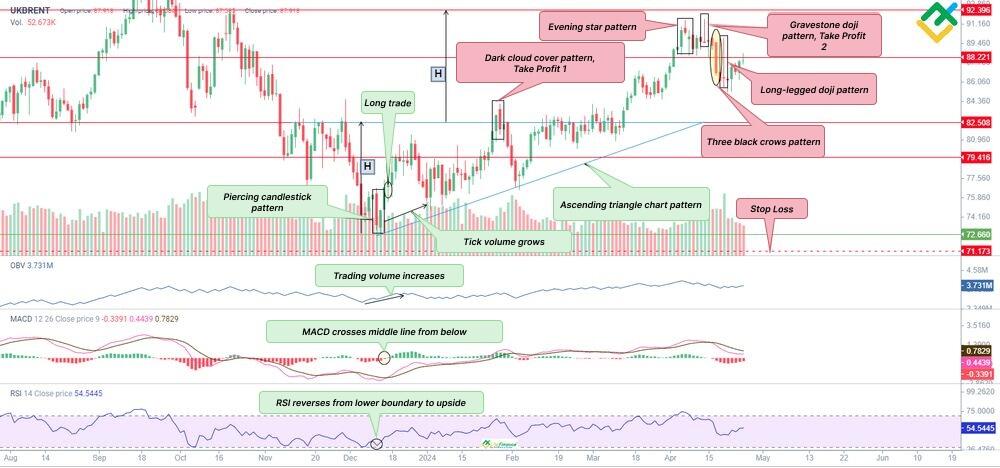
The daily chart shows a “Piercing” pattern formed after a long downtrend, giving a strong reversal signal.
In addition, after the formation of the pattern, trading and tick volumes began to increase sharply, indicating increased trading activity on the part of buyers.
The MACD indicator crossed the zero line from below and began to grow in the positive zone. The RSI rebounded from the lower boundary and turned upward, confirming the asset’s growth potential.
Notably, after the “Piercing” pattern, a large “Ascending triangle” pattern began to appear on the chart.
An “Ascending triangle” is a bullish price pattern that is formed after a long downtrend and signals an upward trend reversal. This pattern can also emerge in the middle of a bullish trend, signaling the continuation of bullish momentum. The height of the triangle measures the price movement within this pattern.
The trading instrument has formed a lot of upward reversal signals, so a long trade can be opened after the “Piercing” pattern. In this case, a stop-loss order should be placed below the support level of $72.66 and the pattern’s bottom.
The first target is at $82.50, where the upper boundary of the “Ascending triangle” pattern is located. In addition, the formation of the “Dark cloud cover” reversal pattern became a signal to close a part of trades and lock in profits.
All trades could be closed near $92.39 as a lot of bearish reversal patterns were formed in the resistance area. These include the “Evening star pattern,” “Gravestone doji,” “Long-legged doji,” and “Three black crows” patterns.
Piercing Line vs Dark Cloud Cover
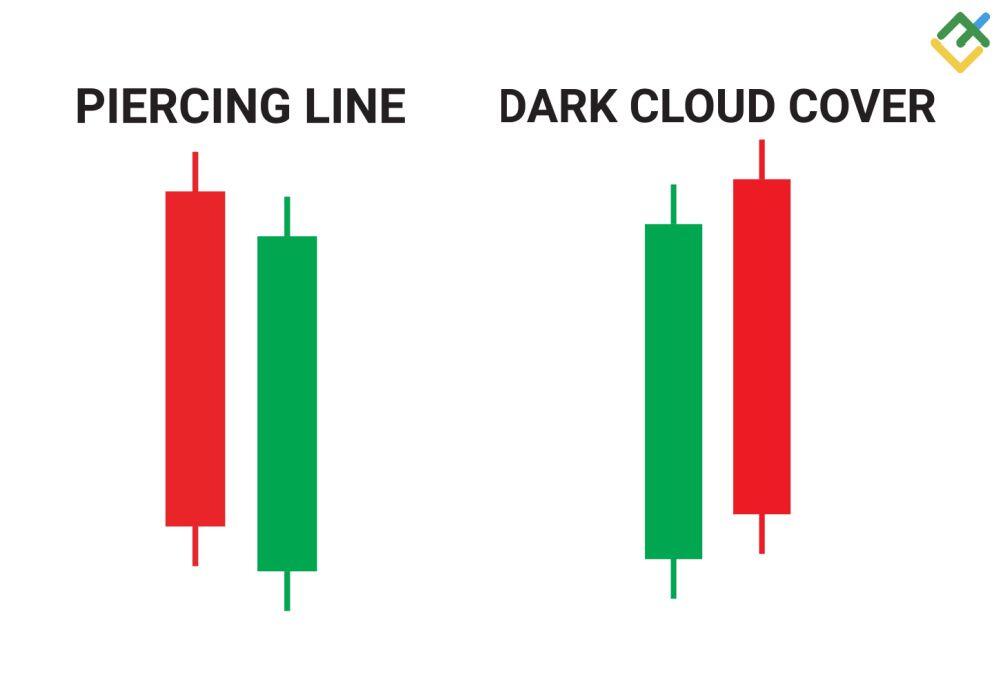
The “Piercing” pattern resembles an opposite “Dark cloud cover” pattern.
The table below describes the key differences between the patterns
|
Piercing |
Dark cloud cover |
|
Forms at the bottom after a long downtrend or within a consolidation zone. |
Appears at the top after a long bullish trend. |
|
Gives potential bullish reversal signs. |
Signals a bearish reversal. |
|
The first candlestick of the pattern should be bearish, and the second one should be bullish. |
The first bullish candlestick is followed by a bearish candlestick. |
|
The second candlestick should overlap the first one by at least half. In some cases, this may not happen, and then the pattern requires confirmation. |
The “Dark cloud cover” pattern’s second candlestick may not overlap the first candlestick by at least half. |
|
A stop-loss order should be placed below the support level or the second candlestick’s low. |
A stop-loss order is set above the resistance level or the second candlestick’s high. |
Piercing Pattern Pros and Cons
The “Piercing” pattern has a number of advantages and disadvantages.
Advantages:
-
It is easy to identify the pattern on the chart;
-
It has its own trading rules, thanks to which the pattern can be easily adapted to your trading strategy;
-
It gives an early trend reversal signal, allowing you to open a long trade at more attractive prices.
Disadvantages:
-
The pattern appears rarely on all timeframes but not in all financial markets.
-
Most often, the pattern can be found in the stock and commodity markets. In the Forex market, the pattern is less likely to be found;
-
It requires confirmation with the help of other candlestick or chart patterns, as well as technical indicators.
Conclusion
The “Piercing” pattern is an efficient pattern of candlestick analysis, the formation of which occurs in the area of low prices after a long downtrend.
The pattern warns market participants about the weakening sellers’ strength and an upward trend reversal.
The pattern emerges quite rarely. However, it appears in the stock or commodity markets more often than in the currency market.
The “Piercing” pattern has clear criteria for entering a trade, exiting it, as well as placing stop-loss orders.
You can test your trading strategy that involves a “Piercing” pattern on a free demo account from LiteFinance, the best broker on Forex. The multifunctional and practical online platform will provide you with a wide range of different trading tools, as well as an opportunity to test the pattern without financial losses.
FAQs on Piercing Candlestick Pattern
The pattern is built with two candlesticks, the first of which should be bearish and the second one should be bullish. In addition, the second candlestick should open with a gap down significantly below the closing price of the previous candlestick. By the end of the trading period, it should close above and overlap the first candlestick by at least half.
The “Piercing” pattern is a bullish technical analysis pattern that alerts market participants to the imminent upward price reversal or to the weakening pressure of sellers in the market.
The pattern allows you to enter into a long trade, place a stop-loss order, and exit the market when the price hits a preset take-profit order.
Unlike the “Bullish engulfing” pattern, the second candlestick of the “Piercing” pattern should overlap the first candlestick at least halfway, but not close it completely. In the case of the “Bullish engulfing,” the second bullish candlestick should completely exceed the body of the first bearish candlestick.
The “Piercing line” pattern is limited to a situation in which a third long bearish candlestick is built after the second bullish candlestick. This means that the selling pressure has revived and the downtrend will likely continue.
The content of this article reflects the author’s opinion and does not necessarily reflect the official position of LiteFinance. The material published on this page is provided for informational purposes only and should not be considered as the provision of investment advice for the purposes of Directive 2004/39/EC.
{{value}} ( {{count}} {{title}} )
This post is originally published on LITEFINANCE.


