
The US attack on Iran’s nuclear sites has introduced a new stage in the ongoing geopolitical conflicts. Historically, oil has exhibited volatile behavior in response to significant escalations. Will history repeat itself? Let’s discuss this topic and make a trading plan for Brent.
The article covers the following subjects:
Major Takeaways
- The US has attacked Iran’s nuclear facilities.
- Tehran may retaliate by closing the Strait of Hormuz.
- History shows that geopolitical shocks are short-lived.
- The rise in Brent to $88 and $96 per barrel will give a sell signal.
Weekly Fundamental Forecast for Brent
As markets eagerly anticipate Iran’s response to the recent US attacks, Brent quotes have rapidly filled the gap. Tehran finds itself in a challenging position where any move it makes could potentially worsen its standing. Symbolic retaliation against the US would be perceived as a sign of weakness. Blocking the Strait of Hormuz would impact China, Iran’s primary oil buyer. Understandably, Iran is hesitant about the retaliation.
Markets tend to react to events promptly without much deliberation. The recent rise in the price of Brent to its 5-month high, which occurred amid reports of the US bombing of nuclear facilities in Tehran, appeared to stem from a logical sequence of events. According to Goldman Sachs, Brent crude oil is expected to reach $110 per barrel within a month and then add another 10% by the end of the year if Iran blocks the Strait of Hormuz. Should it decide to reduce its exports to 1.75 million bpd, the price of oil will rise to $90.
Is this a cause for concern? Absolutely! History has demonstrated that a rapid doubling of oil prices can trigger recessions in developed economies. However, the United States has become significantly less dependent on oil imports. Notably, geopolitical conflicts rarely result in Brent prices reaching higher ranges. Typically, Brent swiftly reverts to its usual trading range.
Brent and S&P 500 Reaction to First Gulf War
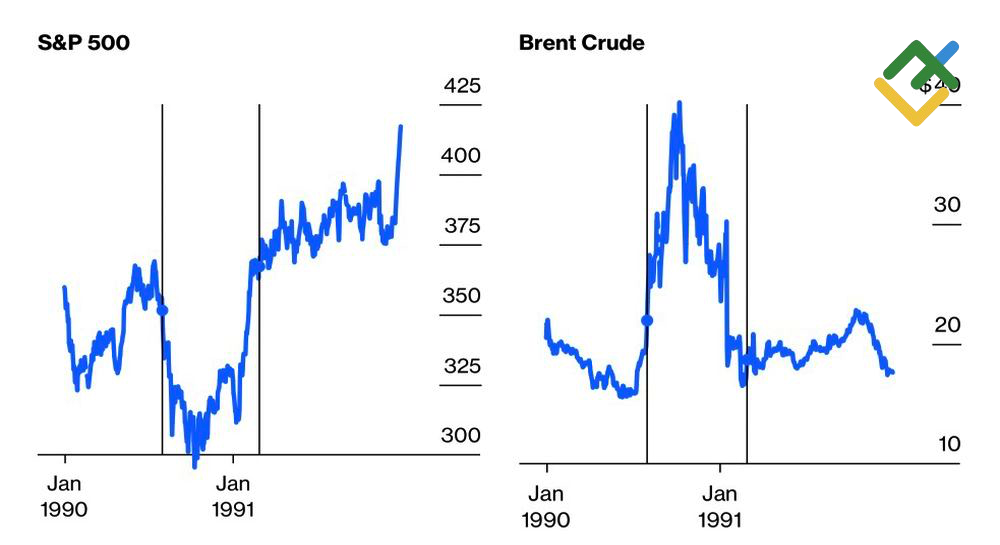
Source: Bloomberg.
This was also the case during the First Gulf War, when oil prices peaked between August and October 1991 due to Iraq’s invasion of Kuwait. By January 1992, the Brent crude price had stabilized at its pre-war level, largely due to Operation Desert Storm. During the Second Gulf War, there was a 46% increase in Brent, followed by a decline. A similar pattern emerged during Russia’s operation in Ukraine in early 2022. At that time, the price of oil increased to $130 per barrel and then decreased to $95.
The primary factors behind elevated volatility during periods of geopolitical unrest include substantial onshore reserves and a decline in demand due to excessively high prices. In the market, fear quickly gives way to greed. Just as individual investors purchase US stocks during market downturns, experienced traders sell oil when prices soar.
Speculative Positions on Brent
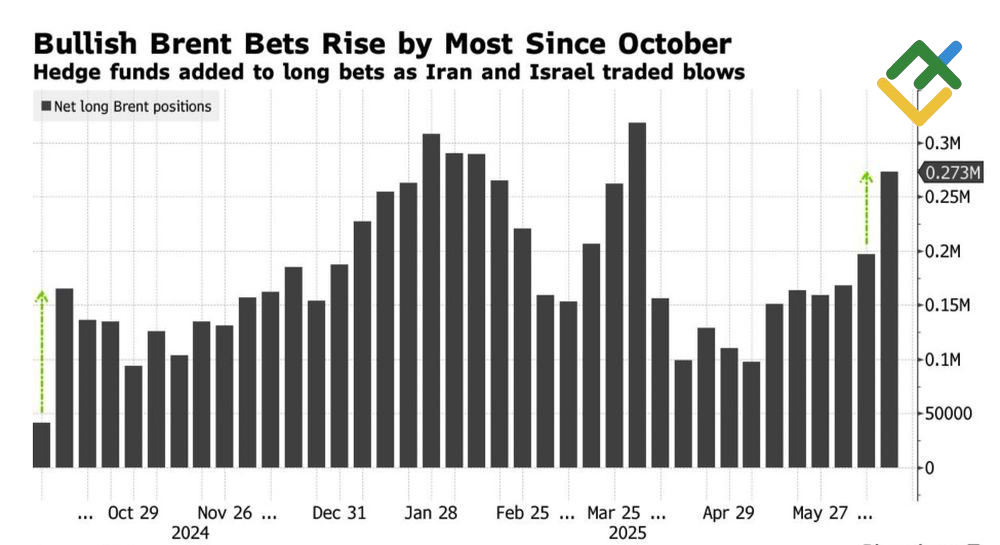
Source: Bloomberg.
This strategy could be very effective given the sharp increase in speculative demand. By the close of the week on June 17, hedge funds and asset managers had increased their net long position in Brent at the fastest pace in eight months.
Weekly Trading Plan for Brent
The scale of Iran’s retaliation is the primary focus now. If it is limited to symbolic measures, Brent can be sold now. However, a partial closure of the Strait of Hormuz or a reduction in exports will allow traders to open short trades on a rebound from $88 and $96 per barrel.
This forecast is based on the analysis of fundamental factors, including official statements from financial institutions and regulators, various geopolitical and economic developments, and statistical data. Historical market data are also considered.
Price chart of UKBRENT in real time mode
The content of this article reflects the author’s opinion and does not necessarily reflect the official position of LiteFinance broker. The material published on this page is provided for informational purposes only and should not be considered as the provision of investment advice for the purposes of Directive 2014/65/EU.
According to copyright law, this article is considered intellectual property, which includes a prohibition on copying and distributing it without consent.
{{value}} ( {{count}} {{title}} )
This post is originally published on LITEFINANCE.


