Microsoft Corporation, a cornerstone in the tech industry, has consistently demonstrated resilience and innovation, making its stock (MSFT) a key player in many investors’ portfolios.
However, like other IT giants, Microsoft encounters occasional difficulties. One such massive and unprecedented outage occurred on July 19, 2024, when 8.5 million Windows computers worldwide stopped working. The problem was not Microsoft’s operating system but an automatic update to an antivirus program from CrowdStrike.
How did the outage affect Microsoft’s stock price? What kind of losses did it cause, and how many companies were affected?
This article provides expert MSFT stock price forecasts for 2024 and beyond. Additionally, technical and fundamental analysis is provided. Read on to discover professional analysis and develop your own strategy for successful Microsoft stock trading.
The article covers the following subjects:
Highlights and Key Points: Microsoft Share Price Forecast 2024–2030
- As of 26.07.2024, Microsoft (MSFT) stocks are trading at $427.60.
- A lot of analysts anticipate that Microsoft’s shares will decline and reach $420 – $434 range by the end of 2024. More optimistic projections indicate that the rate will fluctuate between $489 – $492.
- In 2025, many experts project the continuation of the current bullish trend. Therefore, the price may reach the range of $822 to $953. Nevertheless, a number of analytical agencies predict the opposite and anticipate fluctuations in the range of $462 – $623.
- In 2026, analysts estimate that Microsoft stock may reach $702 – $886. More optimistic projections indicate the potential for growth to reach unprecedented levels, with estimates ranging from $1,041.40 to $1,502,75. However, some analysts expect a decline in the price to reach $413,28.
- Forecasts for such a long period from different sources diverge, but most experts suggest continued growth for Microsoft stock in 2027–2030. Consequently, the MSFT rate may reach the level of $937. Some experts believe that the quotes may climb to $1666,67.
MSFT Stock Price Today Coming Days and Week
Analysts are optimistic about Microsoft stock for the next 12 months. According to the consensus of 35 independent stock market analysts, the average price is expected to be $490.00.
In the near future, investors will keep a close eye on the company’s financial report for the second quarter, which is scheduled for release on July 29, 2024. Analysts anticipate that the tech giant’s revenue will increase to $64.37 billion from $61.86 billion in the first quarter of 2024. This, according to a number of experts, may have a positive impact on the MSFT share price, which is forecast to rise to $464.58.
Another key point of interest to investors and traders in the near future will be Microsoft’s handling of the CrowdStrike event. The global failure of Windows on 8.5 million PCs due to a malfunctioning update of the antivirus software from CrowdStrike is estimated to have resulted in losses exceeding $5 billion and affected 500 major companies in the US.
Against this backdrop, Microsoft shares opened at a price gap on July 19, 2024, with the price dropping from the previous trading day’s closing price of $440.74 to $432.82. However, buyers managed to recover their positions in the same trading session, dragging the price to $436.95. However, this outage severely harmed the company’s reputation due to an identified vulnerability in the Windows OS.
Microsoft Stock Forecast for 2024
Many analysts at the world’s leading agencies are bearish on Microsoft shares, though with nuanced forecasts. The consensus is that the stock price could reach $420 – $434. However, some experts forecast the surge to $489 – $492.
PandaForecast
Price range for 2024: $337.76 – $420.23 (as of July 26, 2024)
PandaForecast anticipates that the asset’s value will range from $337.76 to $420.23 per share until the end of 2024. By the end of November, the stock is expected to decline gradually, reaching a minimum of $337.76, and then correcting to $70.17.
| Month | Average price, $ | Minimum, $ | Maximum, $ |
|---|---|---|---|
| August | 409.60 | 398.54 | 422.71 |
| September | 396.49 | 373.10 | 415.92 |
| October | 395.70 | 368.79 | 420.23 |
| November | 360.09 | 337.76 | 384.57 |
| December | 370.17 | 347.59 | 389.42 |
Trading Economics
Price range for 2024: $415.34 – $439.68 (as of July 26, 2024)
Analysts at Trading Economics expect MSFT to decline in value by the end of the third quarter, with an average price target of $439.68. Based on global macro platform model forecasts and expert consensus, the average price of the asset may fall to $415.34 over the next 12 months.
Predict-Price
Price range for 2024: $380.66 – $727.47 (as of July 26, 2024)
Analysts at Predict-Price, an AI-powered platform, project that Microsoft’s stock price could reach $727.47 by the end of 2024, assuming favorable market conditions. This represents a 16.34% probability. Conversely, in an unfavorable scenario, the price could decline to $380.66.
CoinPriceForecast
Price range for 2024: $434 – $457 (as of July 26, 2024)
According to CoinPriceForecast experts, MSFT may reach $473.00 by the end of 2024.
| Year | Mid-Year, $ | Year-End, $ |
|---|---|---|
| 2024 | 457 | 434 |
LongForecast
Price range for 2024: $343 – $476 (as of July 26, 2024)
LongForecast experts suggest that the MSFT price will range between $343 and $476 over the next three months. In October, experts predict that the stock will hit a new all-time high of $476, but in November the price will crash down to $410. The share price is expected to close the year at $419.
| Month | Opening price, $ | Min–Max price, $ | Closing price, $ |
|---|---|---|---|
| August | 400 | 343-422 | 382 |
| September | 382 | 382-454 | 420 |
| October | 420 | 406-476 | 441 |
| November | 441 | 377-443 | 410 |
| December | 410 | 385-453 | 419 |
CoinCodex
Price range for 2024: $320.38 – $432.04 (as of July 26, 2024)
Analysts at CoinCodex observe a prevailing bearish sentiment in the market, with a slight edge. The fear index indicates a level of 39, suggestive of market apprehension. Consequently, experts predict a decline in the MSFT rate to $320.38 at its minimum and to $345.41 at the year-end.
| Year | Minimum, $ | Maximum, $ |
|---|---|---|
| 2024 | 320.38 | 432.04 |
WalletInvestor
Price range for 2024: $443.35 – $490.01 (as of July 26, 2024)
According to WalletInvestor, Microsoft’s share price will fluctuate between $443.35 and $490.01 over the next six months. The stock will likely close the year at $489.23.
| Month | Opening, $ | Closing, $ | Minimum, $ | Maximum, $ |
|---|---|---|---|---|
| August | 443.35 | 451.98 | 443.35 | 452.08 |
| September | 452.05 | 445.29 | 444.14 | 452.15 |
| October | 445.27 | 464.49 | 445.27 | 464.49 |
| November | 465.08 | 482.98 | 465.08 | 483.28 |
| December | 482.70 | 489.23 | 482.28 | 490.01 |
GovCapital
Price range for 2024: $374.64 – $565.48 (as of July 26, 2024)
Analysts at GovCapital maintain a positive outlook on Microsoft shares, with an anticipated average price of $491.72 by the end of the year.
| Month | Average, $ | Minimum, $ | Maximum, $ |
|---|---|---|---|
| August | 441.45 | 375.23 | 507.66 |
| September | 440.75 | 374.64 | 506.87 |
| October | 447.82 | 380.64 | 514.99 |
| November | 480.72 | 408.61 | 552.83 |
| December | 491.72 | 417.96 | 565.48 |
Microsoft Stock Technical Analysis
Let’s conduct technical analysis on the H4, D1, W1, and MN time frames to gain insight into the future trajectory of Microsoft stock prices.
In addition to identifying key support and resistance levels, it is important to utilize technical indicators such as the stochastic oscillator, MACD, OBV, MA Cross, and tick volume. These tools help gauge the strength of the current trend and its phase, identifying oversold/overbought zones on the trading instrument, monitoring trading volumes, and tracking the general market trend.
The technical analysis also requires identifying chart and candlestick patterns to gain further insights into the asset. Candlestick patterns can be used to predict potential price reversal levels, allowing investors to enter the market at optimal prices and minimize risk.
On Microsoft charts, one can frequently find a variety of technical patterns, including “Head and shoulders,” “Double bottom,” and “Double top” chart patterns, as well as “Engulfing” candlestick patterns.
Let’s examine the #MSFT monthly chart to gain preliminary understanding of the market situation.
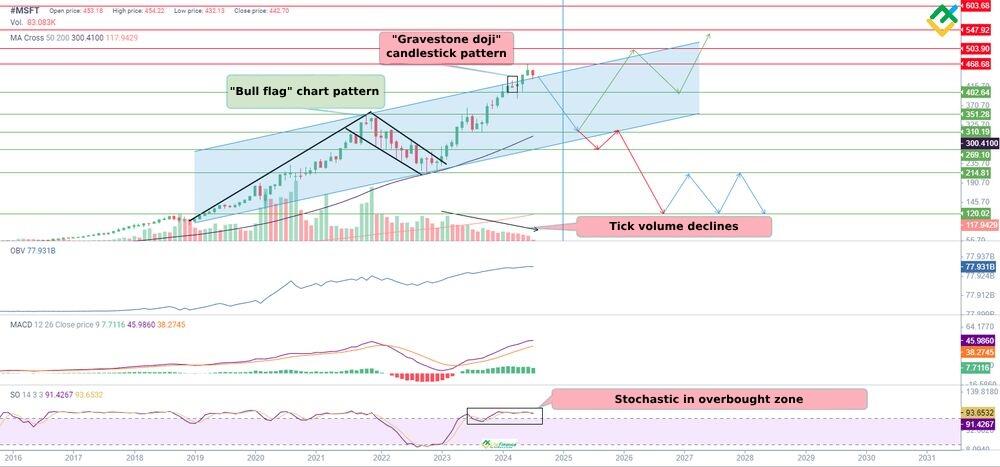
The chart displays that the price formed a large “Bull flag” pattern and broke through the pattern’s upward boundary in January 2023 at $242.85. Since that time, the asset’s value has soared by 93% and reached $468.31. The pattern’s potential target is estimated to be within the range of $468.68 to $503.90.
However, the “Gravestone doji” reversal candlestick pattern appeared near the resistance level at $468.68 in March 2024. As a rule, this pattern points to the weakening potential of bulls and the mounting pressure on the price from bears.
Notably, the MSFT price increased, while tick volume plunged, indicating that interest in the asset on the part of bulls is waning. However, market volumes as indicated by the OBV indicator is on an upward trajectory, demonstrating a gradual deceleration in growth. This may indicate that bulls are still outperforming bears in the market.
The MACD indicator values are trending upward, but also showing signs of weakening, which indicates that the bullish trend is gradually losing steam. The stochastic oscillator has been in an overbought zone for an extended period since May 2023. This could be a potential signal of an impending downward price reversal.
The MA Cross indicator demonstrates the stability of the trend. The MA50 and MA200 are below the current price of the asset, indicating the strength of bulls.
A preliminary analysis of Microsoft shares on the monthly chart indicated that the asset is overheated. In addition, there were signals for a downward correction to the lower boundary of the uptrend.
blog
Promo code
#MSFT Stock Forecast For Next Three Months
The H4 and D1 time frames will assist us in forecasting the MSFT price movement over the next three months.
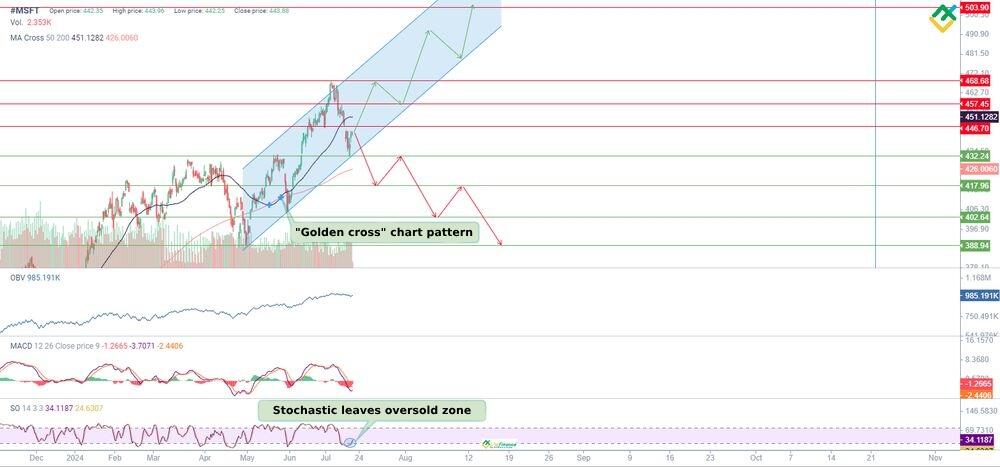
On the 4-hour chart, the asset maintains an uptrend. The “Golden cross” chart pattern was formed, hinting at a potential buying opportunity.
At the moment, the Stochastic indicator values have reversed in the oversold zone and returned back to the neutral range, pointing to a potential for further growth. MACD is moving in the negative zone, heading up to the zero boundary.
The volume on the OBV indicator remains elevated and is trending sideways.
The current price is below the MA50 line, which is at the resistance level of $451.12, but still above the MA200 line, which is near the support level of $426.00, suggesting market uncertainty.
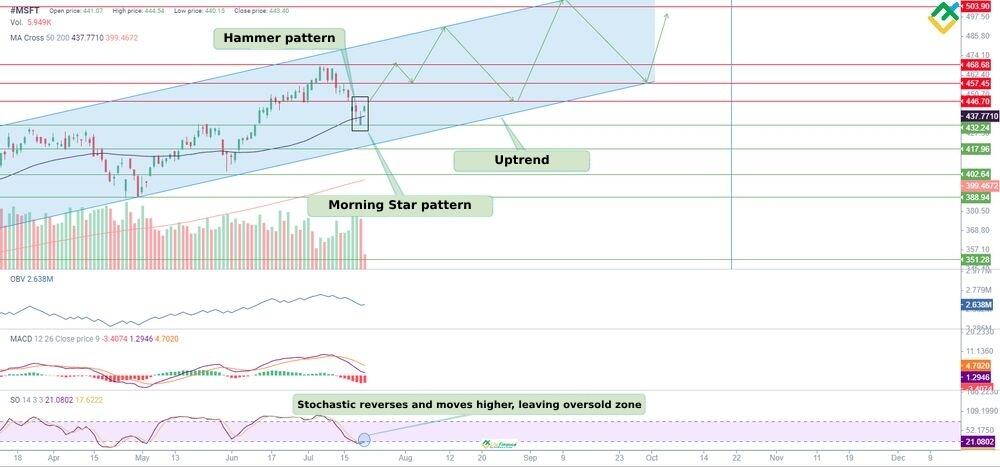
The daily chart of Microsoft stock gives a clearer picture of the current situation and generates more buy signals.
Within the uptrend channel, a “Morning star” pattern has formed, which includes a “Hammer” candlestick. In addition, the pattern was formed at the dynamic support level of $437.78, as indicated by the MA50.
The stochastic oscillator is moving in the oversold zone, harbinging potential growth. In order for this to happen, the values should pierce the lower boundary from below. The MACD is reversing smoothly in the negative zone, signaling a potential resumption of growth.
According to the OBV indicator, market volume is gradually decreasing, showing the recent drop in value after the price hit the all-time high of $468.31.
In the current situation, the price is expected to rise further, touching new record highs over a few months. If the resistance level of $446.70 is breached, the price may climb to the range of $457.45–$503.90.
An alternative scenario suggests active selling on increased volume. In this case, the price will consolidate below the key area of $432.24–$417.96, where the diagonal trendline and the 50-day support are located. After that, the MSFT price is likely to fall to $420.64.
Long-Term Microsoft Technical Analysis for 2024
Let’s use a weekly chart to determine the asset’s direction until the end of 2024.
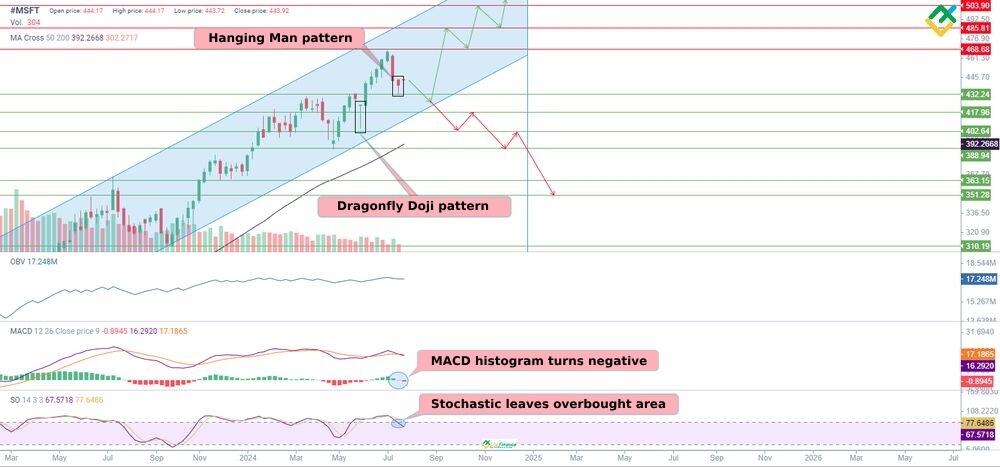
The weekly chart shows “Dragonfly doji” and “Hanging man” candlestick patterns at the support levels of $417.96 – $432.24, warning market participants of the looming price reversal after the price hit its all-time high.
The OBV indicator reflects that trading volume is moving horizontally, while the price is rising. This points to the fading bullish strength and a possible downward reversal.
MACD values have crossed the zero threshold and are decreasing in the negative zone, which also shows signs of a weakening bullish trend. The stochastic oscillator has started to decline in the overbought zone and continues to fall, indicating strengthening bearish momentum.
However, bulls may try to push the price upward, but it will likely be a temporary recovery in the form of a “Dead cat bounce” pattern. This will allow the stock to climb above its record high. After that, the asset will reverse to the downside. The key resistance level is the psychological level of $500.00.
Below is a forecast of potential price lows and highs through the end of 2024.
| Month | Microsoft Corporation (#MSFT) Projected Price Values | |
|---|---|---|
| Minimum, $ | Maximum, $ | |
| August | 431.65 | 450.29 |
| September | 446.66 | 477.74 |
| October | 469.97 | 483.95 |
| November | 468.42 | 497.42 |
| December | 482.40 | 502.60 |
Long-Term Trading Plan for Microsoft Corporation (#MSFT)
The strength of the bulls is waning but there is still some upside potential as the conducted technical analysis of MSFT shows.
Trading plan for three months
- In the next three months, bulls will most likely drag the MSFT price above the all-time high of $468.31, reinforcing bullish momentum towards the psychological level of $500.00.
- This scenario will be canceled if the stock breaches the trend’s lower boundary and consolidates below the support at $432.24. In this case, the price may plunge to the area of $417.96–$402.64.
- Key support levels: $432.24, $417.96, $402.64, $388.94, $351.28.
- Key resistance levels: $446.70, $457.45, $468.68, $503.90.
Trading plan for 2024
- The higher time frames give bearish signals, pointing to a trend reversal. In particular, the “Dragonfly doji” and “Hanging man” candlestick patterns confirm this.
- Nevertheless, the trend line is ascending, and support levels in the form of MA50 and MA200 are located below the current price. This indicates that bulls are prevailing in the market, but their strength is fading.
- Key support levels: $432.24, $417.96, $402.64, $388.94, $363.15, $351.28, $310.19.
- Key resistance levels: $468.68, $485.81, $503.90.
Start trading with a trustworthy broker
Microsoft Stock Forecast for 2025
According to stock market experts, Microsoft stock may increase to $791 – $952 in 2025.
GovCapital
Price range for 2025: $421,24 – $952,83 (as of July 26, 2024)
In the first half of the year, the value of the asset is expected to fluctuate within the range of $495,58 – $569,90, according to experts from GovCapital. The minimal price is projected to be $421.24, while the maximum price is anticipated to be $655.38. In the second half of 2025, experts forecast further growth to $828.55.
| Month | Average, $ | Minimum, $ | Maximum, $ |
|---|---|---|---|
| January | 495,58 | 421,24 | 569,91 |
| February | 513,22 | 436,24 | 590,20 |
| March | 525,61 | 446,77 | 604,46 |
| April | 538,13 | 457,41 | 618,85 |
| May | 549,61 | 467,17 | 632,05 |
| June | 569,90 | 484,41 | 655,38 |
| July | 625,12 | 531,35 | 718,89 |
| August | 774,09 | 657,98 | 890,20 |
| September | 770,44 | 658,69 | 890,01 |
| October | 779,42 | 672,06 | 909,26 |
| November | 812,65 | 698,79 | 945,42 |
| December | 828,55 | 704,27 | 952,83 |
Predict-Price
Price range for 2025: $364.21 – $884.43 (as of July 26, 2024)
Predict-Price also offers a bullish outlook on Microsoft’s stock price in 2025. The price is projected to grow, with a probability of 22.37%, and may reach the level of $884.43 under favorable conditions. Conversely, in a negative scenario, quotes may slump to $364.21, though this is an unlikely outcome.
WalletInvestor
Price range for 2025: $487,77 – $622,79 (as of July 26, 2024)
Analysts at WalletInvestor anticipate that MSFT will trade between $487.77 and $564.74 during the first half of the year. They project that the bullish trend will persist in the second half of 2025, with an expected price of $622.71 by the end of the year.
| Month | Opening, $ | Closing, $ | Minimum, $ | Maximum, $ |
|---|---|---|---|---|
| January | 489.531 | 506.613 | 487.771 | 506.613 |
| February | 509.765 | 504.954 | 504.954 | 513.620 |
| March | 504.059 | 522.919 | 503.589 | 522.919 |
| April | 523.189 | 527.521 | 523.189 | 527.666 |
| May | 528.107 | 540.430 | 528.107 | 540.430 |
| June | 541.630 | 564.748 | 541.630 | 564.748 |
| July | 564.825 | 575.829 | 564.825 | 575.829 |
| August | 575.987 | 584.772 | 575.987 | 584.823 |
| September | 585.014 | 577.805 | 577.308 | 585.326 |
| October | 578.619 | 597.018 | 578.619 | 597.018 |
| November | 599.530 | 616.013 | 599.530 | 616.274 |
| December | 615.754 | 622.712 | 615.312 | 622.791 |
CoinCodex
Price range for 2025: $409.51 – $557.68 (as of July 26, 2024)
According to CoinCodex, the share price of Microsoft will continue to appreciate, reaching $526.79 in 2025. The stock may add more than 25% compared to the current values.
| Year | Average price, $ | Change |
|---|---|---|
| 2025 | 526.79 | 25.90% |
CoinPriceForecast
Price range for 2025: $439 – $462 (as of July 26, 2024)
Analysts at CoinPriceForecast predict that the value of Microsoft shares will reach $439 by mid-2025 and $462 by the end of the year.
| Year | Mid-Year | Year-End |
|---|---|---|
| 2025 | 439 | 462 |
LongForecast
Price range for 2025: $397 – $822 (as of July 26, 2024)
Analysts at LongForecast believe that Microsoft shares will trade in a wide price range in 2025. Thus, the instrument’s price will vary within the boundaries of $397 – $600 in the first half of the year. Between July and December 2025, the value of MSFT will continue to rise, hitting the $761 mark.
| Month | Opening price, $ | Min–Max price, $ | Closing price, $ |
|---|---|---|---|
| January | 419 | 397-465 | 431 |
| February | 431 | 426-500 | 463 |
| March | 463 | 428-502 | 465 |
| April | 465 | 463-543 | 503 |
| May | 503 | 503-595 | 551 |
| June | 551 | 512-600 | 556 |
| July | 556 | 514-604 | 559 |
| August | 559 | 516-606 | 561 |
| September | 561 | 528-620 | 574 |
| October | 574 | 574-675 | 625 |
| November | 625 | 609-715 | 662 |
| December | 662 | 662-822 | 761 |
PandaForecast
Price range for 2025: $362.18 – $478.38 (as of July 26, 2024)
PandaForecast offers a more cautious outlook on MSFT in 2025, with some negative projections. In January, the average price will hover near $390.53, with shares trading between $362.18 and $478.38 over the course of the year. Meanwhile, experts anticipate a high of $478.38 in September 2025. By December, the average price is expected to stand at $439.03.
| Month | Average price, $ | Minimum, $ | Maximum, $ |
|---|---|---|---|
| January | 390.53 | 382.33 | 410.84 |
| February | 387.40 | 373.07 | 405.22 |
| March | 391.67 | 374.43 | 403.02 |
| April | 372.87 | 363.54 | 401.95 |
| May | 402.32 | 382.61 | 425.66 |
| June | 415.20 | 384.06 | 433.47 |
| July | 390.70 | 362.18 | 416.49 |
| August | 428.99 | 416.55 | 454.30 |
| September | 452.58 | 425.43 | 478.38 |
| October | 451.68 | 428.64 | 466.13 |
| November | 439.03 | 405.23 | 457.91 |
| December | 438.59 | 420.61 | 464.03 |
Microsoft Stock Forecast for 2026
Analysts project that Microsoft stock will trade within a price range of $702 – $886 in 2026. Some experts predict the price to hit above $1,000.
PandaForecast
Price range for 2026: $308,56 – $413,28 (as of July 26, 2024)
PandaForecast expects a strong volatility at the beginning of 2026. In the first half of the year the price levels will rise and fall rapidly, reaching $439.10 on the top and $418.77 at the bottom. The second half of the year won’t differ drastically, though the asset will gain by December, estimating at $439.
| Month | Average price, $ | Minimum, $ | Maximum, $ |
|---|---|---|---|
| January | 421.05 | 392.42 | 449.26 |
| February | 428.63 | 405.48 | 446.63 |
| March | 418.77 | 398.25 | 439.71 |
| April | 431.33 | 416.23 | 442.55 |
| May | 439.10 | 426.80 | 466.32 |
| June | 430.75 | 417.40 | 444.11 |
| July | 432.48 | 417.77 | 449.34 |
| August | 451.50 | 432.54 | 485.37 |
| September | 433.44 | 421.74 | 442.55 |
| October | 441.25 | 428.45 | 469.04 |
| November | 454.93 | 424.45 | 474.94 |
| December | 439.00 | 421.44 | 447.78 |
GovCapital
Price range for 2026: $714,93 – $1 502,75 (as of July 26, 2024)
Analysts at GovCapital give optimistic forecasts for Microsoft shares in 2026. They anticipate that the stock will skyrocket to $1 502,75 by the end of the year.
| Month | Average, $ | Minimum, $ | Maximum, $ |
|---|---|---|---|
| January | 841,10 | 714,93 | 967,26 |
| February | 868,78 | 738,47 | 999,10 |
| March | 886,12 | 753,20 | 1019,04 |
| April | 905,13 | 769,36 | 1040,90 |
| May | 927,52 | 788,40 | 1066,65 |
| June | 957,20 | 813,62 | 1100,78 |
| July | 1029,57 | 875,14 | 1184,01 |
| August | 1 222,17 | 1 038,84 | 1 405,49 |
| September | 1 228,42 | 1 047,65 | 1 415,33 |
| October | 1 244,20 | 1 066,97 | 1 443,55 |
| November | 1 287,86 | 1 103,52 | 1 493,00 |
| December | 1 306,74 | 1 110,73 | 1 502,75 |
LongForecast
Price range for 2026: $564 – $886 (as of July 26, 2024)
LongForecast analysts predict that Microsoft’s stock price will range between $564 and $886 during 2026. The yearly high is expected in April at $886. By the end of the year, the price will settle at $659.
| Month | Opening price, $ | Min–Max price, $ | Closing price, $ |
|---|---|---|---|
| January | 761 | 682-800 | 741 |
| February | 741 | 719-843 | 781 |
| March | 781 | 676-794 | 735 |
| April | 735 | 735-886 | 820 |
| May | 820 | 739-867 | 803 |
| June | 803 | 661-803 | 718 |
| July | 718 | 619-727 | 673 |
| August | 673 | 663-779 | 721 |
| September | 721 | 564-721 | 613 |
| October | 613 | 613-728 | 674 |
| November | 674 | 651-765 | 708 |
| December | 708 | 606-712 | 659 |
CoinPriceForecast
Price range for 2026: $498 – $588 (as of July 26, 2024)
Analysts at CoinPriceForecast estimate that by mid-2026, the average price will be $498. By December, the stock may surge to $588.
| Year | Mid-Year, $ | Year-End, $ |
|---|---|---|
| 2026 | 498 | 588 |
CoinCodex
Price range for 2026: $560.44 – $702.15 (as of July 26, 2024)
CoinCodex concurs with the consensus of leading analytical agencies, anticipating an average MSFT price of $702.15 in 2026.
| Year | Average price, $ | Change |
|---|---|---|
| 2026 | 663.25 | 58.52% |
WalletInvestor
Price range for 2026: $620,70 – $756,07 (as of July 26, 2024)
WalletInvestor estimates that the MSFT price will continue to rise in 2026. The stock will range widely between $620.70–$756.07 and reach a high of $756.07 by the end of the year.
| Month | Opening, $ | Closing, $ | Minimum, $ | Maximum, $ |
|---|---|---|---|---|
| January | 622.904 | 638.037 | 620.700 | 638.037 |
| February | 641.486 | 638.478 | 638.478 | 646.856 |
| March | 637.276 | 655.345 | 636.692 | 655.345 |
| April | 656.477 | 660.796 | 656.477 | 660.796 |
| May | 660.774 | 672.943 | 660.774 | 672.943 |
| June | 674.031 | 697.222 | 674.031 | 697.222 |
| July | 698.162 | 708.455 | 698.162 | 708.455 |
| August | 709.541 | 717.902 | 709.522 | 717.902 |
| September | 717.599 | 711.176 | 710.446 | 718.417 |
| October | 711.854 | 729.016 | 711.854 | 729.016 |
| November | 731.379 | 748.812 | 731.379 | 749.216 |
| December | 748.367 | 756.071 | 748.367 | 756.071 |
Predict-Price
Price range for 2026: $341.74 – $1,041.40 (as of July 26, 2024)
According to Predict-Price, there is a 51.15% probability that the asset will rise to $1,041.40 in 2026 under favorable conditions. The lowest price for the asset is projected at $341.74.
Timeline of Microsoft Price Changes in Recent History
Navigating through the ebbs and flows of Microsoft’s share price reveals a dynamic journey reflective of both market-wide trends and the tech giant’s strategic maneuvers. Here is how the Microsoft price was developing in the last 6 years.
- 2017: The year started with an average price of around $73.05, the shares fluctuated between a low of $63.98 and a high of $85.54, indicating a bullish trend as the year progressed.
- 2018: This year saw a continuation of the upward trend with an average price of $101.92, reaching up to $114.37 at its peak and not dipping below $91.27, highlighting strong investor confidence.
- 2019: Microsoft’s momentum continued, with the average price escalating to $132.35. The shares hit a remarkable high of $157.70, showcasing the company’s solid market position.
- 2020: The year marked a significant surge in the tech industry, with Microsoft’s average price jumping to $194.65. The shares reached a high of $225.53, reflecting the increased reliance on technology solutions amid global changes.
- 2021: The average price saw another jump to $278.34, with the stock hitting a high of $336.32, underscoring Microsoft’s robust growth and innovation strategies.
- 2022: There was a slight dip in the average price to $268.87, with the highest price at $310.98, indicating a year of consolidation and resilience amidst market uncertainties.
- 2023: The price rebounded to an average of $319.52, with a peak at $378.91, as investors responded positively to Microsoft’s strategic initiatives and market adaptability.
- First half of 2024: The average price rose to the level of $411.49. At the same time, the stock hit a new all-time high of $468.31 in early July.
Long-Term Microsoft Stock Forecast for 2027-2030
Most analysts and investors expect the MSFT’s bullish trend to continue in 2027-2036. According to various estimates, the price may soar to $2,000.00.
CoinCodex
CoinCodex experts give positive forecasts for 2027–2030. According to analysts’ expectations, the stock may reach $1,666.67 in 2030.
| Year | Average price, $ | Change |
|---|---|---|
| 2027 | 835.06 | 99.59% |
| 2028 | 1,051.39 | 151.29% |
| 2029 | 1,323.75 | 216.38% |
| 2030 | 1,666.67 | 298.34% |
CoinPriceForecast
CoinPriceForecast forecasts a bullish trend for 2027–2036. By the end of 2030, the rate may rise to $937.
| Year | Mid-Year, $ | Year-End, $ |
|---|---|---|
| 2027 | 606 | 613 |
| 2028 | 682 | 750 |
| 2029 | 753 | 815 |
| 2030 | 876 | 937 |
Summary of Microsoft Stocks
Microsoft Corporation is a pioneer in the information technology sector. The tech giant develops, licenses, and supports a comprehensive range of devices, services, software, and IT solutions, which are distributed across its three main divisions: Productivity and Business Processes, Intelligent Cloud, and Personal Computing.
Here are some essential pieces of data about the stock:
- Market cap: $3.24 trillion;
- Shares outstanding: 7,432 billion;
- Public float: 7.42 billion;
- P/E ratio: 37.88;
- Payout ratio: 25.97%;
- EPS: $11.55;
- Yield: 0.69%;
- Total return price range: $48.03 (June 2016) – 468.31 (April 2024);
- Annual dividend: $2.93;
- Float shorted: 0.87%;
- Average volume: 16.94 million.
The first time investors could get their hands on Microsoft as a publicly-traded company in 1986 under the leadership of Bill Gates. MSFT share price was $21, which, adjusted for subsequent splits, was around 7.2 cents.
In 2014, longtime Microsoft executive Satya Nadella became the third CEO in the company’s history, succeeding Steve Ballmer.
What Will Affect Microsoft’s Price in 2024 and Beyond?
As we look toward the future, several key factors are poised to influence Microsoft’s stock price, including:
- Innovation and Product Releases: New technologies and software launches could drive significant interest and increase Microsoft’s market share.
- Financial Performance: Quarterly earnings reports, financial health, and sales results will continue to be critical determinants of stock valuation.
- Market Trends: Shifts in the tech industry, such as the adoption of cloud-based computing and AI, will likely impact Microsoft’s stock.
- Analyst Forecasts: Predictions and estimates from financial analysts based on current recommendation trends can sway investor sentiment.
- Global Economic Issues: Economic conditions and regulatory changes worldwide may affect Microsoft’s operational efficiency and profitability.
- A vulnerability has been identified due to a glitch in the Windows system that occurred during an automatic update of the CrowdStrike antivirus program. The failure, which occurred worldwide, resulted in a 2% decline in the value of Microsoft shares. Furthermore, over 500 major US companies were impacted by the outage. These companies collectively incurred losses amounting to approximately $5.4 billion. This unprecedented disruption highlights the potential risks and vulnerabilities associated with dependence on the global network. Such dependencies can give rise to uncertain consequences, which in turn directly impact the share price of #MSFT.
Is Microsoft Stock a Good Investment?
Microsoft has been a dominant force in the electronics and software market for nearly 50 years. The company has a global reach and a loyal customer base, winning the hearts of many investors.
The company is valued at over $3 trillion and has over 230,000 employees worldwide. Furthermore, Microsoft invests heavily in R&D, driving new developments and growth in existing business. Microsoft has a rock-solid financial position and boasts impressive financial performance, which instills confidence in this company.
The rapid development of science and technology, along with artificial intelligence, will undoubtedly play a pivotal role in the company’s long-term share price growth.
It is also important to consider the potential risks associated with the company’s operations. A case in point is the failure of 8.5 million computers worldwide due to a defective antivirus software update from CrowdStrike, which occurred on July 19, 2024. This situation resulted in significant losses for 500 major US companies, amounting to $5.4 billion, and negatively impacted Microsoft’s stock price, which dropped by 2%.
The question of whether Microsoft stock is a worthwhile investment is an indisputably affirmative one. Investing in this company is a prudent move that will help you diversify, diversify, and enhance the financial value of your portfolio.
FAQs on Microsoft Stock Price Predictions
As of 26.07.2024, MSFT is trading at around $427.60. The current price of Microsoft stock fluctuates in real-time trading on the Nasdaq stock exchange and can be checked through financial news platforms or brokerage websites.
The target price for Microsoft shares is currently estimated at $489 per share. However, this figure is subject to change in light of various factors and forecasts from leading analysts worldwide. Additionally, the value of MSFT is influenced by the company’s performance and development indicators.
Most analysts expect Microsoft’s stock price to rise to $489 – $492 in 2024. In addition, a bullish trend is also predicted for 2025–2030. According to various estimates, the price may reach $1,600.00 and higher.
According to expert estimates, the 52-week high and low are the levels of $468.35 and $307.70, respectively.
Analysts anticipate that MSFT will reach a price range of $822 – $953 by 2025. However, other experts project a more conservative outlook, with a share price range of $462 – $623.
Analysts offer varying projections for the value of Microsoft stock over an extended time horizon. Some forecasts suggest that the stock price will appreciate to $973 – $1667 by 2030.
The consensus forecast of 35 analysts on Microsoft shares gives a “Strong Buy” recommendation. This is supported by the company’s robust financial performance and its financial stability in the market.
Absolutely, yes. The long-term outlook for MSFT is bullish. An investment in Microsoft stock in 2024 may yield several times the return over a five-to-ten-year period.
Microsoft is traded under the symbol MSFT on the Nasdaq, where it is recognized as a leading technology stock.
The company’s next quarterly financial results report is due on July 29, 2024.
The company has a market capitalization of $3.24 trillion.
You can register a trading account with the LiteFinance online platform and open a long position in Microsoft shares.
Price chart of MSFT in real time mode

The content of this article reflects the author’s opinion and does not necessarily reflect the official position of LiteFinance. The material published on this page is provided for informational purposes only and should not be considered as the provision of investment advice for the purposes of Directive 2004/39/EC.
{{value}} ( {{count}} {{title}} )
This post is originally published on LITEFINANCE.


