
The Johnson & Johnson (JNJ) stock has long been a compelling asset thanks to the company’s stability, reliability, and upside potential. Despite short-term corrections and market volatility, J&J continues to hold a solid footing across the pharmaceutical, consumer, and healthcare sectors.
Fundamental and technical analysis will allow investors and traders to make more informed decisions regarding buying or selling stocks. Besides, this article reviews expert forecasts for the JNJ stock and provides a trading plan.
The article covers the following subjects:
Major Takeaways
- The current price of JNJ is $149.91 as of 09.04.2025.
- The JNJ price reached its all-time high of $186.01 on 25.04.2022. The stock’s all-time low of $0.78 was recorded on 26.05.1970.
- The company is actively investing in healthcare, personalized medicine, and biotechnology.
- JNJ pays dividends consistently and regularly increases their amount.
- The stock is expected to climb to $249–$314 by 2027.
- Technical indicators show a descending channel for 2025 with a range of $142–$162.
- JNJ’s market capitalization exceeds $369 billion, reflecting high investor confidence.
JNJ Real-Time Market Status
The JNJ stock is trading at $149.91 as of 09.04.2025.
To assess the Johnson & Johnson (JNJ) stock’s upside potential, investors should monitor its market capitalization, the price change over the year, and the P/E ratio. Dividend policy and EBITDA are also crucial indicators, reflecting the company’s financial strength and management efficiency in the long term.
|
Indicator |
Value |
|
Market cap |
$369.3 billion |
|
Shares outstanding |
2.41 billion |
|
Trading volume over the last 24 hours |
16.602 million |
|
Price change over the last 12 months |
+3.8% |
|
EBITDA |
+5.41 billion |
|
Dividends |
$4.96 (3.04% yield) |
|
P/E ratio |
26.5 |
JNJ Stock Price Forecast for 2025 Based on Technical Analysis
The JNJ price is trading within a strong descending channel. Recent fluctuations confirm the presence of strong resistance at the upper boundary of the channel near $169. The support level is located at $141–$143 near the lower boundary of the channel.
The RSI value of 38.69 indicates a moderate prevalence of bears, but it has not yet reached the oversold zone. The MACD shows a bearish crossover and decreasing histogram. Thus, the decline may continue in the near term. The EMA has crossed the SMA from above, suggesting that a downward momentum is intensifying.
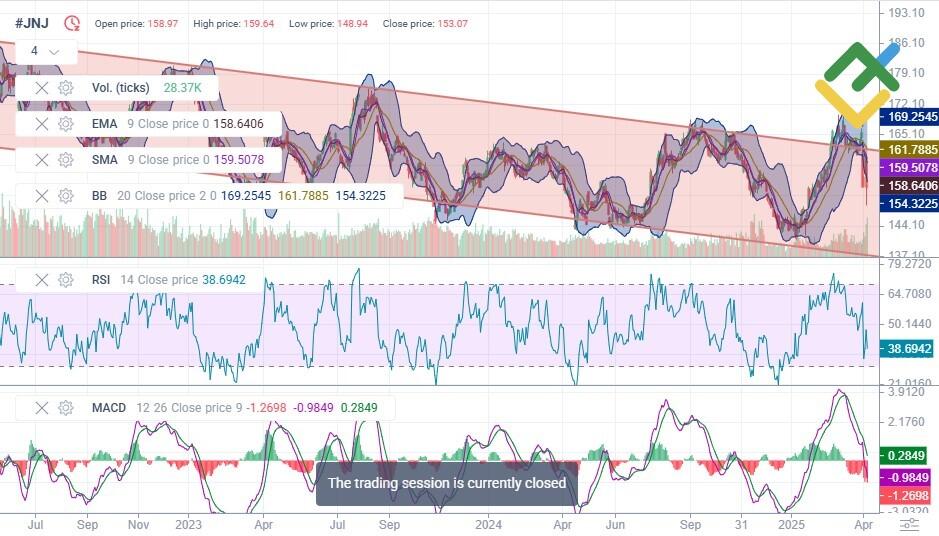
The forecast for the rest of the year suggests that JNJ shares will continue to trade within the descending channel, possibly falling to the lower boundary near $142–$145. However, upward corrections to $158–$162 are possible.
|
Month |
Minimum, $ |
Maximum, $ |
|
May |
150 |
158 |
|
June |
148 |
157 |
|
July |
145 |
154 |
|
August |
143 |
152 |
|
September |
142 |
150 |
|
October |
143 |
152 |
|
November |
144 |
155 |
|
December |
145 |
156 |
Long-Term Trading Plan for #JNJ for 2025
Given the current bearish trend, consider short trades when the price approaches the resistance of $158–$162. The targets are at the channel’s lower boundary of $142–$145.
Consider short trades during a pullback from the EMA and SMA ($158–$160), confirmed by the MACD bearish crossover and the RSI below 50.
When the price hits the channel’s lower boundary, consider small-volume long trades if reversal signals, such as the RSI divergence or MACD bullish crossover, appear.
Place stop-loss orders above $165–$168 for short trades and below $140 for long positions. This strategy aims to take advantage of price swings within the descending channel.
Analysts’ JNJ Shares Price Projections for 2025
Forecasts for Johnson & Johnson stocks in 2025 predict moderate price volatility. Let’s take a look at what analysts expect for JNJ’s performance.
StockScan
Price range: $138.1–$168.7 (as of 5.04.2025).
StockScan‘s forecast for 2025 indicates moderate fluctuations in the JNJ exchange rate. The highest price will be $168.7. By December, the price may drop to $146.4.
|
Month |
Average, $ |
Minimum, $ |
Maximum, $ |
|
May |
165.1 |
138.1 |
165.6 |
|
June |
163.1 |
156.9 |
168.7 |
|
July |
156.7 |
152.1 |
166.3 |
|
August |
155.2 |
149.7 |
157.1 |
|
September |
161.3 |
156.0 |
164.4 |
|
October |
161.3 |
159.1 |
168.2 |
|
November |
161.6 |
155.7 |
163.8 |
|
December |
149.9 |
146.4 |
165.9 |
Markettalkz
Price range: $197.33–$248.64 (as of 5.04.2025).
Analysts at Markettalkz are more optimistic about the JNJ stock’s prospects for 2025. They expect a significant rally to $248.64.
|
Year |
Minimum, $ |
Average, $ |
Maximum, $ |
|
2025 |
197.33 |
207.20 |
248.64 |
Coin Price Forecast
Price range: $154–$176 (as of 5.04.2025).
Coin Price Forecast predicts moderate gains for JNJ. The rate may climb to $176 by the end of the year.
|
Year |
Mid-Year, $ |
Year-End, $ |
|
2025 |
154 |
176 |
Analysts’ JNJ Shares Price Projections for 2026
Forecasts for Johnson & Johnson shares in 2026 also vary. Some analysts expect moderate appreciation, while others anticipate considerable increases.
StockScan
Price range: $150.3–$188.2 (as of 5.04.2025).
StockScan predicts a steady uptrend, with a high of $188.2. In June, the average price is expected to reach $174.1, ascending to $174.4 by December.
|
Month |
Average, $ |
Minimum, $ |
Maximum, $ |
|
January |
156.8 |
150.3 |
164.1 |
|
June |
174.1 |
170.9 |
179.9 |
|
December |
174.4 |
174.38 |
188.2 |
Markettalkz
Price range: $221.21–$278.72 (as of 5.04.2025).
Markettalkz anticipates that JNJ’s share price may appreciate significantly in 2026, with the highest price of $278.72. Such impressive growth can be attributed to the company’s success and favorable market conditions.
|
Year |
Minimum, $ |
Average, $ |
Maximum, $ |
|
2026 |
221.21 |
232.27 |
278.72 |
Coin Price Forecast
Price range: $185–$188 (as of 5.04.2025).
Coin Price Forecast predicts a modest uptick. By the end of the year, the stock may reach $188. No sharp fluctuations in the market are expected.
|
Year |
Mid-Year, $ |
Year-End, $ |
|
2026 |
185 |
188 |
Analysts’ JNJ Shares Price Projections for 2027
This section explores expert forecasts for the Johnson & Johnson (JNJ) stock in 2027. Although the forecasts are diverse, a positive trend is generally expected.
StockScan
Price range: $168.8–$199.8 (as of 5.04.2025).
StockScan‘s forecast indicates a surge to a high of $199.8 in August. The average price is expected to reach $178.5 in December.
|
Month |
Average, $ |
Minimum, $ |
Maximum, $ |
|
January |
176.7 |
170.3 |
178.1 |
|
June |
182.6 |
168.8 |
185.3 |
|
December |
178.5 |
178.3 |
192.2 |
Markettalkz
Price range: $249.53–$314.40 (as of 5.04.2025).
Markettalkz projects an increase in the JNJ price in 2027, driven by the company’s expansion in the Asian and Latin American markets. Stronger demand for consumer goods strengthens the company’s position.
|
Year |
Minimum, $ |
Average, $ |
Maximum, $ |
|
2027 |
249.53 |
262.00 |
314.40 |
Coin Price Forecast
Price range: $213–$220 (as of 5.04.2025).
According to Coin Price Forecast, the JNJ stock may soar to $220 by the end of the year, bolstered by global market conditions and the company’s efforts to expand its influence.
|
Year |
Mid-Year, $ |
Year-End, $ |
|
2027 |
213 |
220 |
Analysts’ JNJ Shares Price Projections for 2028
This section presents forecasts for JNJ shares in 2028. Analysts from various platforms expect the stock price to increase amid the adoption of new technologies like artificial intelligence and expansion into new markets.
StockScan
Price range: $169.7–$194.2 (as of 5.04.2025).
StockScan‘s forecast suggests the JNJ stock will ascend, with the highest price of $194.2. The average price is expected to be around $178.9 in December.
|
Month |
Average, $ |
Minimum, $ |
Maximum, $ |
|
January |
175.9 |
174.5 |
183.3 |
|
June |
182.0 |
180.8 |
194.2 |
|
December |
178.9 |
169.7 |
179.6 |
Markettalkz
Price range: $283.22–$356.84 (as of 5.04.2025).
Markettalkz anticipates that JNJ will post solid gains in 2028, buoyed by the introduction of advanced technologies in healthcare, enhancing the company’s efficiency.
|
Year |
Minimum, $ |
Average, $ |
Maximum, $ |
|
2028 |
283.22 |
297.37 |
356.84 |
Coin Price Forecast
Price range: $220–$220 (as of 5.04.2025).
Coin Price Forecast predicts that Johnson & Johnson’s share price will remain at $220 in 2028, with no sharp fluctuations expected. The JNJ stock will continue to be popular among investors.
|
Year |
Mid-Year, $ |
Year-End, $ |
|
2028 |
220 |
220 |
Analysts’ JNJ Shares Price Projections for 2029
Forecasts for Johnson & Johnson’s share price in 2029 are mixed. Most experts anticipate the JNJ value to strengthen, while others expect it to plummet.
StockScan
Price range: $158.1–$188.7 (as of 5.04.2025).
According to StockScan, Johnson & Johnson’s average share price will be $173. In December, the rate may reach $163.6.
|
Month |
Average, $ |
Minimum, $ |
Maximum, $ |
|
January |
180.9 |
170.7 |
188.7 |
|
June |
171.8 |
160.1 |
171.9 |
|
December |
163.6 |
158.1 |
167.0 |
Markettalkz
Price range: $323.44–$407.51 (as of 5.04.2025).
According to Markettalkz, Johnson & Johnson’s stock is expected to climb in 2029, supported by progress in personalized medicine, especially in cancer treatment. The company is developing targeted therapies based on genetic profiles, strengthening its market position and boosting profitability.
|
Year |
Minimum, $ |
Average, $ |
Maximum, $ |
|
2029 |
323.44 |
339.59 |
407.51 |
Coin Price Forecast
Price range: $224–$233 (as of 5.04.2025).
Coin Price Forecast assumes the JNJ price will soar to $233 in 2029. This outlook reflects confidence in the company’s stability and sustainability amid growing global demand for its products.
|
Year |
Mid-Year, $ |
Year-End, $ |
|
2029 |
224 |
233 |
Analysts’ JNJ Shares Price Projections for 2030
Forecasts for Johnson & Johnson shares in 2030 vary, with some experts anticipating moderate gains and others predicting a slight decline.
StockScan
Price range: $134.4–$179.5 (as of 5.04.2025).
StockScan estimates that JNJ will slightly depreciate in 2030, with an average price of $157.4 in December and a high of $179.5 in October.
|
Month |
Average, $ |
Minimum, $ |
Maximum, $ |
|
January |
165.3 |
153.4 |
167.5 |
|
June |
153.6 |
151.2 |
162.6 |
|
December |
157.4 |
134.4 |
162.0 |
Markettalkz
Price range: $371.31–$467.82 (as of 5.04.2025).
Markettalkz anticipates Johnson & Johnson’s stock to surge to $467.82, bolstered by innovations in immunotherapy.
|
Year |
Minimum, $ |
Average, $ |
Maximum, $ |
|
2030 |
371.31 |
389.85 |
467.82 |
Coin Price Forecast
Price range: $246–$263 (as of 5.04.2025).
Coin Price Forecast suggests that Johnson & Johnson shares may rise to $263 in 2030. This prediction reflects confidence in the company’s resilience and its progress in research and commercial initiatives.
|
Year |
Mid-Year, $ |
Year-End, $ |
|
2030 |
246 |
263 |
Analysts’ JNJ Shares Price Projections until 2050
Long-term forecasts for the JNJ stock are different. According to StockScan, the price may reach $167.5 by 2030, $207.2 by 2040, and $242.4 by 2050. This moderate increase will be attributed to the company’s robust market position and financial performance.
Markettalkz predicts that the JNJ stock price may skyrocket to $5,800 by 2050 if the company strengthens its position by introducing innovations and entering new markets.
Coin Price Forecast also predicts a jump to $321 by 2035.
|
Year |
StockScan, $ |
Markettalkz, $ |
Coin Price Forecast, $ |
|
2030 |
167.5 |
389.85 |
263 |
|
2035 |
– |
703.65 |
321 |
|
2040 |
207.2 |
1,173.95 |
– |
|
2050 |
242.4 |
5,800.00 |
– |
In the long term, Johnson & Johnson shares will continue to appreciate. The company is projected to expand into new markets and broaden its product line. However, correction periods should also be taken into account.
Market Sentiment for JNJ (Johnson & Johnson) on Social Media
Media sentiment is a crucial factor in gauging market sentiment for the Johnson & Johnson (JNJ) stock. Investors monitor social media discussions to understand how others feel about the asset and adjust their portfolios accordingly.
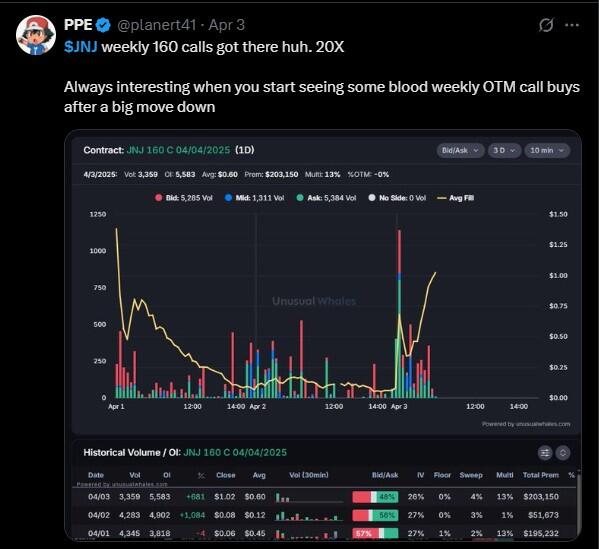
For example, user @planert41 observes a notable uptick in demand for call options, signaling positive expectations and anticipated growth for JNJ after the decline.
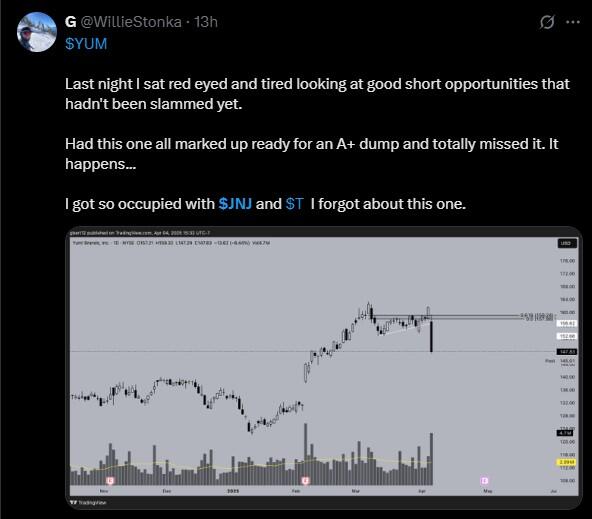
At the same time, @WillieStonka expects a short-term reduction, which may create opportunities to open short trades.
Thus, the current social media sentiment demonstrates market uncertainty. Cautious optimism regarding the future of JNJ prevails.
JNJ Price History
Johnson & Johnson (JNJ) reached its all-time high of $186.01 on 25.04.2022.
The lowest price of Johnson & Johnson (JNJ) was recorded on 26.05.1970 when the stock declined to $0.78.
It is crucial to evaluate historical data to make our forecasts as accurate as possible.
Johnson & Johnson (JNJ) shares have been traded on the stock exchange since 1944 and have steadily increased in value thanks to the company’s innovations in pharmaceuticals and healthcare. Moreover, the price was influenced by successful clinical trials of new drugs and major acquisitions expanding the company’s product portfolio.
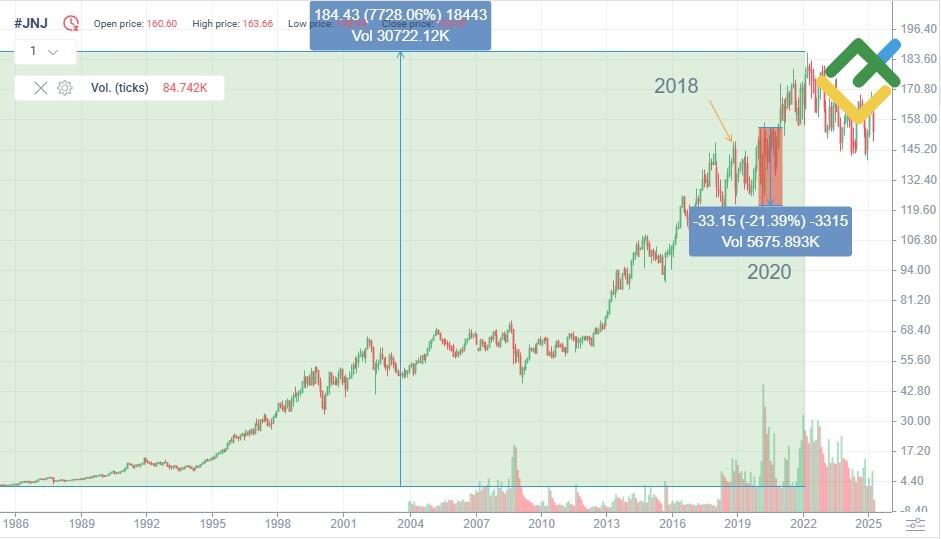
However, JNJ’s history has also been marked by sharp falls. For instance, in December 2018, the stock plunged by 10% due to the scandal surrounding asbestos in baby powder, which triggered a wave of lawsuits. In 2020, the COVID-19 pandemic caused a 20% drop amid global uncertainty. Despite these challenges, the company has quickly regained ground through successful vaccine development.
JNJ Shares Fundamental Analysis
Fundamental analysis of Johnson & Johnson (JNJ) helps determine factors that affect the stock price.
What Factors Affect the JNJ stock?
Johnson & Johnson’s stock price is influenced by the following factors:
- Financial reports: quarterly and annual reports reflecting profit, revenue, and debt load.
- Dividend policy of the company.
- Regulatory changes: approval or prohibition of new drugs, changes in legal requirements.
- Litigation: results of major lawsuits, such as the talcum powder or opioid cases.
- Competition: successes of competitors that may affect investor preferences.
- Macroeconomic conditions: changes in interest rates, inflation, and economic growth.
- Strategic acquisitions: purchasing other companies and integrating new products.
More Facts About JNJ
The Johnson & Johnson (JNJ) company was founded in 1886 in the US by brothers Robert, James, and Edward Johnson. Initially, the company specialized in the production of sterile medical dressings. Today, JNJ is one of the world’s largest corporations in the healthcare industry.
The company operates across three main segments: pharmaceuticals, medical devices, and consumer products. Its popular products include Band-Aid bandages, Tylenol medications, and personal care products from Neutrogena and Johnson’s Baby.
The JNJ stock is included in the Dow Jones Index and is considered one of the most stable and attractive assets for long-term investors due to its regular dividend payouts and strong financial position.
Advantages and Disadvantages of Investing in JNJ
Investing in Johnson & Johnson (JNJ) stocks has a number of advantages. However, there are also certain risks.
Advantages
- Consistent dividend payouts and the company’s dividend aristocrat status make the stock appealing to long-term investors seeking a steady income.
- A diversified business structure covering the pharmaceutical, consumer products, and medical devices markets mitigates the risks of significant price fluctuations.
- JNJ’s worldwide brand recognition, along with its established reputation for reliability and top-notch quality, strengthens the trust of consumers and investors.
- The company is actively investing in innovative medical developments and biotechnology, offering new prospects for long-term growth.
- Rapid expansion into Asian and Latin American markets, where the burgeoning middle class is fuelling demand for products, boosting the company’s profits.
Disadvantages
- The company faces lawsuits related to product safety, negatively affecting its reputation.
- The intense competition in the market demands ongoing investment in marketing and research to uphold the company’s position.
- Changes in healthcare regulation, new legislative initiatives, and government policies may adversely affect the company’s sales and earnings.
- Inflationary pressures and rising operating costs are eroding margins in the consumer goods segment.
- High expenses and unpredictable outcomes of clinical trials for new medicines pose additional risks to the company’s financial performance.
Considering the pros and cons, the JNJ stock remains a promising investment, particularly for conservative investors.
How We Make Forecasts
We use a comprehensive approach to forecast JNJ’s future stock price.
Short-term forecasts are based on technical analysis: current market trends, volatility, as well as support and resistance levels are studied.
Medium-term forecasts rely on fundamental analysis involving the company’s financial reports, new products, and market trends.
Long-term forecasts take into account global macroeconomic trends, the company’s strategy, its market position, and the general state of the industry. Besides, the opinions of leading analysts and market sentiment are considered.
Conclusion: Is JNJ a Good Investment?
Johnson & Johnson remains a robust and attractive asset due to the company’s diversified product portfolio, consistent dividends, and solid reputation in the healthcare market. While there are potential challenges such as lawsuits and fierce competition, the company’s long-term outlook remains promising, driven by innovative advancements and expansion into emerging markets.
JNJ is suitable for conservative investors prioritizing stable income and moderate capital growth.
JNJ Price Prediction FAQ’s
The current JNJ stock price is $149.91 as of 09.04.2025.
JNJ shares continue to attract long-term investors due to their consistent dividends and robust market presence. However, investors should be mindful of potential short-term volatility, which can stem from ongoing lawsuits. Therefore, it is better to buy the stock during corrections or after the release of positive news about the company.
Analysts believe JNJ’s price will range between $138 and $248 in 2025. The forecasts reflect moderate optimism about the company’s prospects amid product line expansion and innovations in healthcare.
Analysts expect the JNJ stock to climb to $150–$279 in 2026. The average price will reach $188, bolstered by new product launches, international market revenue growth, and the company’s ongoing business diversification.
In five years, JNJ shares may trade between $167 and $467, according to expert estimates. These expectations are driven by the company’s innovations in personalized medicine, healthcare market expansion, and strong financial position despite the existing litigation risks.
The JNJ exchange rate will range from $167 to $467 by 2030. The average expected price will reach $263, provided that innovative medical technologies are realized and international markets develop steadily.
The JNJ stock is an excellent long-term investment due to its stable financial history, regular dividend payments, and continued innovation in the pharmaceutical and medical sectors. The company is growing steadily and is resilient to economic fluctuations.
The future of Johnson & Johnson looks promising, especially in the areas of personalized medicine, biotechnology, and digital health. Active expansion in international markets and business sustainability will ensure the company’s long-term development and stable financial performance.
J&J’s main risks involve ongoing litigation, strict regulatory requirements, and increasing competition in the pharmaceutical market. Additionally, changes in the government healthcare policy and the state of the global economy may significantly affect the price.
JNJ is a great dividend asset. The company has consistently increased shareholder payouts for more than 60 consecutive years. Johnson & Johnson has a high financial strength rating, making its stock a perfect choice for investors focused on passive income.
Price chart of JNJ in real time mode

The content of this article reflects the author’s opinion and does not necessarily reflect the official position of LiteFinance broker. The material published on this page is provided for informational purposes only and should not be considered as the provision of investment advice for the purposes of Directive 2014/65/EU.
According to copyright law, this article is considered intellectual property, which includes a prohibition on copying and distributing it without consent.
{{value}} ( {{count}} {{title}} )
This post is originally published on LITEFINANCE.


