
International Business Machines Corporation, or IBM, is a US-based tech behemoth with a focus on automation, hybrid cloud, and artificial intelligence (AI) solutions. The company is heavily engaged in the development of quantum computing and enterprise IT solutions, which supports its market position.
IBM stock attracts investors with its consistent dividend payments and investments in innovation. However, fierce competition from Microsoft, Amazon, and Google may limit the company’s growth.
This article examines IBM price forecasts, as well as fundamental and technical analysis, and market sentiment. It analyzes whether IBM is a promising long-term investment avenue and what factors could affect the company’s value.
The article covers the following subjects:
Major Takeaways
- The current price of IBM is $254.64 as of 12.02.2025.
- The IBM price reached its all-time high of $264.81 on 2025-02-05. The stock’s all-time low of $9.08 was recorded on 1974-09-13.
- IBM boasts a consistent 25-year track record of dividend payments.
- Key businesses: cloud technologies, artificial intelligence, and cybersecurity.
- Key rivals: Microsoft, Google, Amazon, and Oracle.
IBM Real-Time Market Status
The IBM stock is trading at $254.64 as of 12.02.2025.
When analyzing IBM stock, it is important to track its market capitalization, which reflects the company’s overall value. The year-over-year price change helps determine the prevailing trend, while the highs and lows provide insight into the stock’s volatility. It is also essential to consider the number of shares outstanding and the dividend yield, which attracts long-term investors.
| Metric | Value |
| Market capitalization | $233.3 billion |
| All-time high | $264.81 |
| All-time low | $9.08 |
| Shares outstanding | 921.04 million |
| Dividend yield | 2.6% |
IBM Stock Price Forecast for 2025 Based on Technical Analysis
On the weekly time frame, the #IBM stock is showcasing a strong bullish trend. The price has violated the upper boundary of the ascending channel. However, it is undergoing a downward correction. Technical indicators confirm that the trading instrument is extremely overbought, signaling a deeper correction in the coming weeks.

The RSI is at the level of 66, approaching the overbought zone, suggesting that the bullish momentum is fading and a downward correction may start, followed by growth.
The MACD indicator shows a divergence of lines: the MACD line (11.40) is above the signal line (9.62), confirming the ongoing upward trend is waning.

The SMA ($230.10) and the EMA ($235.12) are below the current price ($252.05), indicating strong bullish momentum. At the same time, the moving averages offer a support zone.
The Bollinger Bands indicator shows that the price has breached the upper band, which is often a robust sign of an impending correction. If the price consolidates below the Bollinger Band of $252.20, the IBM rate will likely pull back to the support level of $214.9.
The following table provides an overview of trading instrument’s projected highs and lows for the next 10 months.
| Month | Minimum, $ | Maximum, $ |
| March | 235 | 265 |
| April | 220 | 255 |
| May | 214 | 248 |
| June | 198 | 235 |
| July | 182 | 220 |
| August | 190 | 230 |
| September | 195 | 245 |
| October | 205 | 250 |
| November | 215 | 255 |
| December | 225 | 265 |
Long-Term Trading Plan for IBM (#IBM)
In 2025, #IBM stock maintains a bullish trend, but a correction is possible after the price has breached the upper boundary of the ascending channel. Potential entry points are near the support levels of $214.9, $198, and $182.
The base case scenario assumes opening long positions on pullbacks, confirming trend reversals using candlestick patterns, tick volume, and MACD divergence. The EMA ($235.12) and the SMA ($230.10) can act as dynamic support levels.
If the IBM rate exceeds $252 without a pullback, the bullish momentum will be reinforced. If the price settles above $265, growth will continue towards $275–$280.
A stop-loss order can be placed below $180 to hedge the risk, and a take-profit order can be set at $245–$260, depending on the market situation.
Analysts’ IBM Shares Price Projections for 2025
Experts differ in their forecasts for 2025: some predict growth, while others foresee wide price fluctuations. The stock’s performance will depend on the company’s tech breakthroughs and the demand for cloud solutions.
Markettalkz
Price range in 2025: $211.40–$271.00 (as of 08.02.2025).
Analysts at Markettalkz predict that the IBM stock will trade between $211.40 and $271.00 in 2025. The expected growth will be driven by an increase in corporate contracts and the introduction of new technologies.
| Year | Minimum, $ | Average, $ | Maximum, $ |
| 2025 | 211.40 | 225.77 | 271.00 |
Coin Price Forecast
Price range in 2025: $290–$306 (as of 08.02.2025).
According to Coin Price Forecast, IBM shares may reach $290 in mid-2025 and $306 by the year-end. This upside potential is explained by the increase in the company’s revenues generated from cloud services and AI solutions.
| Year | Mid-Year, $ | Year-End, $ |
| 2025 | 290 | 306 |
StockScan
Price range in 2025: $121.1–$189.1 (as of 08.02.2025).
StockScan predicts that the IBM stock will show moderate volatility in 2025. The average price will fluctuate between $141.2 and $157.5, while a yearly high is expected to be around $189.1. At the same time, the price may correct to $121.1. This wide range is due to market volatility and potential macroeconomic risks.
| Month | Average, $ | Minimum, $ | Maximum, $ |
| March | 157.5 | 156.8 | 189.1 |
| April | 141.2 | 121.1 | 166.6 |
| May | 151.5 | 135.1 | 155.8 |
| June | 147.7 | 142.5 | 160.0 |
| July | 153.3 | 148.4 | 166.7 |
| August | 149.3 | 146.1 | 153.8 |
| September | 156.0 | 148.9 | 163.1 |
| October | 153.4 | 152.4 | 161.5 |
| November | 152.9 | 147.7 | 157.0 |
| December | 143.0 | 137.2 | 166.8 |
Analysts’ IBM Shares Price Projections for 2026
Analysts suggest that the IBM rate will increase in 2026 due to the company’s technological breakthroughs. The development of edge computing, 5G, and blockchain solutions may boost the stock’s value.
Markettalkz
Price range in 2026: $236.77–$303.50 (as of 08.02.2025).
According to Markettalkz, IBM’s investment in advanced technology could drive the stock higher. The price is expected to trade between $236.77 and $303.50. The company is expanding its efforts to leverage AI and machine learning solutions, making it a promising long-term investment.
| Year | Minimum, $ | Average, $ | Maximum, $ |
| 2026 | 236.77 | 252.86 | 303.50 |
Coin Price Forecast
Price range in 2026: $315–$382 (as of 08.02.2025).
Coin Price Forecast is more optimistic about IBM’s growth potential. The stock could reach $315 by mid-2026 and $382 by the year-end. The company’s innovations in artificial intelligence, cloud computing, and enterprise solutions will likely continue to drive growth.
| Year | Mid-Year, $ | Year-End, $ |
| 2026 | 315 | 382 |
StockScan
Price range in 2026: $142.5–$184.9 (as of 08.02.2025).
StockScan expects the price of IBM will exhibit elevated volatility in 2026. The average price will range between $155.8 and $183.4, retaining an upside potential by the end of the year. Market fluctuations are possible due to macroeconomic factors and broader market trends.
| Month | Average, $ | Minimum, $ | Maximum, $ |
| January | 155.8 | 142.5 | 156.7 |
| February | 157.5 | 153.9 | 159.2 |
| March | 160.0 | 153.2 | 163.4 |
| April | 150.7 | 149.0 | 163.9 |
| May | 160.7 | 150.2 | 162.8 |
| June | 167.5 | 159.7 | 168.9 |
| July | 176.7 | 162.3 | 180.7 |
| August | 183.4 | 172.9 | 184.9 |
| September | 173.7 | 169.3 | 183.1 |
| October | 176.3 | 168.4 | 177.1 |
| November | 172.7 | 169.5 | 176.1 |
| December | 171.3 | 165.2 | 173.0 |
Analysts’ IBM Shares Price Projections for 2027
IBM is expected to continue expanding its technology solutions, which could boost the company’s shares in 2027. Key growth drivers will be quantum computing technology, cybersecurity development, and hybrid cloud solutions. However, increased market volatility and macroeconomic factors could hinder growth.
Markettalkz
Price range in 2027: $265.18–$340.00 (as of 08.02.2025).
Markettalkz assumes that IBM will see pivotal changes in 2027 due to the commercialization of quantum computing and a more solid foothold in the cybersecurity sector. The stock may surge as high as $340.00, with an average target price of $283.20.
| Year | Minimum, $ | Average, $ | Maximum, $ |
| 2027 | 265.18 | 283.20 | 340.00 |
Coin Price Forecast
Price range in 2027: $405–$411 (as of 08.02.2025).
Coin Price Forecast expects that the IBM rate will reach a high of $411 by the end of 2027. Such an optimistic forecast hinges on the expansion of IBM’s cloud ecosystem and increased demand for its services.
| Year | Mid-Year, $ | Year-End, $ |
| 2027 | 405 | 411 |
StockScan
Price range in 2027: $147.2–$178.5 (as of 08.02.2025).
StockScan predicts that IBM shares will face high volatility in 2027, fluctuating widely between $159.2 and $178.5 in January. In December, the price will trade between $158.7 and $175.4. Meanwhile, the stock may decline throughout the year, but the long-term trend will remain bullish. Possible corrections are not ruled out due to tech sector shifts and evolving economic conditions.
| Month | Average, $ | Minimum, $ | Maximum, $ |
| January | 160.5 | 159.2 | 178.5 |
| February | 148.7 | 147.9 | 161.2 |
| March | 160.2 | 147.2 | 161.4 |
| April | 167.0 | 157.5 | 175.0 |
| May | 170.1 | 157.1 | 171.7 |
| June | 159.7 | 151.8 | 171.3 |
| July | 163.1 | 155.8 | 166.2 |
| August | 171.5 | 158.1 | 175.1 |
| September | 172.6 | 159.1 | 173.1 |
| October | 168.4 | 166.3 | 178.1 |
| November | 174.0 | 168.8 | 177.6 |
| December | 167.6 | 158.7 | 175.4 |
Analysts’ IBM Shares Price Projections for 2028
IBM is projected to drive innovation, and 2028 could be a significant year with the use of AI in medicine and investments in green technology.
Markettalkz
Price range in 2028: $297.00–$381.00 (as of 08.02.2025).
Markettalkz suggests that IBM’s average value will rise to $317.18 in 2028. Developing AI solutions in healthcare and moving into green technology could attract new investors, which would push the stock price higher.
| Year | Minimum, $ | Average, $ | Maximum, $ |
| 2028 | 297.00 | 317.18 | 381.00 |
Coin Price Forecast
Price range in 2028: $464–$516 (as of 08.02.2025).
Coin Price Forecast gives the most optimistic forecast. IBM’s price will reach $464 by mid-2028. Sustainable growth can be attributed to the expansion of cloud infrastructure and the adoption of AI solutions in the corporate sector.
| Year | Mid-Year, $ | Year-End, $ |
| 2028 | 464 | 516 |
StockScan
Price range in 2028: $149.4–$187.3 (as of 08.02.2025).
StockScan predicts that IBM shares will experience high volatility throughout 2028. The average price will range from $161.5 to $182.3. Volatility can be attributed to fluctuations in demand, macroeconomic risks, and the evolving technology sector.
| Month | Average, $ | Minimum, $ | Maximum, $ |
| January | 161.5 | 160.9 | 173.0 |
| February | 152.6 | 152.4 | 164.7 |
| March | 172.2 | 149.4 | 172.7 |
| April | 182.3 | 167.9 | 184.4 |
| May | 175.7 | 171.3 | 187.3 |
| June | 175.4 | 173.6 | 181.4 |
| July | 169.9 | 167.0 | 177.2 |
| August | 159.8 | 159.5 | 171.7 |
| September | 165.0 | 156.1 | 167.1 |
| October | 158.2 | 156.3 | 165.6 |
| November | 167.1 | 155.1 | 167.8 |
| December | 168.5 | 163.9 | 174.2 |
Analysts’ IBM Shares Price Projections for 2029
Quantum computing represents a significant opportunity for IBM to enter a new phase of growth, with applications in fields such as finance, medicine, and data analytics. The increased use of artificial intelligence and automation has the potential to enhance the stock’s value and strengthen the company’s foothold in the global market.
Markettalkz
Price range in 2029: $332.64–$426.50 (as of 08.02.2025).
Markettalkz expects that IBM will reach an average price of $355.24 in 2029. This projected uptick is driven by the growth in smart cities, robotics, and autonomous systems, which are creating new market opportunities for IBM and attracting investors.
| Year | Minimum, $ | Average, $ | Maximum, $ |
| 2029 | 332.64 | 355.24 | 426.50 |
Coin Price Forecast
Price range in 2029: $521–$568 (as of 08.02.2025).
Coin Price Forecast predicts a substantial increase in the value of IBM shares, with a projected reach of $568 by the end of 2029. Key growth drivers are the development of AI solutions, quantum computing, and analytical platforms, which IBM is actively implementing in the corporate sector.
| Year | Mid-Year, $ | Year-End, $ |
| 2029 | 521 | 568 |
StockScan
Price range in 2029: $166.3–$234.9 (as of 08.02.2025).
According to StockScan‘s predictions, the IBM market is likely to experience increased volatility during 2029, with an average price range of $179.0 to $226.5. Significant price corrections are not ruled out in the first half of the year, while sustained growth is driven by innovation and corporate contracts.
| Month | Average, $ | Minimum, $ | Maximum, $ |
| January | 179.0 | 166.3 | 179.5 |
| February | 180.3 | 174.7 | 181.4 |
| March | 181.0 | 180.2 | 184.0 |
| April | 173.6 | 173.4 | 187.0 |
| May | 184.2 | 171.0 | 184.9 |
| June | 195.9 | 182.6 | 195.9 |
| July | 198.9 | 194.9 | 201.7 |
| August | 219.2 | 193.3 | 232.4 |
| September | 221.3 | 214.3 | 224.5 |
| October | 226.5 | 218.2 | 234.9 |
| November | 217.4 | 216.0 | 229.0 |
| December | 193.9 | 191.3 | 220.5 |
Analysts’ IBM Shares Price Projections for 2030
By 2030, IBM plans to make significant advancements in quantum computing, neuromorphic engineering, and cloud technologies. The company aims to leverage its expertise in these fields to contribute to global challenges, such as climate change, while also providing cutting-edge solutions to various industries.
Markettalkz
Price range in 2030: $372.56–$477.50 (as of 08.02.2025).
According to Markettalkz, IBM’s average price target is expected to be $397.87. However, competition with other major technology companies continues to present a significant risk factor.
| Year | Minimum, $ | Average, $ | Maximum, $ |
| 2030 | 372.56 | 397.87 | 477.50 |
Coin Price Forecast
Price range in 2030: $571–$579 (as of 08.02.2025).
Coin Price Forecast predicts significant growth. The share price is expected to reach $579 by the end of the year. Experts believe that IBM’s latest developments will attract investors, which will push the share price higher.
| Year | Mid-Year, $ | Year-End, $ |
| 2030 | 571 | 579 |
StockScan
Price range in 2030: $166.3–$234.9 (as of 08.02.2025).
StockScan analysts project the average share price to range between $194.6 and $211.1. While there is a possibility of dips to $164.9 in November, the asset is poised for a long-term recovery. Current technical indicators suggest a sense of uncertainty regarding market sentiment.
| Month | Average, $ | Minimum, $ | Maximum, $ |
| January | 194.6 | 185.9 | 196.0 |
| February | 201.9 | 193.6 | 202.2 |
| March | 207.0 | 201.0 | 212.3 |
| April | 195.1 | 188.5 | 212.5 |
| May | 205.4 | 193.0 | 206.4 |
| June | 195.5 | 190.9 | 206.9 |
| July | 194.5 | 193.0 | 199.3 |
| August | 196.3 | 191.0 | 196.8 |
| September | 197.1 | 193.0 | 198.5 |
| October | 211.1 | 195.7 | 219.5 |
| November | 164.9 | 161.8 | 215.4 |
| December | 166.5 | 151.6 | 174.9 |
Analysts’ IBM Shares Price Projections until 2050
Analysts project that IBM shares will appreciate significantly in the long term due to the development of quantum computing, artificial intelligence, and cloud solutions, positioning the company to strengthen its foothold in the corporate sector over the next few decades.
According to Markettalkz, IBM shares are projected to reach $701.16 by 2035 and potentially exceed $1,235.67 by 2040. The primary catalyst for this growth will be the introduction of advanced computing technologies and the expansion of the AI solutions ecosystem. By 2050, the projected price is estimated to reach $4,600.00.
StockScan offers more conservative forecasts, with a projected stock price of $225.7 by 2035 and $236.0 by 2040. Long-term risks such as competition, regulation, and potential economic crises are factors to be considered.
| Year | Markettalkz (average), $ | StockScan (average), $ |
| 2030 | 397.87 | 196.0 |
| 2035 | 701.16 | 225.7 |
| 2040 | 1,235.67 | 236.0 |
| 2050 | 4,600.00 | 294.3 |
Current forecasts indicate that IBM will experience significant growth by 2050. However, StockScan’s moderate estimates point to market fluctuations, which should be considered. Investors are advised to carefully assess the risks involved and keep an eye on technological trends when making long-term investment decisions.
Market Sentiment for IBM on Social Media
Social media has a significant impact on the stock market, particularly for major corporations such as IBM. Investors engage in active discussions about the company’s prospects, analyze reports, and evaluate its competitive advantages. Social media sentiment can be a barometer of market sentiment, ranging from optimistic forecasts to pessimistic assessments.
Analysts’ opinions about IBM’s prospects are varied. Some are discussing the company’s competitive advantages in quantum technologies, indicating positive expectations for the stock.

Other analysts evaluate the company’s financial performance, noting that IBM’s real earnings remain stable but do not demonstrate rapid growth.

The sentiment surrounding IBM is moderately positive. The company is widely regarded as a leader in quantum technologies and cloud solutions. However, its financial performance has prompted questions. Long-term investors are likely to continue monitoring IBM’s development and evaluating its growth potential.
IBM Price History
IBM reached its all-time high of $264.81 on 2025-02-05.
The lowest price of IBM was recorded on 1974-09-13 when the stock declined to 9.08.
Below is a chart showing the performance of IBM over the last ten years. In this connection, it is important to evaluate historical data to make predictions as accurate as possible.
IBM’s stock price has undergone significant changes over the past 50 years. In the 1970s, the company experienced steady growth due to its leading role in mainframe development. IBM’s stock reached new heights in the 1980s but began to decline in the early 1990s due to growing competition from other IT companies such as Microsoft and Intel.
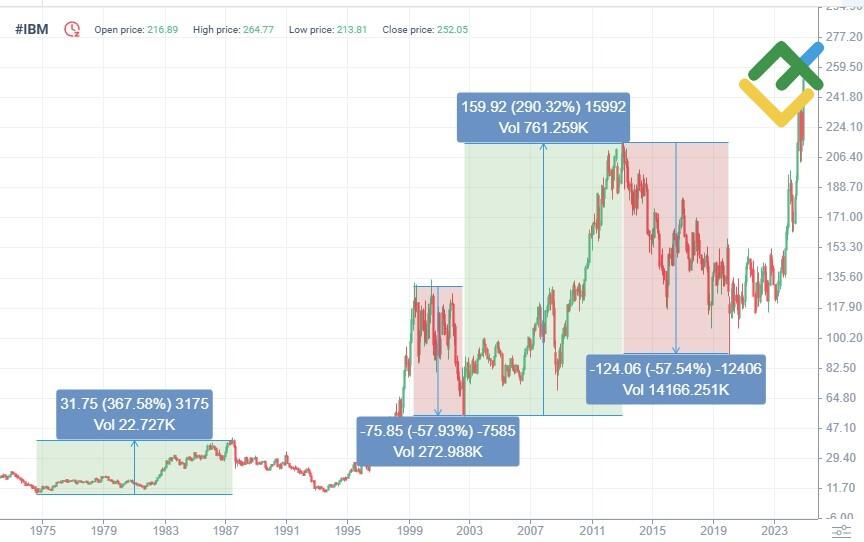
By the late 1990s, IBM had shifted its focus back to software and IT services, a strategic move that helped the company regain its competitive position. This shift in focus led to steady growth throughout the 2000s, with the stock price reaching over $200 in 2013. However, the company encountered challenges in its transition to cloud computing, resulting in a decline in stock value.
In recent years, IBM has diversified its portfolio to include quantum computing, AI technologies, and hybrid cloud solutions. Despite the company’s challenges, it maintains its position as one of the leading IT corporations, consistently attracting long-term investors.
IBM Shares Fundamental Analysis
A fundamental analysis of IBM can provide valuable insights into the company’s financial stability and growth prospects. The share price is influenced by various factors, including business profitability, competitive environment, and technological innovations. IBM’s strategic investments in quantum computing, artificial intelligence, and cloud technologies indicate its commitment to long-term growth and potential. Investors should carefully consider financial statements, dividend policy, and macroeconomic conditions when assessing IBM’s investment prospects.
What Factors Affect the IBM Stock?
- Financial performance. Revenues and earnings growth, along with robust quarterly reports, are key drivers of investor interest.
- Dividends. IBM’s consistent dividend payments make it an attractive option for long-term investors.
- Technology breakthroughs. Investments in quantum computing, artificial intelligence, and cloud solutions are fueling the company’s growth potential.
- Competitive landscape. IBM competes with major players like Microsoft, Amazon, and Google, impacting its market share and earnings potential.
- Macroeconomic factors. Inflation, interest rate changes, and economic turbulence can influence stock price volatility.
- Market demand. Influenced by both institutional and retail investors, market demand shapes the liquidity of IBM shares.
- Regulatory risks. These include antitrust investigations, changes in tax policy, and industry regulation, which may impact IBM’s share price.
- Global digitalization, marked by an increased demand for cloud technology and IT services, supports IBM’s growth.
- Mergers and acquisitions can enhance the company’s competitive advantage and capitalization.
- Geopolitical factors, such as sanctions, trade wars, and global market instability, can affect IBM’s growth.
More Facts About IBM
IBM (International Business Machines Corporation) is one of the world’s leading technology companies. Founded in 1911 as Computing-Tabulating-Recording Company (CTR), it was renamed IBM in 1924.
IBM focuses on the development of hardware and software, cloud solutions, artificial intelligence, and quantum computing. The company is engaged in machine learning, data analytics, and cybersecurity technologies.
IBM provides IT solutions for businesses, financial institutions, government organizations, and medical facilities. Its cloud services compete with industry leaders such as Amazon Web Services and Microsoft Azure.
Advantages and Disadvantages of Investing in IBM
IBM shares attract long-term investors. The company is a technology heavyweight with a long history and solid market position. However, despite its strengths, the IBM stock has its pitfalls as well.
Advantages
- IBM has a stable dividend with a high yield, which attracts investors focused on generating passive income. The payout has grown steadily in recent years.
- The company is a leader in enterprise IT solutions, providing a wide range of business solutions in cloud, AI, and quantum computing.
- It has a strong position in the B2B segment, serving the world’s largest companies and government agencies and ensuring high demand for its services.
- IBM invests heavily in innovative technologies such as quantum computing, cloud services, artificial intelligence, and blockchain technologies, creating new business opportunities.
- The company has a large market cap and stable cash flow, which allows it to withstand economic crises.
Disadvantages
- The company’s stock price growth has lagged behind its competitors, such as Microsoft and Amazon, despite its technological advancements.
- IBM faces strong competition in the cloud and AI markets from major players like Microsoft, Amazon, and Google, which may constrain the stock’s growth potential.
- The company’s focus on corporate customers rather than the mass market has led to a limited customer base.
- The company has encountered difficulties in modifying its business model, which has led to a decline in its market share in key sectors due to its inability to adapt to new market trends swiftly.
- IBM’s substantial debt burden, resulting from significant investments and acquisitions, may constrain future growth potential.
IBM remains a good buy for long-term investors focused on dividend income. However, the stock’s growth potential is limited, and the company faces serious competition. For conservative investors, it may be an excellent choice, but those looking for high returns should consider other options.
How We Make Forecasts
We employ a comprehensive approach to analyzing and forecasting IBM’s price.
1. Short-term forecasts.
- Technical analysis utilizes the following indicators: the RSI, MACD, Bollinger Bands, and moving averages.
- Market news, earnings reports, and corporate events are considered.
- Social media sentiment is estimated.
2. Medium-term forecasts.
- Fundamental analysis involves a thorough examination of the company’s financial statements, revenues, profitability, and debt load.
- Macroeconomic factors, such as inflation and interest rates, are taken into account.
- The forecast encompasses an assessment of competition and IBM’s market share in the tech sector.
3. Long-term forecasts.
- The forecast explores IBM’s prospects in cloud technologies, AI, and quantum computing.
- The company’s investment strategy and the growth potential of its new business areas are analyzed.
- Global technology trends that may affect IBM’s business are considered.
Such a thorough analysis is essential for creating accurate forecasts and evaluating potential risks.
Conclusion: Is IBM a Good Investment?
IBM retains its position as a key player in the IT industry, with a focus on cloud services, quantum computing, and AI. This strategic direction has the potential to contribute to long-term share growth.
However, the company faces significant challenges, including competition from major industry rivals such as Microsoft, Google, and Amazon, as well as the intricate nature of business transformation. In the near term, IBM’s stock price may be susceptible to market sentiment and economic factors.
Investors seeking stability and dividends may find IBM a lucrative option. Investors seeking high yields should be mindful of the company’s gradual growth rate when building an investment portfolio.
IBM Price Prediction FAQs
The current IBM stock price is $254.64 as of 12.02.2025.
Analysts project moderate growth in IBM’s share price, driven by advancements in cloud technologies, quantum computing, and AI. Long-term forecasts suggest that IBM may strengthen its position in the market, although fierce competition and economic hurdles could impact the company’s shares.
Analysts project that the IBM stock will trade between $142 and $382 in 2026. The implementation of innovative solutions and the expansion of the cloud business may boost the company’s share price. However, market fluctuations due to macroeconomic factors are not ruled out.
The stock is expected to trade at $571–$579 in five years. The development of quantum computing and AI solutions may drive increased demand for IBM shares.
According to long-term forecasts, the IBM stock is poised to reach $571–$579, with the potential to rise further. Key factors influencing this trajectory include technological advancements, competitive pressures, and broader market conditions.
The decision to purchase or sell IBM shares depends on your investment strategy. IBM offers stable dividends, which makes it attractive for long-term investors. However, the company’s growth rates are lower than those of its competitors, so traders may consider other investment vehicles.
Price chart of IBM in real time mode

The content of this article reflects the author’s opinion and does not necessarily reflect the official position of LiteFinance broker. The material published on this page is provided for informational purposes only and should not be considered as the provision of investment advice for the purposes of Directive 2014/65/EU.
According to copyright law, this article is considered intellectual property, which includes a prohibition on copying and distributing it without consent.
{{value}} ( {{count}} {{title}} )
This post is originally published on LITEFINANCE.


