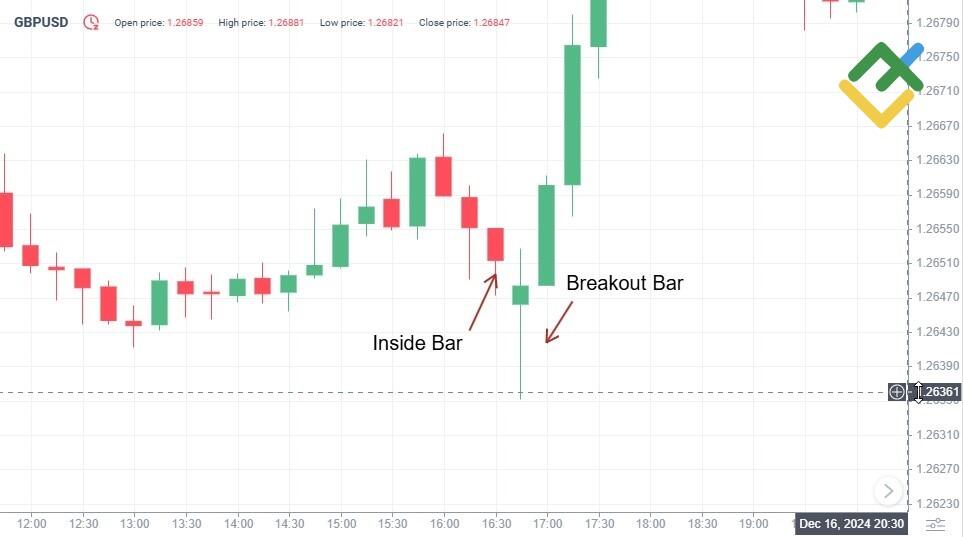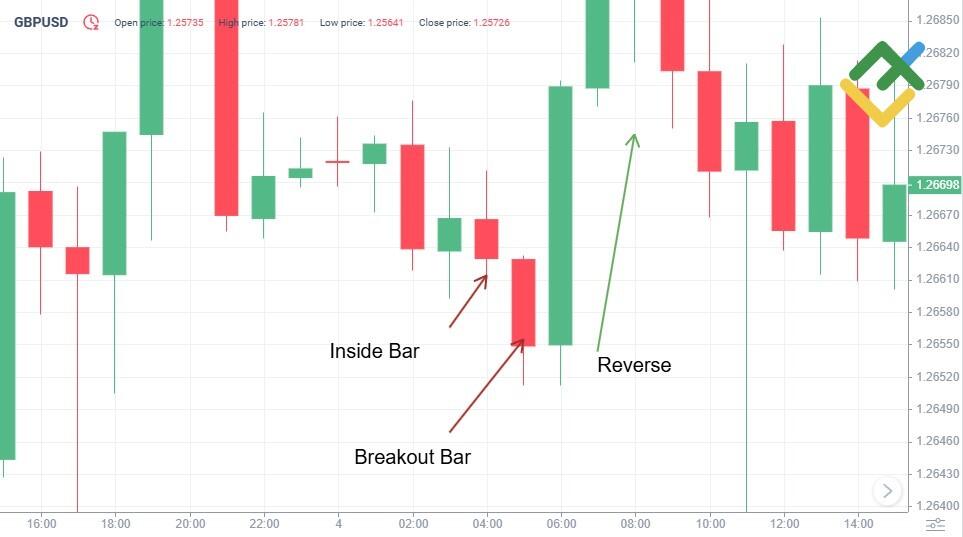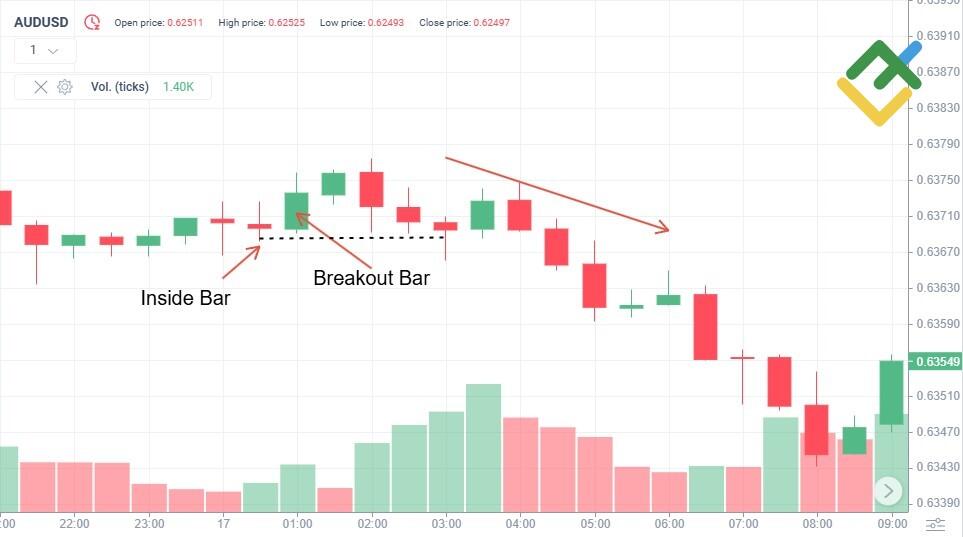
A Hikkake pattern is a candlestick pattern used by traders to analyze the market and pinpoint optimal entry points. It helps traders identify false breakouts and predict further price movement. This pattern can be integrated into various trading strategies, making it suitable for both novices and experienced traders.
The Bullish and Bearish Hikkake patterns enable traders to forecast price trends by analyzing Japanese candlestick behavior. By mastering the Hikkake strategy, you can greatly enhance the accuracy of your trades.
The article covers the following subjects:
Major Takeaways
- A Hikkake pattern detects false breakouts on a price chart.
- The pattern is suitable for analyzing the price trend and determining market entry points.
- There is a Bullish Hikkake and a Bearish Hikkake, each indicating a price direction after a breakout.
- The pattern consists of three candlesticks or three bars.
- The pattern is used in technical analysis to improve the accuracy of predictions.
- A Hikkake pattern can be found on any time frame, from minute to daily chart.
- The pattern signals the price will return to its previous position after a false support/resistance breakout.
- It helps to minimize risks and provides clear stop-loss order levels, making it particularly suitable for seasoned traders.
What Is a Hikkake Pattern?
A Hikkake pattern is a candlestick formation that assists traders in identifying false breakouts of support and resistance levels. The pattern was first described by a famous trader, Daniel L. Chesler. The term comes from the Japanese word meaning “trap,” which perfectly captures the essence of this pattern. It tricks market participants, as it starts to move in one direction and then reverses quickly and heads in the opposite way.
Pattern structure:
- The first candle, which is called the inside bar, is entirely within the range of the previous candle, signaling consolidation and a short-term decrease in market volatility.
- The second candle represents a false upward or downward breakout beyond the first bar range.
- Confirmation candle: the price returns within the range of the first candle and continues to move in the opposite direction, confirming the pattern as a valid Hikkake candlestick.
The Hikkake candlestick pattern serves to predict price movements. It can be used on any time frame, as well as in combination with other technical analysis tools for more accurate forecasts.
Hikkake Pattern Formation
The Hikkake pattern often occurs when a false breakout of a key support/resistance level appears on a chart. For instance, an inside bar sets a lower high, and the price briefly moves beyond the range of this bar, giving the deceptive impression that the trend is continuing.
- The first candlestick (inside bar pattern) is completely overshadowed by the previous candlestick, signaling a decrease in market volatility, followed by a breakout.
- The second candlestick: the price exits the range of the inside bar, closing lower. This often attracts traders who open positions in the direction of the breakout.
- Confirmation candlestick: after the breakout, the confirmation bar signals that the price moves back into the range and starts to head in the opposite direction.
A Hikkake pattern is suitable for analyzing the price action on lower time frames, such as M15–H1, and higher ones, such as H4–D1. It is best used in markets with moderate volatility.
The pattern does not rely on the open and close levels. Therefore, it is easy to recognize on both bar and candlestick charts: inside bar → false breakout → price returns and moves in the opposite direction.
Types of Hikkake Figure
A Hikkake pattern is a chart pattern that helps traders identify false breakouts of support/resistance levels. There are two main types: bullish and bearish, each signaling when to enter the market.
Bullish Hikkake
A Bullish Hikkake candlestick pattern indicates a possible price increase after a false downward breakout. The pattern forms when the price temporarily breaks through the support level but then reverses and continues to move upwards.
Key features:
- The first candlestick forms an inside bar that is fully contained within the range of the previous candlestick, signaling consolidation. Thus, the previous bar completely overshadows the body of the second bar within the inside bar pattern.
- The second candlestick: the price pierces the lower boundary of the inside bar, creating the illusion of a downward reversal and attracting sellers who start opening short trades.
- Confirmation candlestick: the price returns within the inside bar range and then starts to grow. Consequently, the third candle closes above the high of the second bar, which often strengthens the bullish setup and creates buying opportunities.
A Bullish Hikkake candle pattern, like a Bullish Harami candlestick pattern, indicates a possible price advance. However, unlike a Harami pattern, it relies on a false breakout. Its first two candles are declining, while the third one is bullish. Traders often utilize this pattern to identify buy entry points, especially at support levels. A Hikkake pattern is effective on H1 and higher time frames, where market noise is minimal. A stop-loss order is usually placed below the false breakout low, while a take-profit order is set at the nearest resistance levels.
Bearish Hikkake
A Bearish Hikkake is a candlestick pattern indicating a possible price decline following a false upward breakout. This pattern occurs when the price temporarily breaks through a resistance level but then reverses and continues to fall. This behavior can easily trap traders who may have anticipated a sustained upward movement.
Key features:
- The first candlestick forms an inside bar, which is within the range of the previous bar, indicating decreasing volatility.
- The second candlestick: the price goes beyond the high of the inside bar, which draws buyers into the market.
- Confirmation candlestick: the price returns to the inside bar range and starts to slide.
A Bearish Hikkake formation is perfect for finding sell entry points, especially near resistance levels. A stop-loss order is placed above the false breakout high, and a take-profit order is set at the nearest support levels. The pattern is most effective on H1 and higher time frames, where the signals are less affected by market noise.
How to Identify a Hikkake Pattern
To recognize a Hikkake pattern, it is crucial to identify the inside bar followed by a candlestick with a higher low or higher high, depending on the prevailing trend.
- Spot the inside bar. Look for a candlestick that is completely overshadowed by the previous candlestick, signaling market consolidation.
- Look for a false breakout. The price should temporarily break through the inner bar range, either upwards or downwards.
- Reversal confirmation. The price returns to the inside bar range on the next candle, showing a distinctive feature of the pattern.
- Check the movement direction. Determine whether the pattern is bullish, with the price returning upwards, or bearish, with the price returning downwards.
- Pinpoint entry and exit points. Open a trade in the direction of the confirmed movement and place a stop-loss order beyond the extreme of the false breakout.
Example of a Hikkake Pattern
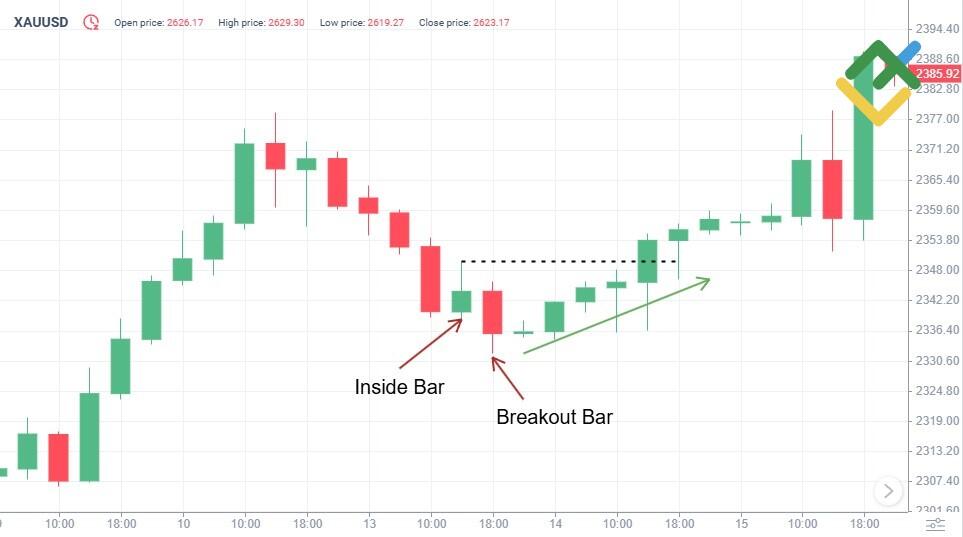
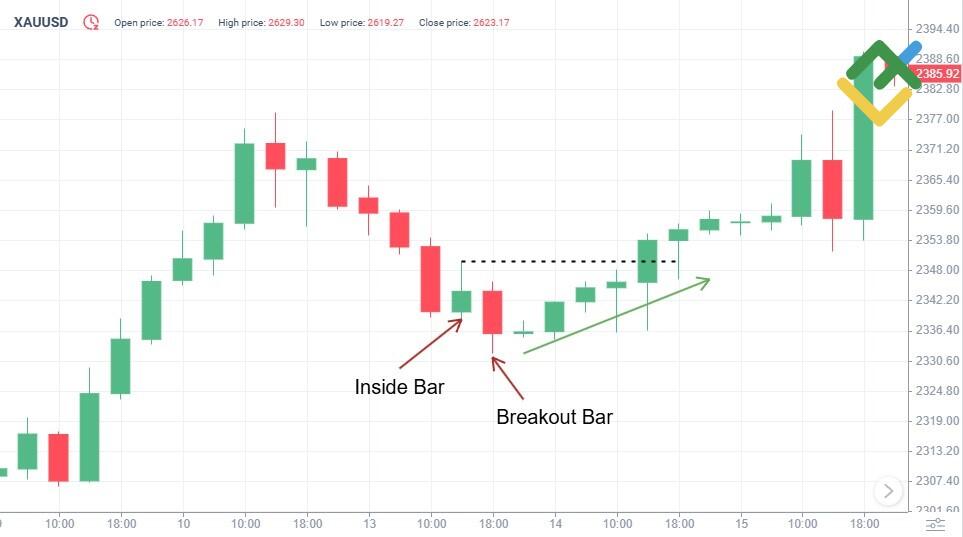
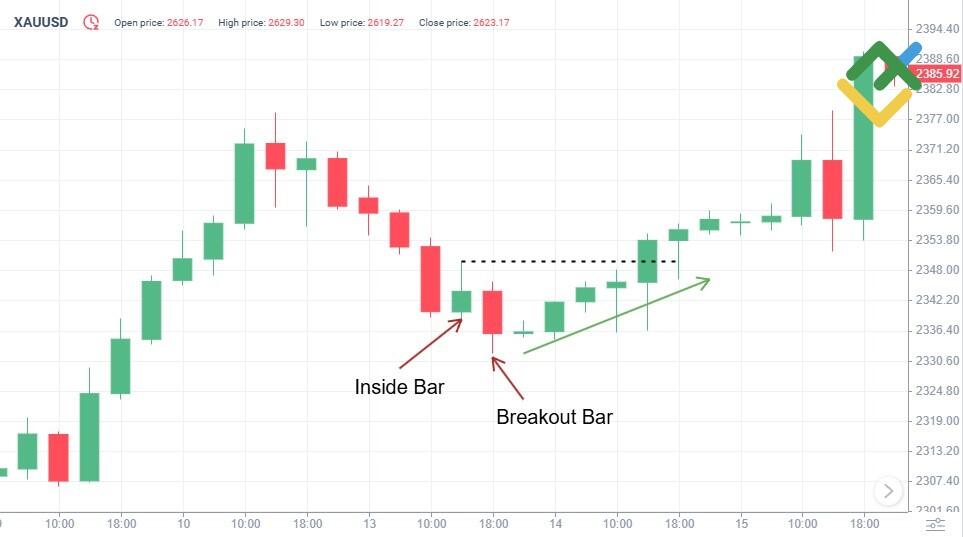
The XAUUSD chart clearly shows the formation of a Bullish Hikkake with three bars.
Before the formation of the pattern shown below, the price was trading in a downtrend. Afterward, the inside bar appeared, being completely within the range of the previous candlestick. This indicated a phase of consolidation.
After the inside bar emerged, a false downward breakout occurred, attracting many traders. Shortly, the price reversed and returned within the inside bar range.
Subsequently, the price began to advance steadily, signaling strong bullish momentum and revealing the earlier breakout as false. This provided an opportunity for traders to open long positions with minimal risk by placing a stop-loss order below the breakout point. A take-profit order is set at the nearest resistance level.
How to Trade Hikkake
Trading using a Hikkake pattern is often regarded as one of the best trading strategies. The pattern is ideal for those who need a convenient way to detect false breakouts. Additionally, the pattern helps find the best trading signals to open trades. Versatile in nature, the Hikkake pattern can be applied to analyze price movements across various time frames. Besides, it can be used both in long-term and intraday trading.
Reversal Signal on a Pullback
A Hikkake candlestick pattern can be a reversal pattern. It signals a potential reversal when the price returns to the inside bar range after a false breakout, and the trend changes to the opposite one. This signal allows you to open a trade on a pullback with low risks and precise stop-loss order placement.
Bullish Trend Continuation Signal
If the price rebounds upwards after a false downward breakout and pierces the previous high, this is a bullish trend continuation signal. A Hikkake helps to confirm the strength of bullish momentum and identify optimal entry points.
Trend Reversal
A Hikkake pattern indicates a reversal if the price turns around after a false breakout and continues to move in the opposite direction. The pattern often occurs at key support or resistance levels.
Pros and Cons of Using the Hikkake Pattern
A Hikkake candle pattern is a universal tool that helps traders spot false breakouts and determine entry points. Its main advantages include simplicity, application on different time frames and relatively low risks. However, trading this pattern requires an understanding of chart analysis, as it can generate false signals during periods of low volatility.
| Pros | Cons |
| Easy to identify |
False signals are possible |
| Suitable for all time frames |
Less effective in a flat channel |
| Low risks |
Requires confirmation by additional tools |
| Universal for all markets |
Dependent on the volatility level |
Conclusion
A Hikkake pattern is an effective technical analysis tool in trading, which assists traders in detecting false breakouts and predicting price movements. Due to its versatility, it is suitable for working on any time frame and with different assets.
The Bullish and Bearish Hikkake provide both trend continuation and reversal signals. This pattern allows you to mitigate risks and boost potential profits. However, it is essential to combine it with other indicators and take into account market volatility to achieve successful results. A Hikkake is an excellent tool for traders who want to improve the accuracy of their forecasts.
Hikkake Pattern FAQs
A Hikkake is a triple candlestick pattern that shows false support/resistance breakouts and helps to predict further price movement.
This is a trading method that uses a Hikkake pattern to find false breakouts. A trader opens a position in the price direction after the reversal.
This is a situation when the price first falls below the support level but then reverses and starts to climb steadily, creating an opportunity to open long trades.
A Hikkake can be either a bullish candlestick pattern or a bearish one. A Bullish Hikkake pattern signals a possible price appreciation after a false downward breakout, while a Bearish Hikkake indicates a price drop after a false upward breakout.
The content of this article reflects the author’s opinion and does not necessarily reflect the official position of LiteFinance broker. The material published on this page is provided for informational purposes only and should not be considered as the provision of investment advice for the purposes of Directive 2014/65/EU.
According to copyright law, this article is considered intellectual property, which includes a prohibition on copying and distributing it without consent.
{{value}} ( {{count}} {{title}} )
This post is originally published on LITEFINANCE.

