
The Half Trend indicator is a tool that helps traders analyze trends and identify potential pivot points. Its signals are simple and are represented by four elements: two types of lines and arrows. This trend indicator is based on a moving average, making it perfect for trading Forex and other markets.
This article explains how the Half Trend indicator works and how to use it for successful trading.
The article covers the following subjects:
Major Takeaways
- Half Trend is a trend indicator that shows the price direction using lines and arrows.
- Blue lines and arrows signal an uptrend, while red ones indicate a downtrend.
- It is typically used in a trending market to find the best points to open and close trades.
- Since its signals are lagging, additional examination of the market situation is required.
- The best strategy depends on the time frame and volatility of the financial instrument.
- Works better on H1 and higher time frames, where there is less market noise.
- Effective with proper risk management and a clear trading strategy.
- The indicator is user-friendly and suitable even for beginner traders.
What is the Half Trend Indicator?
The Half Trend indicator is a technical analysis tool that assists traders in detecting the trend direction on a candlestick chart.
The indicator is based on the moving average and displays signals in the form of blue and red arrows. Blue arrows indicate the beginning of a bullish trend, and red arrows indicate a bearish trend. The Half Trend indicator simplifies market analysis and allows traders to pinpoint potential entry/exit points. Due to its simplicity and versatility, the indicator is suitable for both beginners and experienced traders.
Components of the Half Trend Indicator
The Half Trend indicator consists of two key components: the half trend line and arrows. These components help traders to determine the trend direction and identify entry and exit points.
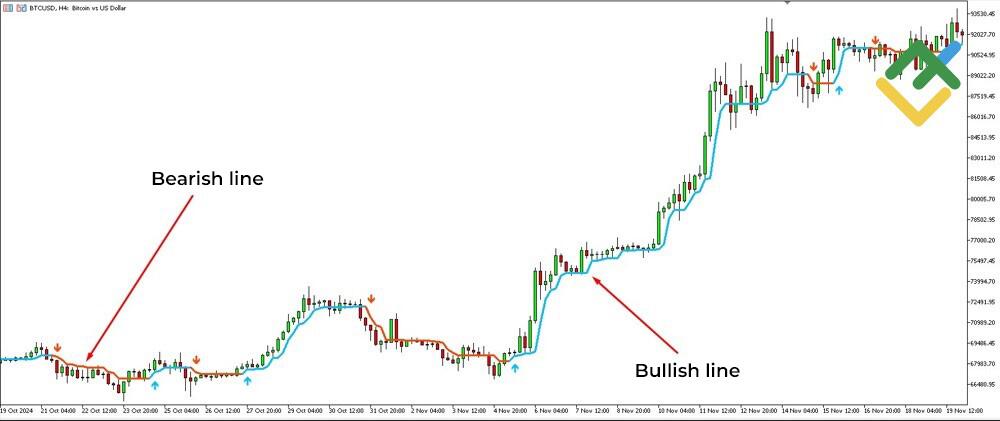
The Half Trend Line
The Half Trend line is the key element of the indicator, which shows the general trend direction in the market. It is based on moving average data but differs from standard lines by its ability to adapt to price changes. When the line is upward, the trend is bullish. Conversely, when it is downward, the trend is bearish.
The main purpose of the line is to visually display market trends so that traders can plan their future actions. When the line is used alongside other components of the indicator, trading becomes more accurate and convenient.
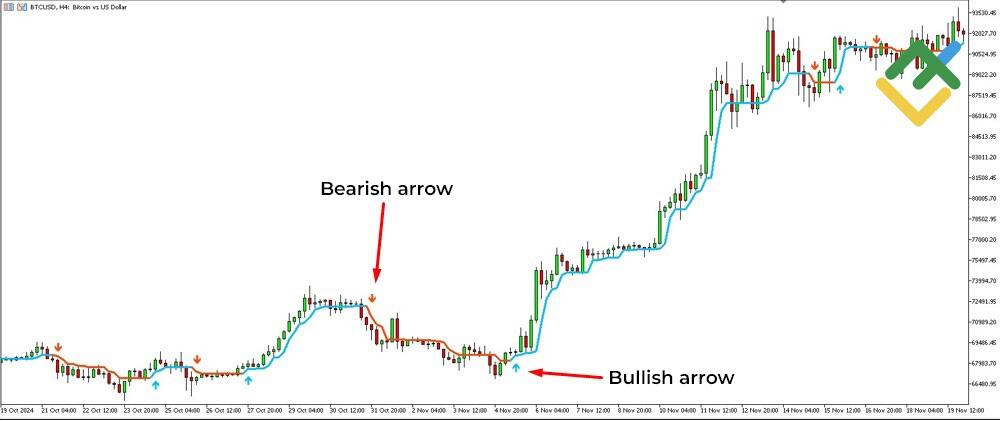
Arrows and Their Significance
A blue arrow appears when an uptrend starts, allowing you to open a long trade. Red arrows, on the contrary, indicate a downtrend.
These arrows help traders quickly understand the market situation and identify entry or exit points. These clear visual signals reduce the likelihood of errors. Using arrows in conjunction with the half trend line allows traders to react more confidently to price changes and make more informed investment decisions.
How the Half Trend Indicator Works
The indicator predicts a trend direction using price history and moving average data. The main signals are represented by blue and red lines and arrows, indicating a trend reversal.
- Blue lines and arrows point to a bullish trend, prompting traders to initiate a long position. For example, the screenshot below shows that in February 2024, the price continued to rise after the blue arrow appeared.
- Red lines and arrows indicate a bearish trend. Thus, according to the chart, traders could open short trades starting from June 2024.
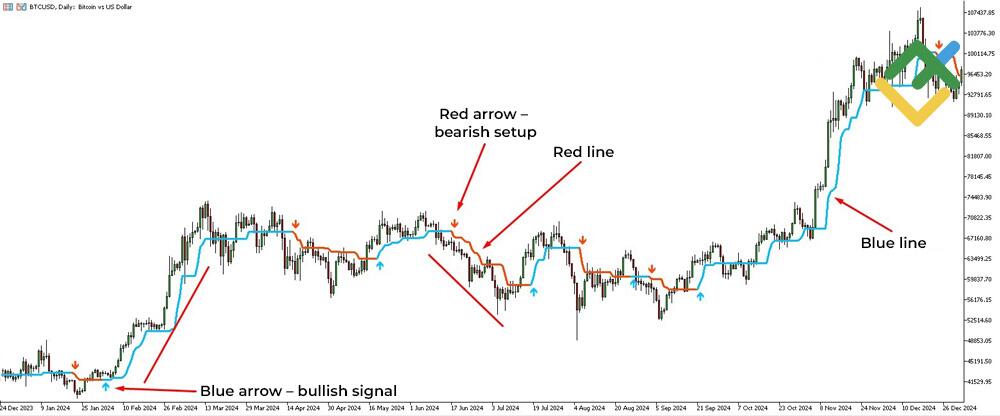
The Half Trend indicator responds to significant price fluctuations, though it is slightly lagging, which is typical for most trend indicators. Therefore, it is crucial to avoid relying solely on the Half Trend signals. Instead, take into account the overall market conditions and incorporate other technical indicators into your analysis.
The indicator is perfect for trending markets, where its signals tend to be more reliable. To boost its efficiency, it is advisable to combine it with other tools, such as the RSI or Currency Strength Meter. This combination can help reduce risks and elevate the quality of your analysis.
Best Use Cases for the Half Trend Indicator
The Half Trend indicator works best in trending markets with clear upward or downward price movements. The line’s color changes and the appearance of arrows help to find optimal points for opening trades, especially within H1 and higher time frames.
However, when using the Half Trend indicator, it is essential to examine the current market situation. Sometimes, it is better to open a position without waiting for a clear confirmation from this lagging indicator and make a bigger profit.
How to Trade with the Half Trend Indicator
This section explains how to use the Half Trend indicator effectively. As a result, this information will help you understand how to read and interpret the indicator signals, mitigate risks, and apply this tool in different market conditions.
Conditions to BUY Using the Half Trend Indicator
The screenshot below highlights the area where the indicator forms a blue arrow, and the line becomes blue. This serves as a signal for the uptrend beginning when you can open a long trade. You should enter the market immediately after the arrow appears. A stop-loss order is set slightly below the swing low. A take-profit order is placed at the nearest resistance level, where the candlesticks cross the blue line from above, and the price stops increasing.
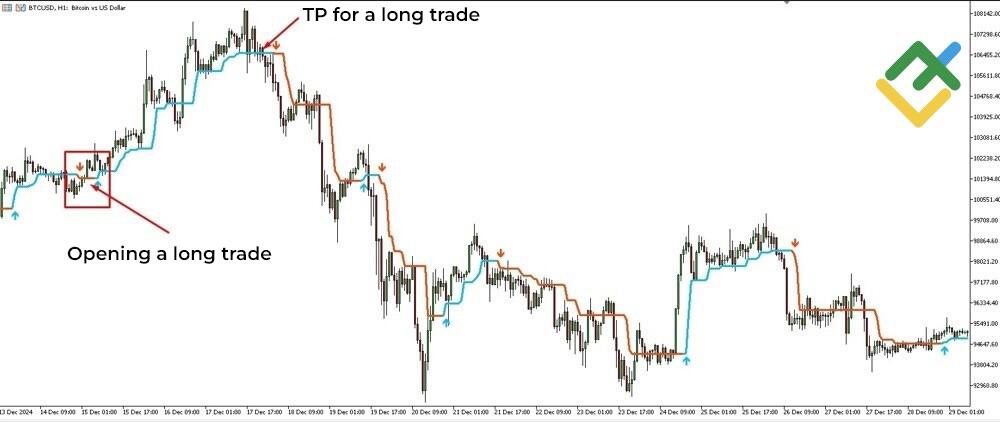
The price appreciation after the arrow appearance validates the indicator’s effectiveness. However, even with clear indicator signals, you should evaluate the overall market situation. For instance, if the price breaks through the resistance, you can secure just a part of the profits in order to benefit from potential further growth.
Conditions to SELL Using the Half Trend Indicator
A red arrow emerges on the highlighted area of the chart below, and the indicator line turns red, suggesting the onset of a bearish trend. Thus, short trades can be considered. A stop-loss order is placed just above the previous high. A take-profit order is set at the support level, where the decline may decelerate.
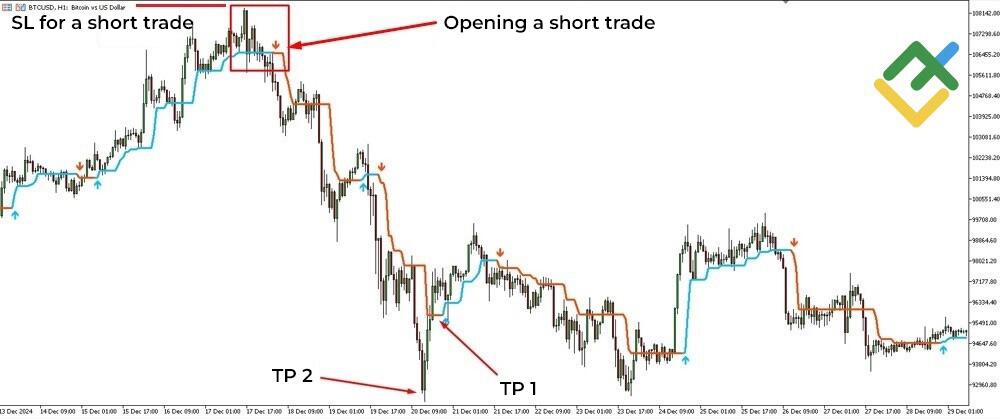
Nevertheless, the general recommendation suggests taking into account the risks. A take-profit order (TP1) was set to lock in profits, provided the indicator signal is 100% confirmed. However, if the strong downward momentum persists, the price may plunge lower (TP2). Therefore, it is vital to make independent decisions and not solely rely on the Half Trend indicator.
Risk Management with the Half Trend Indicator
When trading with the Half Trend indicator, it is essential to adhere to the risk management rules. You should always set your stop-loss order at the nearest support or resistance level (depending on the trend) to limit potential losses. Do not use the indicator signals as your only guide, as they are lagging. Combine the Half Trend indicator with other tools, such as the RSI or Fibonacci levels, to confirm signals.
Avoid trading during low volatility or flat markets, to stay free from false signals, which are more likely during such periods. Control the volume of trades and stick to the money management rules in order to reduce risks and preserve your capital.
Pros and Cons of the Half Trend Indicator
The Half Trend indicator is a handy tool for analysis. However, it comes with advantages and disadvantages.
Advantages
- Easy to use, gives clear visual signals.
- Effective during trending markets, helps to find entry and exit points.
- Suitable for different time frames, from H1 to D1.
- Can be used in combination with other indicators to enhance accuracy.
Disadvantages
- Can be delayed, possibly reducing the accuracy of signals.
- Less effective in a sideways market, generates false signals.
- It is advisable to use it along with other analysis tools to develop profitable strategies.
- Not always suitable for short-term trading or highly volatile instruments.
Best Settings for the Half Trend Indicator
To ensure the best performance of the Half Trend indicator in MetaTrader, you need to follow a few simple steps:
- Download the indicator into the MT4 trading terminal and add it to the chart of a trading instrument.
- In the Inputs section, adjust the moving average amplitude. It is advisable to set the value from 2 to 6 for short-term trends and to 8 and higher for long-term trends.
- Set the line color: blue for uptrends and red for downtrends (or whatever you prefer).
- Choose a suitable time frame: H1 or higher to reduce market noise.
- You should test your strategy on a demo account to ensure its effectiveness.

Conclusion: Maximizing the Half Trend Indicator’s Potential
The Half Trend indicator is one of the most convenient tools for trend analysis, which is suitable for both novice and seasoned traders. Its simplicity and clear signals make it an effective assistant in identifying entry and exit points in trending markets. However, like any indicator, the Half Trend has its limitations, including lagging and potential false signals during a sideways trend.
It is suggested to combine the Half Trend indicator with other technical analysis tools and take into account the market situation to increase its accuracy. Although the Half Trend indicator is not a one-size-fits-all solution, it can significantly improve your trading performance if properly used.
Half Trend Indicator FAQs
The Half Trend Indicator is a technical analysis tool that helps determine the trend direction by displaying a colored line and arrows.
To use the Half Trend indicator, you should watch the color of the line and arrows. The blue line and arrow suggest opening long trades, while the red ones indicate selling opportunities. Combine this tool with other indicators and follow risk management rules to maximize its effectiveness.
The amplitude is determined by the moving average length in the Inputs section. It varies depending on the volatility of an instrument and the selected time frame. The higher the amplitude, the lower the sensitivity of the indicator.
The optimal settings depend on your trading style. Set the moving average amplitude value from 2 to 6 for short-term trends. Use higher values for long-term trading and test the strategy on a demo account.

The content of this article reflects the author’s opinion and does not necessarily reflect the official position of LiteFinance broker. The material published on this page is provided for informational purposes only and should not be considered as the provision of investment advice for the purposes of Directive 2014/65/EU.
According to copyright law, this article is considered intellectual property, which includes a prohibition on copying and distributing it without consent.
{{value}} ( {{count}} {{title}} )
This post is originally published on LITEFINANCE.