At the beginning of 2024, Alphabet Inc. adjusted its revenue predictions upward. While the financial landscape is perpetually evolving, current indicators suggest a bullish phase for the #GOOGL shares.
The Google stock forecast has been a topic of keen interest, especially given the company’s recent technological strides. This article reviews expert forecasts and provides fundamental and technical analysis for the Google stock price, allowing you to build a reliable trading strategy and make informed decisions on investing in Google stocks.
The article covers the following subjects:
Highlights and Key Points: Google Forecast 2024-2030
- The Google stock price stands at $163.75 as of 23.09.2024.
- Predictions for 2024 reflect a bullish trend for the Google stock. CoinPriceForecast anticipates an increase to $162. LongForecast predicts a significant upside, with a December closing price of $236.
- Looking ahead to 2025, CoinPriceForecas envisions Google shares reaching the range of $162–$194.
- Long-term predictions for 2030–2035 indicate a steady upward trend. By 2030, the stock is expected to rise to $348, driven by innovations and Google’s dominance in the market.
Google Stock Price Today coming days and week
When forecasting the Alphabet Inc. stock price in the near term, focus on several key factors. Analyze quarterly earnings reports for insights into revenue growth, particularly from advertising and cloud services. Monitor developments in regulatory scrutiny and potential antitrust actions, as these can impact operations and market perception.
Pay attention to product launches and innovations, especially in AI. Track broader market trends and investor sentiment towards tech stocks, as these influence stock performance. Additionally, consider macroeconomic indicators such as interest rates and economic growth, which affect overall market conditions and consumer spending.
Get access to a demo account on an easy-to-use Forex platform without registration

Google Price Forecast for 2024 – Expert Predictions
Experts’ forecasts for 2024 suggest solid growth in Google stocks. The main drivers of this growth are the steady progress of key business sectors, such as advertising and cloud services, as well as the extensive integration of AI. The company’s AI initiatives are anticipated to enhance user experience and optimize internal operations, ultimately leading to increased revenues and improved competitiveness.
CoinPriceForecast
Price range in 2024: $137–$193 (as of 08.09.2024).
CoinPriceForecast suggests that the Google stock will continue to grow steadily. By the end of 2024, the price is expected to reach $158, representing a 4% increase from current levels.
| Year | Mid-Year, $ | Year-End, $ | Tod/End, % |
|---|---|---|---|
| 2024 | 174 | 158 | 4% |
PandaForecast
Price range in 2024: $153.90–$177.19 (as of 08.09.2024).
Analysts at PandaForecast predict that 2024 will be a favorable year for investing in the #GOOG stock. Despite possible fluctuations and dips during the year, the price is expected to grow by 12.33% by the end of December.
| Month | Average, $ | Minimum, $ | Maximum, $ | Volatility, % |
|---|---|---|---|---|
| October | 161.71 | 158.08 | 166.95 | 5.32% |
| November | 171.03 | 167.03 | 177.19 | 5.73% |
| December | 164.72 | 153.90 | 175.54 | 12.33% |
WalletInvestor
Price range in 2024: $179.526 – $203.457 (as of June 13, 2024)
According to WalletInvestor, Alphabet’s share price in 2024 will reflect moderate volatility in a relatively narrow trading range. The price is expected to peak in December despite a slight dip in September. By the end of the year, the Google price is forecast to recover. WalletInvestor remains bullish on the stock price.
| Month | Opening, $ | Closing, $ | Minimum, $ | Maximum, $ | Change |
|---|---|---|---|---|---|
| July | 179.526 | 187.581 | 179.526 | 187.581 | 4.29 % ▲ |
| August | 187.913 | 193.616 | 187.913 | 193.616 | 2.95 % ▲ |
| September | 193.818 | 190.509 | 190.097 | 193.956 | -1.74 %▼ |
| October | 190.606 | 195.144 | 190.606 | 195.144 | 2.33 % ▲ |
| November | 195.333 | 202.256 | 195.333 | 202.256 | 3.42 % ▲ |
| December | 201.877 | 203.457 | 201.131 | 203.457 | 0.78 % ▲ |
LongForecast
Price range in 2024: $112–$165 (as of 08.09.2024).
LongForecast predicts that Google’s stock price will start to plunge in September 2024, opening at $165 and closing at $140, marking a 15.2% decrease. Subsequently, the price is expected to fall to $129 in October, $125 in November, and $122 in December, reflecting a 26.1% decline.
| Month | Opening, $ | Min–Max, $ | Closing, $ | Total, % |
|---|---|---|---|---|
| September | 165 | 125–165 | 140 | -15.2% |
| October | 140 | 119–154 | 129 | -21.8% |
| November | 129 | 115–135 | 125 | -24.2% |
| December | 125 | 112–132 | 122 | -26.1% |
Google Stock Technical Analysis
In order to conduct a comprehensive technical analysis of the Google (Alphabet Inc.) stock, it is essential to assess different time frames. For short-term trading, one-minute and hourly charts are the optimal choice. As for long-term investing, it is advisable to focus on daily and weekly time frames. These time frames will allow us to determine both short-term and long-term market trends.
Moving averages (SMA, EMA) are useful when evaluating market trends, while the RSI and MACD indicators provide insight into overbought or oversold zones. Trend lines and support/resistance levels are key tools for predicting potential trend reversals in the market.
Additional analytical tools, such as the Fibonacci indicator, assist in evaluating price corrections, while Bollinger Bands are utilized to gauge volatility. The ADX indicator determines the strength of a prevailing price trend, enabling investors to ascertain whether it is likely to persist or reverse. Candlestick patterns such as “Engulfing” or “Hammer” often indicate impending reversals in the market trend, providing important signals to traders.
blog
Promo code
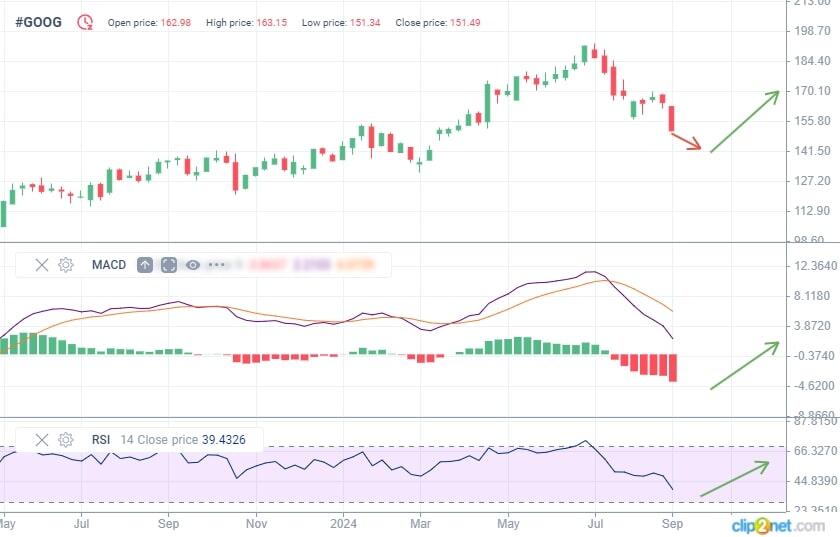
#GOOG Stock Analysis For Next Three Months
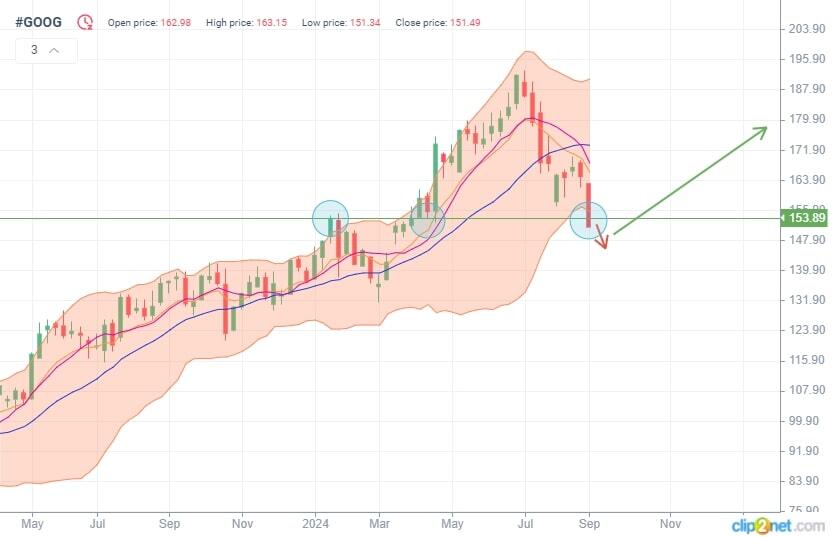
On the daily time frame, the #GOOG stock has traded in a downtrend since July 2024, when the company’s stocks showcased robust performance. The RSI indicator is at 27.76, suggesting that the stock is oversold and may potentially experience a short-term reversal to the upside. However, the EMA and SMA remain below the current price, trending downwards. The moving averages confirm the prevailing bearish sentiment in the market.
The trading week closed with a long bearish candlestick, indicating that sellers put significant pressure on the asset. This suggests that bears are dominating the market and that further declines are probable. Google quotes are moving near a key support level that has been in place since January 2023. A breach of this level could intensify the downward movement and potentially result in a more pronounced price decline.
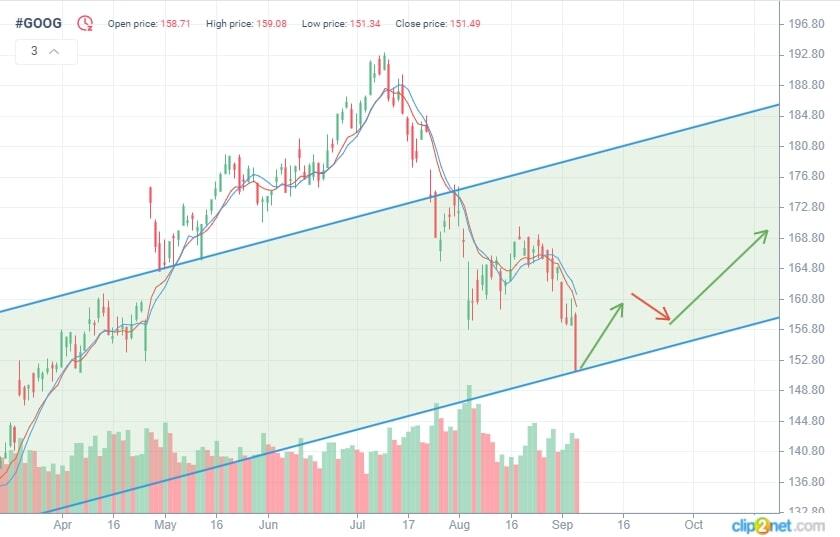
However, given that the RSI is in the oversold zone, there is a possibility of a short-term upward movement before the global downward trend continues. It is important to monitor candlestick patterns and volumes to confirm a reversal, as well as whether the price can hold above or break through the support level.
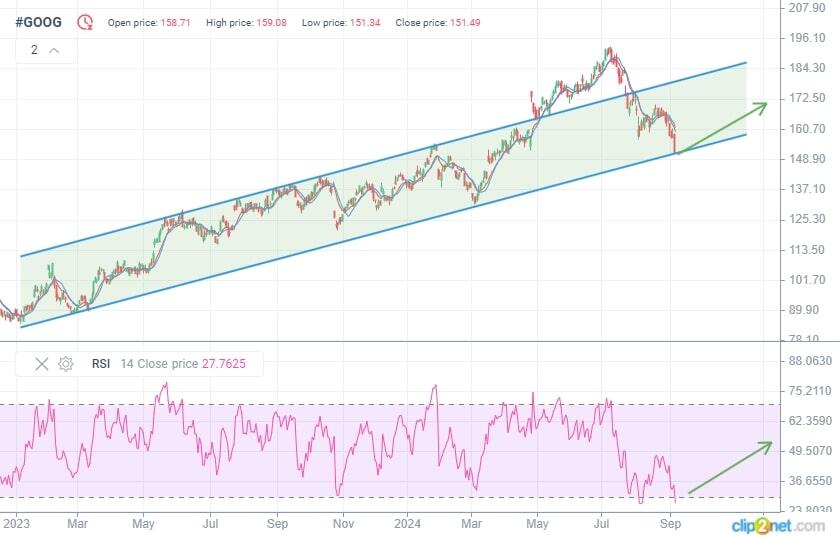
Long-term Google stock price analysis for 2024
On the weekly time frame, Google (Alphabet Inc.) stocks are showing signs of waning uptrend. The RSI reached 74 following recent highs and has decreased to 39.43, suggesting a loss of bullish momentum. The MACD also confirms this trend reversal, with both its lines crossing in the positive zone and continuing to decline. This suggests that the #GOOG price is trading in a downtrend. At the same time, there is a considerable spread between the two MACD lines.
Bollinger Bands indicate that the price is approaching the lower boundary, suggesting an oversold condition. Furthermore, the SMA and EMA confirm the downward trend. Both lines are above the current price, declining in proximity to each other.
The technical indicators point to a bearish near-term outlook for Google shares. However, a short-term rebound can be expected if the price maintains above the support level and the indicators signal a deceleration in the downward trend.
| Month | Alphabet Inc. (#GOOG) Projected Values | |
|---|---|---|
| Minimum, $ | Maximum, $ | |
| September | 149 | 164 |
| October | 158 | 166 |
| November | 167 | 177 |
| December | 153 | 175 |
Long-Term Trading Plan for Alphabet Inc. (#GOOG)
The long-term trading plan for Alphabet Inc. (#GOOG) includes three-month and one-year targets based on current technical indicators and market conditions. This plan is designed for investors seeking to manage risk and maximize returns.
Targets for three months:
- The resistance level is at $160–$165. If the price breaks through this zone, consider long positions.
- The support level is at $145–$150. The quotes may rebound from this level if confirmed by indicators.
- The RSI is below 30, pointing to a possible buying opportunity at the support level.
- If the price breaches the $155 level, one can buy the asset with the target near $170.
Targets for 12 months:
- The asset may reach the target zone of $200–$220 if the uptrend continues and fundamental factors support the upward movement.
- The risk level is $130–$140. A breakout of this level may signal possible additional corrections.
- Consider keeping long positions open if the price exceeds $200.
Google Share Price Predictions for 2025
Many platforms predict an optimistic outlook for the Google (Alphabet Inc.) stock in 2025, albeit with varying levels of confidence. Overall, analysts are positive about the long-term growth of the #GOOG stock, citing the company’s stable business segments and innovative solutions as key factors. Investors can expect positive price trends amid stable business development and implementation of new technologies.
CoinPriceForecast
Price range in 2025: $162–$194 (as of 08.09.2024).
According to CoinPriceForecast, the Alphabet Inc. (Google) stock will surge by 28% in 2025, hitting $162 by the mid-year and $194 by the end of the year, confirming analysts’ confidence in the company’s long-term growth potential.
| Year | Mid-Year, $ | Year-End, $ | Tod/End, % |
|---|---|---|---|
| 2025 | 162 | 194 | 28% |
PandaForecast
Price range in 2025: $139.76–$180.50 (as of 08.09.2024).
PandaForecast predicts that Alphabet Inc. will show significant volatility in 2025. At the beginning of the year, the stock may experience moderate growth, followed by periods of decline in the middle of the year. However, the price will partially recover by the year’s end, demonstrating continued investor confidence in the company’s long-term growth prospects. During the year, the shares will likely fluctuate widely, reflecting market changes and responses to key events and shifts in the company’s business.
| Month | Average, $ | Minimum, $ | Maximum, $ |
|---|---|---|---|
| January | 163.68 | 158.23 | 169.13 |
| February | 160.00 | 153.95 | 168.49 |
| March | 161.15 | 156.65 | 165.21 |
| April | 173.62 | 163.00 | 180.50 |
| May | 169.09 | 159.66 | 175.33 |
| June | 169.85 | 166.49 | 179.94 |
| July | 156.09 | 145.14 | 163.68 |
| August | 146.82 | 142.46 | 154.62 |
| September | 152.64 | 144.94 | 160.74 |
| October | 147.28 | 143.43 | 157.62 |
| November | 146.48 | 139.76 | 151.89 |
| December | 159.01 | 153.28 | 167.45 |
WalletInvestor
Price range in 2025: $175.265–$225.925 (as of 08.09.2024).
According to WalletInvestor, Google’s stock is anticipated to experience a mix of positive and negative fluctuations in 2025. January is expected to bring robust growth, followed by a brief decline in February. A recovery phase is projected from March to August, with the price reaching one of its peaks in August. September may witness a slight downturn, but the stock will regain momentum in October. Towards the end of the year, particularly in November and December, steady growth with a gradual increase in share price is anticipated.
| Month | Opening, $ | Closing, $ | Minimum, $ | Maximum, $ | Change, % |
|---|---|---|---|---|---|
| January | 175.265 | 183.519 | 175.265 | 183.519 | 4.5% |
| February | 184.523 | 180.055 | 180.055 | 185.297 | -2.48% |
| March | 179.623 | 188.412 | 179.434 | 188.412 | 4.66% |
| April | 188.618 | 192.261 | 188.618 | 192.261 | 1.90% |
| May | 192.561 | 201.319 | 192.561 | 201.319 | 4.35% |
| June | 201.639 | 205.311 | 201.638 | 205.311 | 1.79% |
| July | 205.399 | 209.348 | 205.399 | 209.396 | 1.89% |
| August | 209.434 | 214.601 | 209.196 | 214.601 | 2.41% |
| September | 215.415 | 213.208 | 213.079 | 216.105 | -1.03% |
| October | 213.296 | 217.781 | 213.296 | 217.781 | 2.06% |
| November | 218.225 | 224.823 | 218.225 | 224.823 | 2.94% |
| December | 224.656 | 225.925 | 223.717 | 225.925 | 0.56% |
LongForecast
Price range in 2025: $118–$215 (as of 08.09.2024).
LongForecast predicts that Alphabet Inc. (Google) will start 2025 with a gradual recovery after a significant drop at the beginning of the year. The price will drop by 22.4% in January, but February will witness an uptrend that will likely strengthen by mid-year, followed by a steady uptrend from July until the end of the year. In November and December, the asset will grow particularly intensely, with an increase of 20.6%, indicating positive expectations and a sustained recovery by the end of the year.
| Month | Opening, $ | Min–Max, $ | Closing, $ | Total, % |
|---|---|---|---|---|
| January | 122 | 118–138 | 128 | -22.4% |
| February | 128 | 124–146 | 135 | -18.2% |
| March | 135 | 135–165 | 153 | -7.3% |
| April | 153 | 142–166 | 154 | -6.7% |
| May | 154 | 144–168 | 156 | -5.5% |
| June | 156 | 152–178 | 165 | 0% |
| July | 165 | 158–186 | 172 | 4.2% |
| August | 172 | 159–187 | 173 | 4.8% |
| September | 173 | 161–189 | 175 | 6.1% |
| October | 175 | 167–197 | 182 | 10.3% |
| November | 182 | 182–214 | 198 | 20% |
| December | 198 | 183–215 | 199 | 20.6% |
Google Stock Price Predictions for 2026
Analytical platforms such as CoinPriceForecast and LongForecast conduct comprehensive market assessments to determine future movements in the #GOOG stock price. Their forecasts help develop more accurate predictions and create reliable trading strategies.
CoinPriceForecast
Price range in 2026: $196–$217 (as of 08.09.2024).
According to CoinPriceForecast, Google’s stock will continue to show positive momentum into 2026. The price is expected to climb to $250 by mid-year and reach $283 by year-end. The projected 43% surge in share price reflects confidence in the company’s steady growth.
| Year | Mid-Year, $ | Year-End, $ | Tod/End, % |
|---|---|---|---|
| 2026 | 196 | 217 | 43% |
PandaForecast
Price range in 2026: $164.46–$221.41 (as of 08.09.2024).
PandaForecast predicts that Google’s stock will grow gradually throughout 2026. At the beginning of the year, the average price is expected to trade around $172.60, with moderate increases in February and March. By spring, the stock will continue to strengthen, hitting an average price of $189.49 in June. In summer and fall, the stock is projected to increase steadily, reaching $216.16 in October. Despite slight fluctuations in November, the price will stabilize at around $214.04 by December, indicating a long-term positive trend.
| Month | Average, $ | Minimum, $ | Maximum, $ |
|---|---|---|---|
| January | 172.60 | 168.10 | 179.13 |
| February | 175.09 | 166.42 | 181.23 |
| March | 176.19 | 164.46 | 186.02 |
| April | 183.01 | 175.93 | 191.25 |
| May | 186.63 | 181.93 | 196.21 |
| June | 189.49 | 180.28 | 197.16 |
| July | 195.46 | 185.43 | 202.85 |
| August | 192.12 | 186.76 | 204.22 |
| September | 204.74 | 191.84 | 213.77 |
| October | 216.16 | 207.41 | 221.41 |
| November | 208.96 | 200.50 | 213.85 |
| December | 214.04 | 201.91 | 219.44 |
WalletInvestor
Price range in 2026: $226.105–$276.762 (as of 08.09.2024).
According to WalletInvestor, the Google (Alphabet Inc.) stock will demonstrate a gradual increase with some fluctuations in 2026. The stock is expected to gain a solid 3.28% in January but may see a slight decline of 1.64% in February. It is projected to recover in March and continue rising through June, with gains of 3.55% and 1.43%, respectively. The uptrend will persist through the summer, reaching new highs in August. However, a slight decline of 0.81% is expected in September. By year-end, the stock will recover and end December with a slight gain of 0.51%, confirming the overall positive trend. This projection is attributed to the company’s continued successful development in key business areas and regular innovations.
| Month | Opening, $ | Closing, $ | Minimum, $ | Maximum, $ | Change, % |
|---|---|---|---|---|---|
| January | 226.105 | 233.778 | 226.105 | 233.778 | 3.28% |
| February | 234.914 | 231.112 | 231.112 | 236.105 | -1.64% |
| March | 230.521 | 239.013 | 230.217 | 239.013 | 3.55% |
| April | 239.272 | 243.073 | 239.272 | 243.073 | 1.56% |
| May | 243.380 | 251.917 | 243.380 | 251.917 | 3.39% |
| June | 252.285 | 255.945 | 252.285 | 255.945 | 1.43% |
| July | 256.082 | 260.224 | 256.082 | 260.224 | 1.59% |
| August | 260.156 | 265.874 | 259.980 | 265.874 | 2.15% |
| September | 266.035 | 263.908 | 263.862 | 266.909 | -0.81% |
| October | 264.121 | 268.433 | 264.121 | 268.433 | 1.61% |
| November | 268.775 | 275.516 | 268.775 | 275.592 | 2.45% |
| December | 275.355 | 276.762 | 274.566 | 276.762 | 0.51% |
LongForecast
Price range in 2026: $163–$295 (as of 08.09.2024).
LongForecast predicts that Google’s share price will undergo significant fluctuations in 2026. In January, the price will open at $199 and close with an impressive 38.8% surge. In February, the stock will continue to gain, reaching 43.6%, and peak at 64.8% in March. However, a series of corrections will begin in April, leading to a decline of 47.9% in June. Although the price may partially recover in summer, the stock is likely to retrace in August and September. In autumn, the decline will likely continue, and the stock will close at $177 in December, indicating a general decrease in the growth rate by the end of the year.
| Month | Opening, $ | Min–Max, $ | Closing, $ | Total, % |
|---|---|---|---|---|
| January | 199 | 199–247 | 229 | 38.8% |
| February | 229 | 218–256 | 237 | 43.6% |
| March | 237 | 237–294 | 272 | 64.8% |
| April | 272 | 224–272 | 243 | 47.3% |
| May | 243 | 243–300 | 278 | 68.5% |
| June | 278 | 224–278 | 244 | 47.9% |
| July | 244 | 244–295 | 273 | 65.5% |
| August | 273 | 236–278 | 257 | 55.8% |
| September | 257 | 206–257 | 224 | 35.8% |
| October | 224 | 197–231 | 214 | 29.7% |
| November | 214 | 167–214 | 182 | 10.3% |
| December | 182 | 163–191 | 177 | 7.3% |
Google (Alphabet): Price History
Google’s stock, under the umbrella of Alphabet Inc., has seen remarkable growth over the years. The tech giant’s stock trajectory is a testament to its consistent innovation and dominance in the digital space.
Despite the COVID-19 pandemic, Google’s 2020 sales rose by 12.7% to $182 billion, including due to Google Cloud sales growing by 46%.
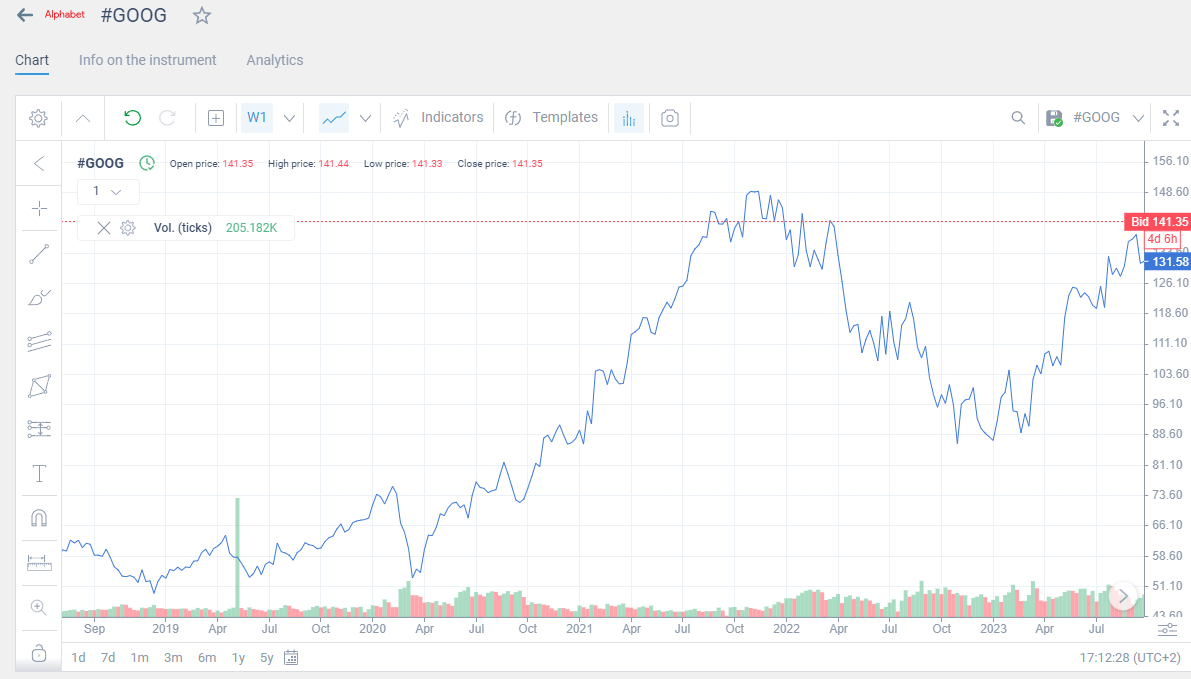
In 2023, the asset showed another growth. Alphabet Inc. has achieved significant success in the field of digital advertising and artificial intelligence. The company’s revenue increased by 11%, surpassing Wall Street experts’ forecasts by $980 million.
According to Alphabet’s Q2 2024 financial report, its advertising revenue grew by 13%, and YouTube’s advertising revenue surged by 21%. The company’s total revenue increased by 15%, driven by the popularity of Google, Android, and YouTube brands among millions of users worldwide.
The company introduced a new artificial intelligence model, Gemini AI, which is predicted to become a serious competitor to other AI systems and strengthen Alphabet’s position in the technology market.
Is Investing in Alphabet Stock a Good Idea?
Investing in the Alphabet Inc. shares could be promising, given the steady growth in advertising revenue and the success of platforms such as Google and YouTube. Besides, implementing new technologies such as Gemini AI will enhance the company’s standing in the artificial intelligence sector. However, as with any investment, it is important to consider market risks and volatility.
Other Bets
Alphabet Inc. is also engaged in new developments. The Other Bets division develops autopilot cars and smart home devices. In the long term, this will bring additional investments, which will have a positive effect on the stock price.
Google Cloud Platform
One of the main divisions remains the development of cloud storage. This area brings the company a solid income. Further successes will only strengthen Alphabet’s position in the market.
Long-Term Google Stock Predictions for 2027–2030
Google’s long-term outlook for 2027–2030 looks optimistic. The company’s advertising revenue growth, cloud technologies, and the introduction of advanced solutions such as AI and automation are expected to be the primary drivers of its stock price appreciation. Analysts predict stable price growth with possible corrections. Overall, the company will maintain a strong position in the technology market and continue to expand. Factors such as the global dominance of Google and YouTube brands will also bolster the stock price during this period.
| Year | Mid-Year, $ | Year-End, $ | Tod/End, % |
|---|---|---|---|
| 2027 | 224 | 253 | 66% |
| 2028 | 281 | 309 | 103% |
| 2029 | 315 | 318 | 109% |
| 2030 | 342 | 348 | 129% |
Source: CoinPriceForecast
Factors that Can Affect the Google Share Price
Let’s review the factors that can definitely affect the #GOOG price.
- Financial performance. Google’s quarterly earnings, revenue growth, and profitability directly impact its stock price. Strong financial results attract investors’ attention, leading to an increase in the #GOOG value.
- Economic conditions. Global economic conditions, such as recessions or economic growth, can affect advertising spending and, thus, Google’s core revenue. Economic downturns can lead to reduced ad budgets.
- Regulatory landscape. Changes in regulations and antitrust concerns can impact Google’s stock. Legal challenges or requirements to alter business practices can have financial implications.
- Technological advancements. Innovation within the technology industry can shape investor perceptions. Google’s ability to stay at the forefront of technological trends can impact its stock price.
- Competition. Intense competition in the tech sector can affect Google’s market share and profitability. Competitor actions and market dynamics play a role in investor sentiment.
- Currency exchange rates. As an international company, Google is exposed to currency risk. Fluctuations in exchange rates can impact its international revenue and, consequently, stock performance.
- Market sentiment. Investor sentiment and market psychology can drive short-term fluctuations in stock prices. News, rumors, and perceptions can lead to rapid price changes.
- Consumer behavior. Trends in user behavior, such as shifts in search preferences or online advertising habits, can affect Google’s revenue and, consequently, its stock price.
- Monetization strategies. Changes in Google’s strategies for monetizing its services, such as advertising formats or pricing models, can influence its financial performance and stock price.
Conclusion: Are Google (Alphabet) Stocks a Good Investment?
The Alphabet Inc. (Google) stock continues to be an appealing investment due to its strong financials, with a net income of $23.62 billion in Q2 2024. Despite concerns about overvaluation, the company’s continuous revenue growth, dominant market position, and success in advertising and cloud technology instill confidence in its future. Although antitrust risks persist, the launch of products like the Pixel 8 Pro and a sustained recovery in the advertising sector make Alphabet Inc. a promising option for long-term investors.
Google Stock Price Prediction FAQ
#GOOG is trading at $163.75 per share as of 23.09.2024.
Most analysts believe that the future #GOOG price will experience solid growth due to increasing revenue and advancements in areas such as AI. According to various forecasts, the stock price may reach $250–$300 by 2025–2030, reflecting analysts’ confidence in the company’s growth potential and its dominance in the technology market.
Google’s forecasts for 2024 suggest a 10%–15% surge, supported by increased advertising and cloud revenue. The stock price is expected to reach $160–$180 by the year-end, depending on economic conditions and the success of new products.
Forecasts for the Google (Alphabet Inc.) stock in 2025 suggest a consistent upward trend. The stock price is expected to increase by 15%–20%, buoyed by strong financial performance and the development of key areas such as AI and cloud technology. The price is projected to hit $170–$220 by the year-end.
The Alphabet Inc. stock price forecasts for the next five years suggest strong growth fueled by advancements in key areas such as AI, cloud technology, and advertising. Depending on market conditions and economic factors, the stock may reach $300–$350 by 2029–2030, according to analysts’ forecasts.
Some analysts argue that Google’s stock is overvalued, citing high price-to-earnings ratios and current market prices, which may indicate inflated expectations. However, supporters believe that the company’s sustained revenue growth and AI and cloud technology advancements justify its high stock price. The revaluation decision depends on Alphabet’s investment objectives and future growth prospects.
Considering your investment approach is crucial when deciding whether to buy, sell, or hold Google’s stock. If you believe in the company’s long-term growth prospects related to AI, cloud technology, and advertising, holding or buying may be a favorable decision. However, if you believe the stock is overvalued or expect short-term volatility, selling may be appropriate. It is important to consider market conditions and your financial goals when making your decision.
Google (Alphabet Inc.) may be a safe long-term investment due to its stable growth, AI and cloud technology innovations, and strong position in the market. However, risks of volatility and antitrust litigation persist. Therefore, investors should carefully assess their goals and risk tolerance before making decisions.
Price chart of GOOG in real time mode
The content of this article reflects the author’s opinion and does not necessarily reflect the official position of LiteFinance. The material published on this page is provided for informational purposes only and should not be considered as the provision of investment advice for the purposes of Directive 2004/39/EC.
{{value}} ( {{count}} {{title}} )
This post is originally published on LITEFINANCE.


