The article covers the following subjects:
Major Takeaways
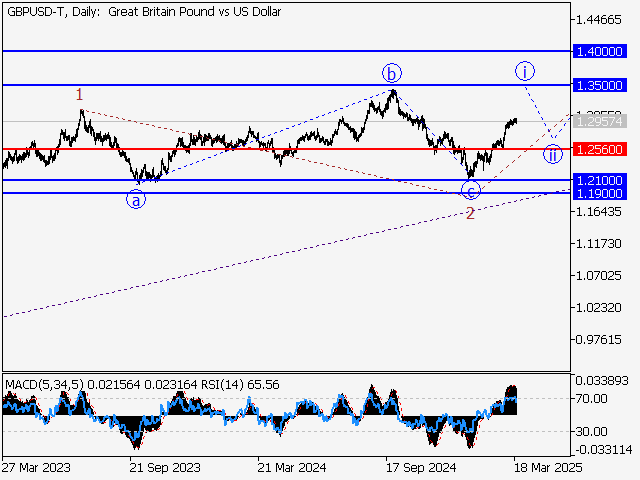
- Main scenario: Consider long positions from corrections above the level of 1.2560 with a target of 1.3500 – 1.4000. A buy signal: the price holds above 1.2560. Stop Loss: below 1.2520, Take Profit: 1.3500 – 1.4000.
- Alternative scenario: Breakout and consolidation below the level of 1.2560 will allow the pair to continue declining to the levels of 1.2100 – 1.1900. A sell signal: the level of 1.2560 is broken to the downside. Stop Loss: above 1.2600, Take Profit: 1.2100 – 1.1900.
Main Scenario
Consider long positions from corrections above the level of 1.2560 with a target of 1.3500 – 1.4000.
Alternative Scenario
Breakdown and consolidation below the level of 1.2560 will allow the pair to continue declining to the levels of 1.2100 – 1.1900.
Analysis
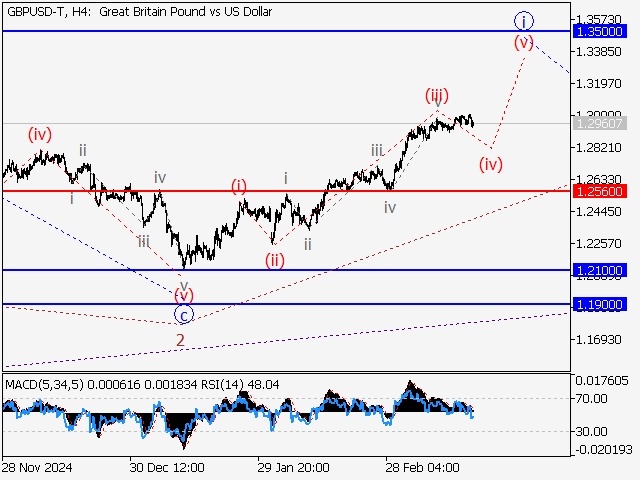
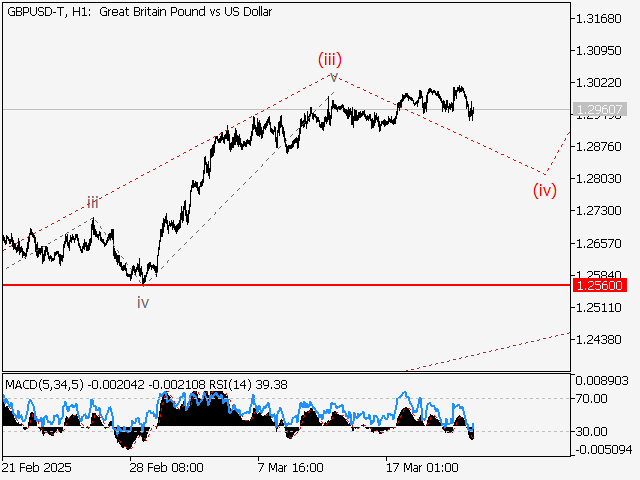
The first ascending wave of larger degree 1 of (A) is formed on the daily chart, and the bearish correction is presumably completed as the second wave 2 of (А). The third wave 3 of (А) has started developing on the H4 time frame, with the first counter-trend wave of smaller degree i of 3 forming as its part. Apparently, wave (iii) of i is formed and a local correction is unfolding as wave (iv) of i on the H1 chart. If the presumption is correct, the GBP/USD pair will continue to rise to the levels of 1.3500 – 1.4000 after the correction ends. The level of 1.2560 is critical in this scenario, as a breakout will enable the pair to continue declining to the levels of 1.2100 – 1.1900.
This forecast is based on the Elliott Wave Theory. When developing trading strategies, it is essential to consider fundamental factors, as the market situation can change at any time.
Price chart of GBPUSD in real time mode
The content of this article reflects the author’s opinion and does not necessarily reflect the official position of LiteFinance broker. The material published on this page is provided for informational purposes only and should not be considered as the provision of investment advice for the purposes of Directive 2014/65/EU.
According to copyright law, this article is considered intellectual property, which includes a prohibition on copying and distributing it without consent.
{{value}} ( {{count}} {{title}} )
This post is originally published on LITEFINANCE.