
Facebook, a renowned social media giant, has seen its stock rise despite controversies, especially in 2020, due to the global health situation. As we enter the Meta platforms era, many wonder about the future of Meta’s stock prices.
This article will explore forecasts and technical evaluations to guide potential investors.
The article covers the following subjects:
Highlights and Key Points: Meta Stock Price Forecast 2024-2030
- Today’s Stock Price: #META stock is trading on NASDAQ, current market price is $472.48.
- Forecast for 2024: #META shares are projected to trade between $493 and $624, with an average price of around $572.
- Price Forecast for 2025: In the first half of 2025, the price may rise to $731 and reach $1 306 within the next six months.
- Long-term forecast for 2027 – 2030: according to CoinPriceForecast, #META shares will climb to $505 by 2027 and hit $624 within the next six months. 2030 will end at around $1 225. Analysts rate #META stock as a strong buy.
The forecast analysis, coupled with the current trading trends and earnings reports, underlines a potentially bullish outlook for Meta shares. With such positive estimates, Meta’s stock is positioned as an attractive option for investors looking at long-term growth within the communication services sector of the stock market.
FB (Meta) Stock Price Today, the coming days and week
When forecasting Meta’s stock price in the near term, focus on several critical factors. Analyze quarterly earnings reports for insights into revenue growth, particularly from advertising and virtual reality segments. Monitor user engagement and growth metrics on Meta’s platforms, as these directly impact advertising revenue. Stay updated on regulatory developments, especially those related to data privacy and antitrust issues, as they can affect operations and market sentiment. Pay attention to advancements and announcements in augmented and virtual reality, which are pivotal to Meta’s future growth. Additionally, consider overall market sentiment towards tech stocks and broader economic indicators influencing investor behavior.
Meta Stock Price Forecast for 2024 by Experts
A detailed analysis of Meta platforms’ financial prospects reveals diverse market predictions. These insights from reputable experts help investors understand the market trends for Meta.
CoinPriceForecast
Price range for 2024: $505 – $624 (as of July 18, 2024)
CoinPriceForecast projects Meta stock to reach $505 by mid-2024 and $624 by year-end. This outlook highlights the market’s positive sentiment toward the company’s stock, signaling optimism about its future market performance and an upward price trend.
| Year | Mid-Year, $ | Year-end, $ |
|---|---|---|
| 2024 | 505 | 624 |
The spectrum of forecasts stretches from a cautious $355.00 to an optimistic $470.00, painting a diverse palette of market sentiment. This short-term analytical horizon needs to unroll to glimpse 2024, yet it seeds a narrative of moderate bullishness.
StockAnalysis
Price range for 2024: $285 – $625 (as of July 18, 2024)
Experts at StockAnalysis are optimistic about the company’s potential. According to the consensus estimate by 40 analysts, the price is expected to decline slightly to $504.02. However, Meta shares will trade between $285 to $625 over the next 12 months. This forecast expresses an optimistic long-term outlook for Facebook shares despite high volatility.
| Year | Minimum, $ | Average price, $ | Maximum, $ |
|---|---|---|---|
| 2024 | 285 | 504.02 | 625 |
PandaForecast
Price range for 2024: $496.21 – $634.64 (as of July 18, 2024)
Meta’s stock price forecasts for the coming months show significant volatility, as PandaForecast states. In August, the average price is expected to be around $531. In September, a surge to $565 is projected. In October the price will rise further, to almost $587. The price will drop in November to $563, but in December it will rise back again, to $586.87. These fluctuations reflect high volatility, but the long-term outlook remains bullish.
| Month | Average price, $ | Minimum, $ | Maximum, $ |
|---|---|---|---|
| August | 531.28 | 496.21 | 557.57 |
| September | 565.17 | 535.95 | 596.26 |
| October | 586.93 | 570.14 | 628.90 |
| November | 566.92 | 552.57 | 606.20 |
| December | 586.87 | 573.31 | 634.64 |
WalletInvestor
Price range for 2024: $483.347 – $493.528 (as of July 18, 2024)
According to WalletInvestor, Meta’s share price in 2024 will be moderately volatile, trading in a relatively narrow range. The price is expected to peak in August, opening at $486.908 and closing at $489.851, with a low and high of $486.101 and $489.891, respectively. September and October will see a slight decline to $483.713, with lows and highs at around $483 – $491. In November and December, the price is expected to slightly recover to $486.814 and $493.131, respectively. Analysts advise investors to remain optimistic.
| Month | Opening, $ | Closing, $ | Minimum, $ | Maximum, $ |
|---|---|---|---|---|
| August | 486.908 | 489.851 | 486.101 | 489.891 |
| September | 491.083 | 484.167 | 483.426 | 491.083 |
| October | 483.653 | 483.713 | 483.347 | 485.589 |
| November | 483.709 | 486.814 | 483.709 | 487.991 |
| December | 487.500 | 493.131 | 486.531 | 493.528 |
LongForecast
Price range for 2024: $425 – $572 (as of July 18, 2024)
LongForecast‘s experts predict a sideways movement for Meta shares in 2024. In August, the price will open at $479 and close at $462, but in September a growth to $499 is predicted. October will see a climb to $530 and in November a decline to $474 is projected. In December, the price may stabilize at $477.
| Month | Opening, $ | Min.-Max.,$ | Closing, $ |
|---|---|---|---|
| August | 479 | 425-532 | 462 |
| September | 462 | 459-539 | 499 |
| October | 499 | 488-572 | 530 |
| November | 530 | 436-530 | 474 |
| December | 474 | 439-515 | 477 |
Meta Stock Technical Analysis
When performing a technical analysis of Meta Platforms’ stocks, it is important to consider different time frames to have a comprehensive picture of price movements. For short-term analysis (intraday), timeframes from 15 minutes to 4 hours are used, which helps to identify short-term trends and opportunities for quick trading. For medium- and long-term estimates, timeframes from a day to a week or a month are considered, allowing one to assess the company’s overall trends and growth prospects.
Moving averages and support/resistance levels are particularly instrumental in analyzing Meta’s shares. Moving averages help determine trend direction and entry/exit points, while support and resistance levels are used to identify price zones where a trend change or a change in price dynamics may occur.
The recommended indicators include MACD (Moving Average Convergence Divergence) and RSI (Relative Strength Index). The MACD helps track changes in trend strength, while the RSI shows how overbought or oversold a stock is, predicting possible reversals.
It is also important to consider price action patterns, such as double tops and bottoms. These patterns can indicate future price movements and help make entry or exit decisions.
These tools and methods allow investors and traders to gain a more objective picture of Meta Platforms stocks’ current health and prospects, a key aspect of successful technical analysis.
Get access to a demo account on an easy-to-use Forex platform without registration
#META Stock Forecast for Next Three Months
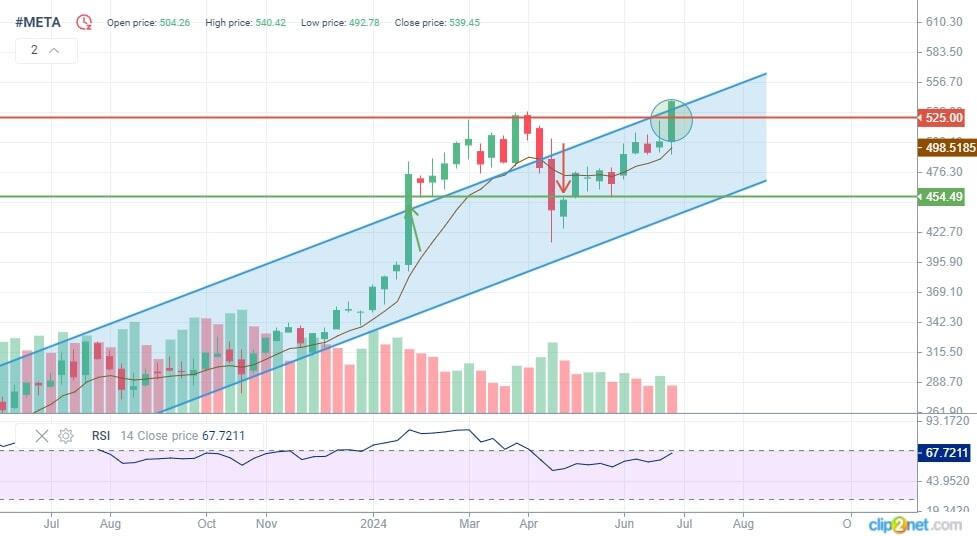
Since November 2022, Meta shares have been in a steady upward range on the daily timeframe. The stocks remained within the ascending channel until February 2, when they exceeded the upper boundary on positive financial reports. A corrective movement occurred between April 25 and July 5, 2024, after which the price rallied to the channel’s peak and closed at a high level.

We can outline several scenarios for the next three months based on current data and past trading sessions. Meta’s shares may continue trending upward and consolidate above the current level. A successful close above the upper boundary of the channel can drive further price growth.

However, possible corrective movements amid downbeat fundamental news or general market volatility are also worth considering. In this case, the support at the channel’s lower border or the support levels of previous sessions may play a key role in maintaining the uptrend. Technical indicators such as moving averages and trend strength indicators can confirm current trends and identify entry or exit points.
Long-Term Meta Shares Technical Analysis for 2024
The weekly timeframe shows interesting technical aspects that may affect Meta stock’s long-term trends. Thus, the EMA is located below the current price, potentially indicating the strength of the uptrend. The RSI is at 67, signaling that the stock is moderately overbought.
The Stochastic readings are 75 and 81, suggesting potential for further gains, although a reading of 75 could also indicate an overbought status.
After the latest crossover, the MACD has seen a decline followed by a divergence, which may mean an upcoming trend reversal. While the price continued growing, the MACD values were negative, potentially indicating a momentum weakness.
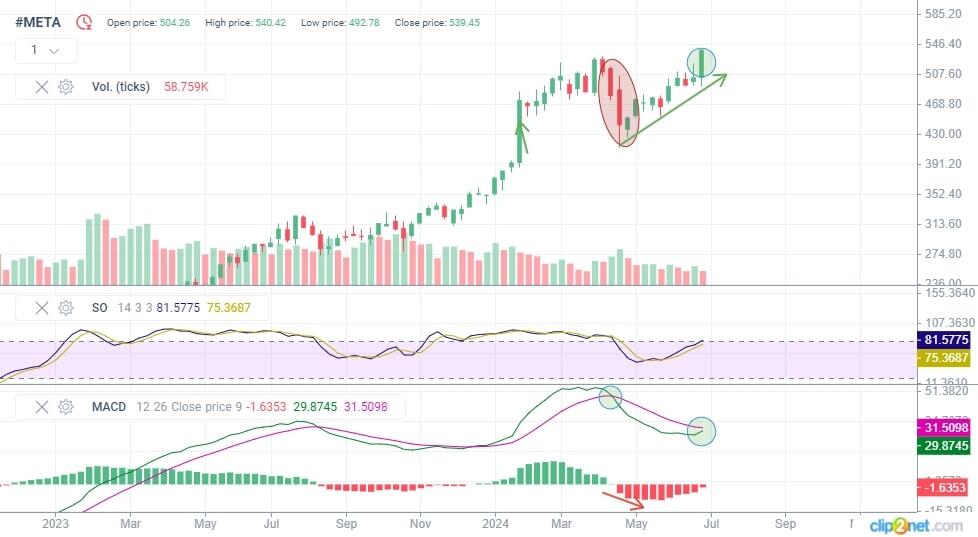
The MACD lines are about to cross again soon, indicating a likely change in the direction of the price movement. The chart requires careful monitoring since a crossover can also signal a possible correction or continuation of the current trend.
Overall, the technical analysis of the weekly timeframe shows that Meta’s shares require additional monitoring to make better-informed investment decisions.
| Month | Meta Platforms Inc. (#META) projected price | |
|---|---|---|
| Minimum, $ | Maximum, $ | |
| August | 512 | 637 |
| September | 583 | 687 |
| October | 620 | 712 |
| November | 542 | 666 |
| December | 555 | 655 |
Long-term trading plan for Meta Platforms Inc. (#META)
A long-term trading plan for Meta Platforms Inc. (#META) includes targets for three months and a year, considering current technical and fundamental aspects.
Three-month targets:
- The price may drop to the support level at around $440-480. This is an excellent opportunity to open or build up longs.
- Set SL and TP at $390 and $700, respectively.
- If the uptrend continues, the 3-month target is at $530-550. This level suggests the price will continue growing after a correction.
One-year targets:
- Long-term target zone: the main goal is to reach $650-700. This level suggests long-term growth potential based on current technical and fundamental data.
- Additional target zone: in case of sustained growth and positive news, the price may rise to $780.
- This is a high level, the achievement of which will depend on general market conditions and the company’s internal factors.
Meta Stock price predictions for 2025
Meta’s 2025 stock price forecasts are controversial. Some experts predict a stable bullish trend and expect growth, while others project a bearish scenario and a possible decline. Exploring and considering differing views will help investors make better-informed trading decisions during high market uncertainty.
CoinPriceForecast
Price range for 2025: $640 – $797 (as of July 18, 2024)
CoinPriceForecast predicts solid growth of #META Platforms’ stock. The price is expected to increase to $640 by mid-2025, indicating a significant positive trend. The estimated price at the end of 2025 will reach $797, which confirms analysts’ confidence in the company’s long-term potential.
| Year | Mid-Year, $ | Year-end, $ |
|---|---|---|
| 2025 | 640 | 797 |
PandaForecast
Price range for 2025: $480.20 – $669.87 (as of July 18, 2024)
The analysis of Meta’s shares by PandaForecast unveils significant price fluctuations. The average price will grow in the first months of the year, reaching a peak in February and March. A decline is projected in April, followed by a gradual decrease until July. The price will stay relatively low over the summer before recovering in September and October. November promises a significant decrease in the average price, indicating high volatility. The price is expected to steady by December despite moderate fluctuations. These forecasts highlight the dynamic nature of the Meta stock market and the importance of thorough monitoring.
| Month | Average price, $ | Minimum, $ | Maximum, $ |
|---|---|---|---|
| January | 559.11 | 544.97 | 578.79 |
| February | 616.31 | 595.97 | 669.87 |
| March | 633.94 | 606.04 | 659.74 |
| April | 613.02 | 563.79 | 640.66 |
| May | 586.04 | 542.85 | 636.97 |
| June | 571.86 | 559.28 | 591.36 |
| July | 519.02 | 480.20 | 548.14 |
| August | 537.86 | 503.55 | 573.95 |
| September | 560.34 | 514.12 | 586.85 |
| October | 604.72 | 587.43 | 633.33 |
| November | 576.12 | 542.53 | 601.47 |
| December | 619.21 | 582.43 | 668.94 |
WalletInvestor
Price range for 2025: $492.889 – $530.932 (as of July 18, 2024)
The analysis of Meta’s shares by WalletInvestor for 2025 unveils significant price fluctuations. At the beginning of the year, the shares will trade between $493 and $501, indicating a moderate uptrend. In the following months, slight fluctuations are expected, gradually increasing by December to $528. Periods of growth and slight declines are forecast throughout the year, with a peak in July and a decrease in September.
| Month | Opening, $ | Closing, $ | Minimum, $ | Maximum, $ |
|---|---|---|---|---|
| January | 492.889 | 500.933 | 492.889 | 500.933 |
| February | 502.598 | 500.794 | 500.794 | 503.065 |
| March | 501.763 | 506.464 | 500.945 | 506.464 |
| April | 506.366 | 509.623 | 506.366 | 511.223 |
| May | 509.724 | 519.726 | 509.724 | 520.146 |
| June | 520.820 | 530.688 | 520.067 | 530.688 |
| July | 530.353 | 522.804 | 522.804 | 530.932 |
| August | 522.588 | 525.289 | 521.804 | 525.289 |
| September | 526.656 | 519.300 | 519.272 | 526.656 |
| October | 518.953 | 519.347 | 518.953 | 521.181 |
| November | 520.396 | 522.582 | 519.743 | 523.697 |
| December | 523.248 | 528.407 | 522.187 | 528.990 |
LongForecast
Price range for 2025: $477 – $1 410 (as of July 18, 2024)
LongForecast suggests that Meta’s stock price will be steadily rising throughout 2025. Opening at $477 in January, the stock will reach $549. February will continue the uptrend, closing at $612. In March and April, the price will continue rising, reaching $667 and $695, respectively. Big jump is expected in May, with shares closing at $722. A peak of $1 410 is expected in December, indicating growing investors’ confidence.
| Month | Opening, $ | Min.-Max.,$ | Closing, $ |
|---|---|---|---|
| January | 477 | 477-593 | 549 |
| February | 549 | 549-661 | 612 |
| March | 612 | 612-720 | 667 |
| April | 667 | 639-751 | 695 |
| May | 695 | 664-780 | 722 |
| June | 722 | 673-789 | 731 |
| July | 731 | 686-806 | 746 |
| August | 746 | 746-906 | 839 |
| September | 839 | 812-954 | 883 |
| October | 883 | 883-1 069 | 990 |
| November | 990 | 990-1 227 | 1 136 |
| December | 1136 | 1136-1 410 | 1 306 |
Meta Stock price predictions for 2026
This section summarizes the 2026 stock predictions for Meta stock using data from financial platforms such as CoinPriceForecast, PandaForecast, and WalletInvestor. These insights are speculative and influenced by various market dynamics. They offer potential guidance for long-term tech investments.
CoinPriceForecast
Price range in 2026: $969 – $1 048 (as of July 18, 2024)
According to CoinPriceForecast, Meta’s share price is projected to rise significantly in 2026. January is expected to open at $797. Then, the price will rise to $969 within the next six months and reach $1 048 by year-end. This outlook highlights the company’s strong market potential.
| Year | Mid-Year, $ | Year-end, $ |
|---|---|---|
| 2026 | 969 | 1 048 |
PandaForecast
Price range in 2026: $557.23 – $778.39 (as of July 18, 2024)
PandaForecast anticipates that Meta’s share price will demonstrate an uptrend throughout the year, though some fluctuations are expected. Starting at $600.14 in January, price will peak at $730.31 in October. The largest increase is expected in July, while the smallest increase is projected in August. The year will be marked by positive growth dynamics, highlighting the investment potential of Meta shares in a volatile financial market.
| Month | Average price, $ | Minimum, $ | Maximum, $ |
|---|---|---|---|
| January | 600.14 | 557.23 | 637.77 |
| February | 648.33 | 629.08 | 693.26 |
| March | 682.57 | 639.02 | 735.12 |
| April | 613.49 | 564.23 | 646.56 |
| May | 599.32 | 569.65 | 626.35 |
| June | 604.59 | 566.68 | 629.86 |
| July | 608.58 | 587.16 | 636.03 |
| August | 640.05 | 609.07 | 675.25 |
| September | 686.51 | 626.86 | 719.74 |
| October | 730.31 | 688.54 | 773.69 |
| November | 719.07 | 686.64 | 778.39 |
| December | 653.42 | 600.95 | 697.98 |
WalletInvestor
Price range in 2026: $528.552 – $566.747 (as of July 18, 2024)
WalletInvestor forecasts a sideways trend with minor fluctuations in Meta’s share price. The level of $536.190 is expected at the beginning of the year, with an increase to $564.063 by December. The stock will trade between $529 and $567 throughout 2026. This trend suggests traders should be cautious when making short-term trades due to possible volatility. Long-term investors can wait for a better time to buy or diversify their investment portfolios.
| Month | Opening, $ | Closing, $ | Minimum, $ | Maximum, $ |
|---|---|---|---|---|
| January | 528.552 | 536.190 | 528.552 | 536.190 |
| February | 537.989 | 536.458 | 536.458 | 538.769 |
| March | 537.394 | 541.488 | 536.563 | 541.599 |
| April | 541.564 | 545.301 | 541.564 | 546.910 |
| May | 545.337 | 555.285 | 545.337 | 555.562 |
| June | 556.413 | 565.762 | 555.641 | 566.029 |
| July | 565.616 | 558.490 | 558.490 | 566.747 |
| August | 558.877 | 562.167 | 557.486 | 562.167 |
| September | 561.762 | 554.610 | 554.610 | 562.185 |
| October | 554.637 | 555.029 | 554.637 | 556.886 |
| November | 555.971 | 559.012 | 555.247 | 559.368 |
| December | 558.400 | 564.063 | 557.869 | 564.413 |
LongForecast
Price range for 2026: $1 235 – $2 111 (as of July 18, 2024)
LongForecast suggests that Meta’s stock price will be significantly volatile in 2026. The stock will continue fluctuating after opening at $1 306 in January and peaking at $2 111 in April. Intense price moves are expected to continue in the next months, with the price dropping to $1 413 in June and closing at $1 275 by December. The year will be a trial for both short-term and long-term investors, requiring careful planning and adjusting of investment strategies amid high market volatility.
| Month | Opening, $ | Min.-Max.,$ | Closing, $ |
|---|---|---|---|
| January | 1 306 | 1 306-1 597 | 1 479 |
| February | 1 479 | 1 479-1 837 | 1 701 |
| March | 1 701 | 1 564-1 836 | 1 700 |
| April | 1 700 | 1 700-2 111 | 1 955 |
| May | 1 955 | 1 529-1 955 | 1 662 |
| June | 1 662 | 1 300-1 662 | 1 413 |
| July | 1 413 | 1 344-1 578 | 1 461 |
| August | 1 461 | 1 343-1 577 | 1 460 |
| September | 1 460 | 1 142-1 460 | 1 241 |
| October | 1 241 | 1 235-1 449 | 1 342 |
| November | 1 342 | 1 312-1 540 | 1 426 |
| December | 1 426 | 1 173-1 426 | 1 275 |
Facebook Stock Price: History
In financial forecasting, historical data serves as an invaluable compass. It’s through this lens that we gain insights into the past fluctuations and trends of Meta stock.
Since its 2004 inception, Facebook has become the 3rd top global website, trailing only Google and YouTube. Located in Palo Alto and led by Mark Zuckerberg, the firm owns not just Facebook, but also Instagram, WhatsApp, and Oculus VR.
By Q1 2018, Facebook’s growth was evident. Revenues reached $12.4 billion, an increase from $9.5 billion the prior year. The subsequent chart displays Facebook’s robust financial progress over the years.
Since its 2012 IPO, Facebook’s stock trajectory has mainly been positive. From an approximate share price of $20 in November 2012, its value has significantly grown. In October 2021, Facebook rebranded to Meta, emphasizing Zuckerberg’s vision of a virtual Metaverse and an expanded ecosystem.
In 2022, Meta Platforms saw its stock price decline due to heavy investment in the Metaverse, economic challenges, and increased competition. However, in 2023, the stock began to recover thanks to strategic adjustments and an improving economic climate, despite ongoing challenges in the tech sector.
Long Term Meta (FB) Stock Price Forecast 2026-2030
Based on Meta’s projected share prices from 2027 to 2030, the company shows significant growth potential. Analysts predict a steady upward trend, with the share price rising to $624 by the end of 2027 and $1 225 by the end of 2030. This growth is driven by the company’s technological advancements, successful strategy, and favorable economic conditions. Given the high demand for social networks and their rapid development pace, investors can expect good returns from investing in Meta shares in the next five years.
| Year | Mid-Year, $ | Year-end, $ |
|---|---|---|
| 2027 | 505 | 624 |
| 2028 | 640 | 797 |
| 2029 | 969 | 1 048 |
| 2030 | 1 085 | 1 225 |
Source: CoinPriceForecast
Factors that May Affect the Facebook Stock Price
Facebook frequently finds itself under media scrutiny, occasionally for contentious reasons such as disseminating conspiracy theories and concerns over user data handling. These significant headlines and occurrences undeniably have ripple effects on the company’s stock price.
1. “Russian influence” in the 2016 US election
The tumult surrounding the 2016 US election intensified when allegations of Russian interference emerged, prompting extensive investigations. Key among the revelations was Facebook’s involvement in selling ads to Russian entities, purportedly influencing the election’s outcome.
These ads, totaling over $80,000, breached the platform’s guidelines. Consequently, Facebook’s stock faced significant pressure, witnessing a sharp decline in 2018 amidst the uproar.
2. The FTC sued Facebook
In December 2020, the Federal Trade Commission (FTC) initiated legal action against Facebook, accusing the tech behemoth of maintaining an illegal monopoly and inadequately safeguarding user privacy. The FTC’s contention revolves around urging Facebook to divest from its acquisitions like WhatsApp and Instagram, thereby decentralizing its data pool.

Additionally, they seek to impose restrictions on Facebook’s future acquisitions. While a successful lawsuit could pose notable implications for Facebook’s stock, the prevailing sentiment suggests the platform might only face a substantial monetary penalty.
Conclusion: Are Facebook Stocks a Good Investment?
Meta (formerly Facebook) stock represents an exciting investment opportunity, given its leading position in the social media market and continued technological innovation. Projected share price growth through 2030 confirms the investor potential. The company continues introducing the latest technologies, such as virtual reality and artificial intelligence, contributing to its stable development and strengthening its market position. Most experts and analysts anticipate a bullish trend for Meta stock in the short and long term. Investing in Meta Platforms can be attractive due to the company’s strong position, diversified revenues, and ongoing innovation supporting its global reach.
FAQs on Meta Stock Predictions
As of today, 18.07.2024, #META stocks are trading at $472.48 per share.
Meta’s 2025 stock price forecast assumes moderate growth based on current trends and market analysis. According to LongForecast, a level of around $549 is expected in early 2025, with a gradual increase to $1 306 by year-end. This forecast is based on Meta’s expected business development and technological innovations that could impact the company’s financial performance and share price.
Based on current trends and forecasts and the company’s focus on developing virtual reality and artificial intelligence technologies, Meta’s share price will continue to rise. In 5 years, the price will depend on how the company handles market challenges and opportunities and may differ significantly from the current level.
Meta’s 2030 share price forecast indicates significant growth driven by technological innovation and sustainable business development. The company is expected to successfully use its potential and grow in value. Several analysts say the price will range between $1 085 and $1 225.
According to the 12-month forecast, the average price will be $572. Meta is expected to trade between $493 and $624.
Based on the financial data provided, we can conclude that the company’s net profit has been steadily growing since 2020. Revenues and gross margins show sustained growth, reflecting the company’s strong operating performance. Net earnings per share also show positive dynamics, suggesting that the current market value reflects the company’s merits.
Investing in Meta is promising as the company plays a leading role in the social media and innovation sector. Since 2012, Facebook’s stock price has risen significantly. By 2024, the growth was more than 1,500%. Meta is expected to be a good investment in 2024, but it is important to consider high competition and technology trends.

The content of this article reflects the author’s opinion and does not necessarily reflect the official position of LiteFinance. The material published on this page is provided for informational purposes only and should not be considered as the provision of investment advice for the purposes of Directive 2004/39/EC.
{{value}} ( {{count}} {{title}} )
This post is originally published on LITEFINANCE.


