The EURJPY currency pair is a magnet for traders due to its intriguing volatility. It represents a blend of two significant world economies – the EU and Japan – and is subject to the whims of global economic health, monetary policies, and market sentiment. Experts suggest a bullish trend over the upcoming years.
This article provides the EURJPY technical analysis, as well as various expert forecasts. Thus, you will be able to develop a reliable trading plan, increasing your chances of getting profits when trading the EURJPY pair.
The article covers the following subjects:
Highlights and Key Points
- The EURJPY pair is trading around ¥162.758.
- By the end of 2024, forecasts predict a ¥175.4 – ¥180.0 range.
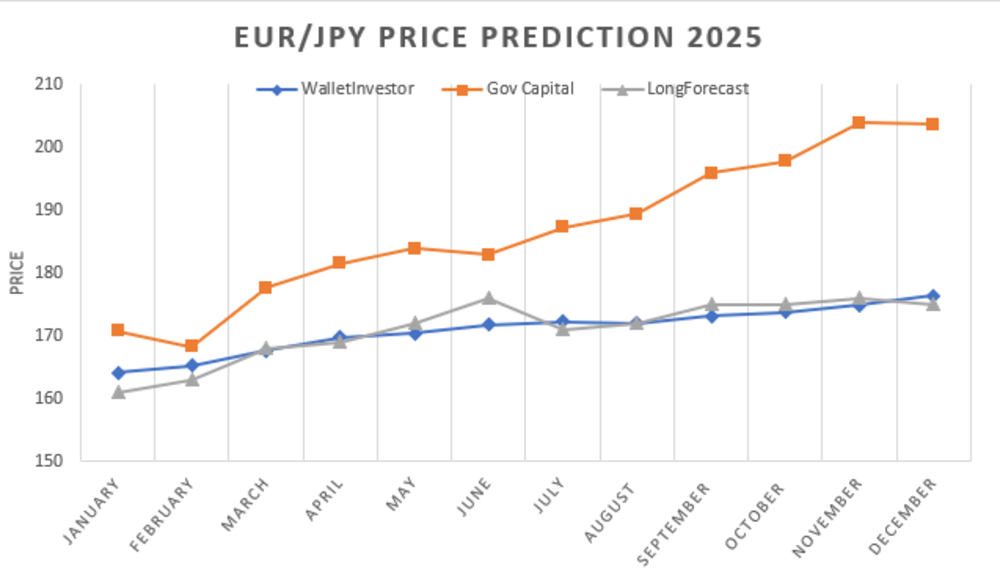
- In 2025, the EURJPY pair will range between ¥163.358 – ¥176.348, according to WalletInvestor. LongForecast expects the rate to stand in the area of ¥159 – ¥179.
- According to Gov Capital, the pair’s quotes will rise from ¥239 to ¥368.09 in 2027–2030. The euro is projected to strengthen, and the Japanese yen is anticipated to depreciate.
- Overall, the EURJPY pair maintains a long-term bullish trend, buoyed by the euro’s high yield appeal. However, your trading strategy should also take into account elevated volatility due to EU and Japanese monetary policy shifts.
EURJPY Price Today, in Coming Days and Week
When forecasting the EURJPY exchange rate in the coming days and weeks, monitor key economic indicators and policy decisions from the European Central Bank and the Bank of Japan. Look for data on inflation, GDP growth, and employment rates from both countries. Political events in Europe and Japan, as well as global geopolitical developments, can also affect the currency pair. Additionally, use technical analysis tools such as Moving Averages, the RSI, and MACD to identify trends and potential reversals in the exchange rate.
EURJPY Forecast for 2024 – Expert Predictions
Let’s review EURJPY’s expert forecasts for 2024. Most analysts expect the uptrend to continue.
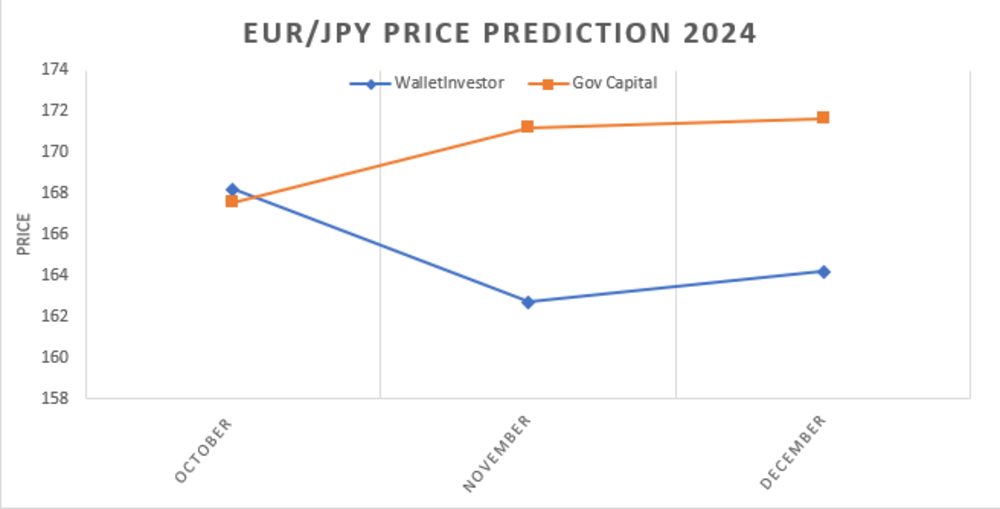
WalletInvestor
Price range: ¥161.623 – ¥164.169 (as of 26.09.2024).
WalletInvestor forecasts a positive outlook for the EURJPY pair, with consistent growth anticipated at the end of the year.
| Month | Open, ¥ | Close, ¥ | Minimum,¥ | Maximum, ¥ | Change |
|---|---|---|---|---|---|
|
November |
161.623 |
162.711 |
161.623 |
162.711 |
0.67 % ▲ |
|
December |
162.741 |
164.113 |
162.741 |
164.169 |
0.84 % ▲ |
Gov Capital
Price range: ¥155,85 – ¥171,63 (as of 26.09.2024).
Gov Capital experts predict a solid growth towards 171.63, making the EURJPY pair a promising investment.
EURJPY Technical Analysis
Technical analysis of the EURJPY pair involves using various time frames and tools to identify trends and potential pivot points. It is advisable to assess the overall trend on higher time frames, such as weekly and monthly, using the RSI, MACD, and Stochastic indicators.
- MACD helps to identify pivot points, especially on higher time frames.
- RSI (14) is used to identify the overbought and oversold zones and potential pivot points.
- Stochastic helps assess the overbought and oversold conditions.
“Head and shoulders,” “Double Bottom,” “Flag” chart patterns, and candlestick formations can signal potential reversals or trend continuation. It is important to combine indicators and patterns with support and resistance levels for more accurate analysis.
Get access to a demo account on an easy-to-use Forex platform without registration
EURJPY Analysis for Next Three Months
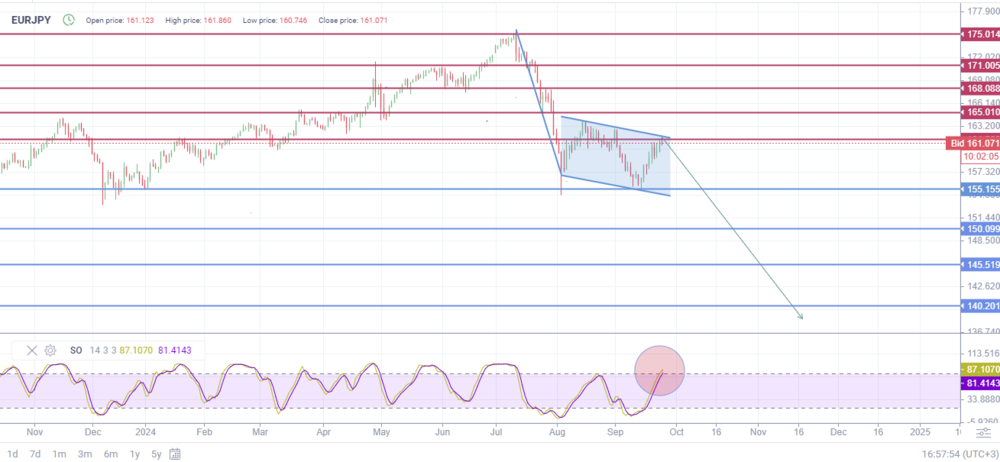
The daily chart shows that the EURJPY pair is experiencing significant volatility at the end of September 2024. The asset is trading within the 158.00 – 160.00 range, and its recent performance indicates both selling and buying pressure.
The 155–156 range is the key support level. A “Descending triangle” pattern is forming with the lower boundary at 155.00. If the price breaks through this boundary, the pair may test the 150.00 level, indicating a potential further decline. Additionally, the stochastic indicator is in the overbought zone above 80, strengthening the probability of a bearish scenario.
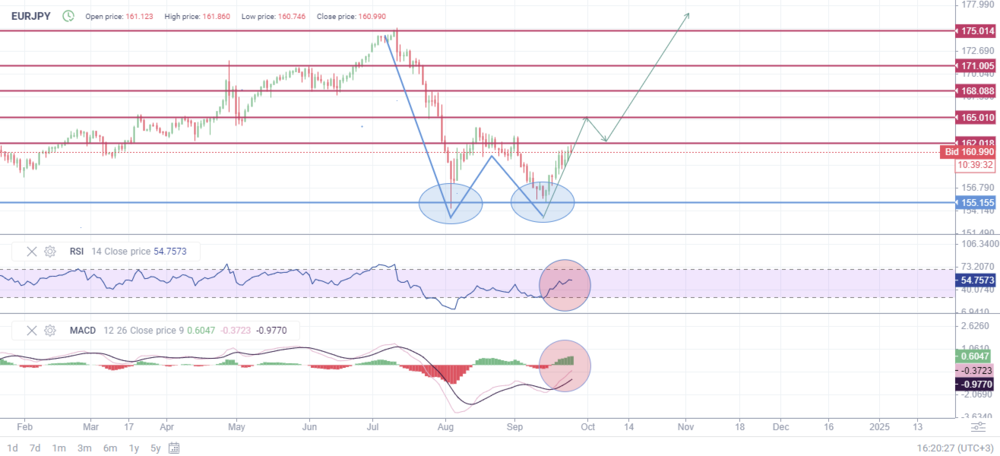
Meanwhile, the key resistance is in the 161–162 range. A potential “Double bottom” pattern is in progress. If this pattern results in a 161–162 level breakout, the growth will continue, and the price will test the 168.00 and 171.00 levels.
The MACD line is at -0.38 above the signal line, which is at -0.97, while the histogram is in the positive zone at 0.6. The indicator suggests that the price is recovering from the decline and has the potential for further growth. However, the final trend reversal has not been confirmed yet.
The RSI is in the neutral zone, indicating uncertainty regarding further trend direction.
Long-Term EURJPY Technical Analysis for 2024–2025
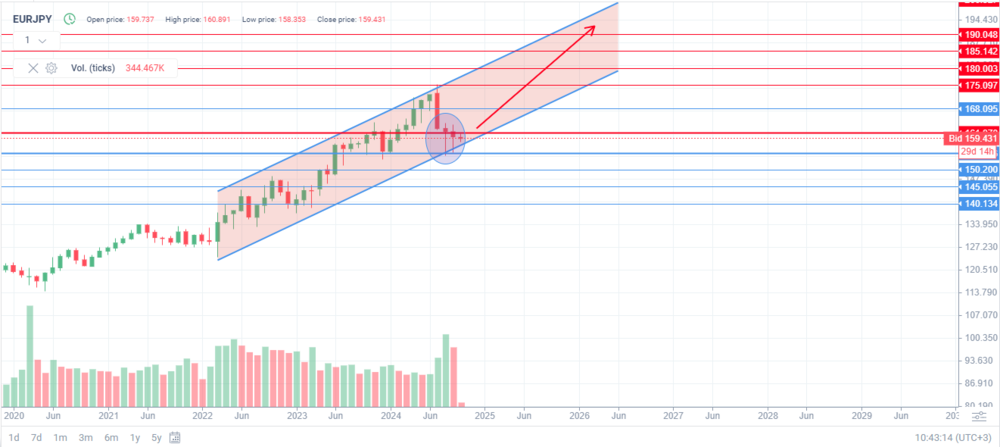
The monthly EURJPY time frame reveals an uptrend despite the current price consolidation. Notably, the two bullish pin bars at the key support level indicate a repeated reaction of buyers to the price decline, signaling that the level of 155 is strong.
The chart displays a stable ascending channel that started to form in the middle of 2022, confirming a long-term trend. The upper and lower boundaries of the channel can help identify the overbought and oversold zones. The price is trading closer to the lower boundary of the channel, pointing to a favorable risk/reward ratio for long trades.
Based on the analysis, the price may return to 168.00 and higher in the coming months. By the end of 2025, the price may climb to the 190.00 level.
The pair may retreat within the channel, but the overall performance indicates the continuation of the growth. If the price pierces the 155.00 level from above, the uptrend may reverse. However, this scenario seems less probable at the moment.
| Month | EURJPY Projected Values | |
|---|---|---|
| Minimum, ¥ | Maximum, ¥ | |
|
October 2024 |
158,00 |
165,10 |
|
November 2024 |
162,10 |
168,00 |
|
December 2024 |
168,00 |
171,00 |
|
January 2025 |
171,00 |
175.00 |
|
February 2025 |
175.00 |
170.00 |
|
March 2025 |
169.00 |
172.00 |
|
April 2025 |
172.00 |
175.00 |
|
May 2025 |
175.00 |
179.00 |
|
June 2025 |
179.00 |
181.00 |
|
July 2025 |
181.00 |
183.00 |
|
August 2025 |
180.00 |
185.00 |
|
September 2025 |
185.00 |
190.00 |
Long-Term Trading Plan for EURJPY
Let’s review the trading plan based on the technical analysis conducted above.
Bullish Scenario
- Resistance level: if the price breaks through the resistance 161.50–162.00 and a “Double bottom” pattern is confirmed on the daily chart, consider long trades.
- Targets. The first target is 168.00. If the growth continues, the asset may test the 175.00 and 180.00 marks.
- Confirmation: positive MACD crossover and stochastic’s exit from the overbought zone confirm the bullish scenario. Additional confirmation: two bullish pin bars are formed on the monthly chart.
- A stop-loss order is set below 158.50 to avoid losses in case of a false breakout of the 161.50–162.00 level.
Bearish Scenario.
- Support level: if the price breaches the “Descending triangle’s” lower boundary of 155.00, consider short trades.
- Targets. The first target is 150.00. In case of further decline, the asset may test the 145.00 and 140.00 levels.
- Confirmation: if the MACD line crosses the signal line from above, and the stochastic indicator remains in the overbought zone, the downtrend may be confirmed.
- A stop-loss order is set above 157.50 to avoid losses in case of a false breakout of the 155.00 level.
EURJPY Forecast for 2025 – Expert Predictions
Most analysts expect the price to continue to rise. However, analysts are divided on the pace at which the EURJPY pair will grow.
WalletInvestor
Price range: ¥163.358 – ¥176.348 (as of 26.09.2024).
WalletInvestor analysts predict the continuation of the EURJPY uptrend. The pair is expected to start the year at 164.117 and rise to 176.348. The forecast suggests a gradual rise in the exchange rate with minor monthly fluctuations.
| Date | Open, ¥ | Close, ¥ | Minimum, ¥ | Maximum, ¥ |
|---|---|---|---|---|
|
January |
164.117 |
163.659 |
163.358 |
164.117 |
|
February |
163.745 |
165.208 |
163.745 |
165.208 |
|
March |
165.268 |
167.630 |
165.268 |
167.630 |
|
April |
167.724 |
169.744 |
167.724 |
169.744 |
|
May |
169.733 |
170.433 |
169.591 |
170.433 |
|
June |
170.486 |
171.709 |
170.486 |
171.709 |
|
July |
171.738 |
172.016 |
171.738 |
172.219 |
|
August |
171.987 |
171.936 |
171.743 |
171.987 |
|
September |
171.967 |
173.143 |
171.967 |
173.143 |
|
October |
173.186 |
173.76 |
173.185 |
173.765 |
|
November |
173.821 |
174.846 |
173.820 |
174.846 |
|
December |
174.911 |
176.324 |
174.911 |
176.348 |
Gov Capital
Price range: ¥153,95 – ¥203,86 (as of 26.09.2024).
Gov Capital expects an uptrend in EURJPY in 2025, with the average rate at 178.835.
LongForecast
Price range: ¥159 – ¥179 (as of 26.09.2024).
According to LongForecast, the EURJPY pair is predicted to be highly volatile, with the exchange rate ranging from ¥159 to ¥179. The overall trend will be moderately upward.
| Month | Open, ¥ | Min–Max, ¥ | Close, ¥ |
|---|---|---|---|
|
January |
159 |
159-163 |
161 |
|
February |
161 |
161-165 |
163 |
|
March |
163 |
163-171 |
168 |
|
April |
168 |
166-172 |
169 |
|
May |
169 |
169-175 |
172 |
|
June |
172 |
172-179 |
176 |
|
July |
176 |
168-176 |
171 |
|
August |
171 |
169-175 |
172 |
|
September |
172 |
172-178 |
175 |
|
October |
175 |
172-178 |
175 |
|
November |
175 |
173-179 |
176 |
|
December |
176 |
172-178 |
175 |
EURJPY Forecast for 2026 – Expert Predictions
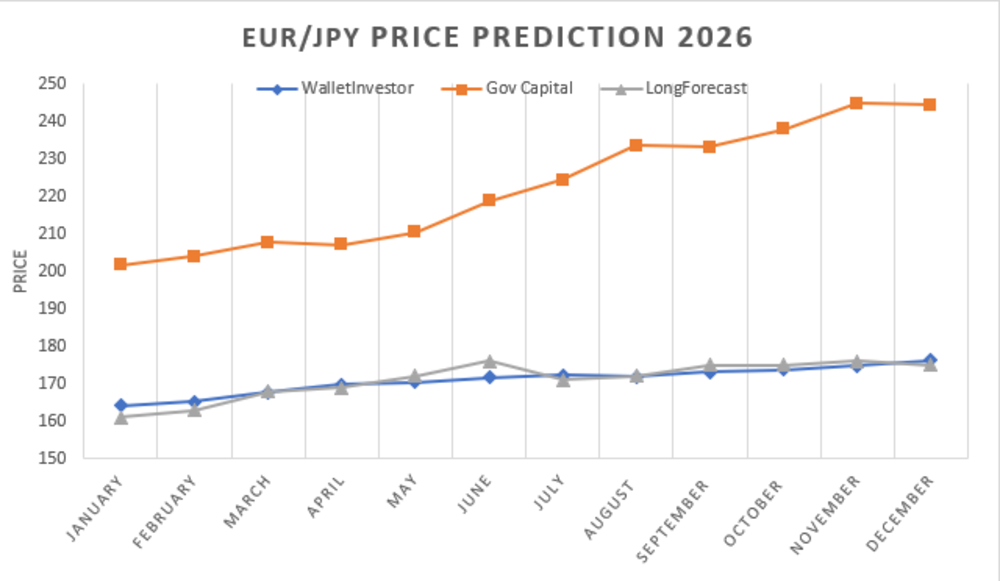
Analysts expect the uptrend in EURJPY to continue. At the same time, some analysts predict high volatility.
WalletInvestor
Price range: ¥175.544 – ¥188.523 (as of 26.09.2024).
Walletinvestor projects a gradual ascent for the EURJPY pair throughout 2026. In January, the rate will stand at 176.287, increasing to 187.081 in December.
| Month | Open, ¥ | Close, ¥ | Minimum, ¥ | Maximum, ¥ |
|---|---|---|---|---|
|
January |
176.287 |
175.850 |
175.544 |
176.287 |
|
February |
175.879 |
177.405 |
175.879 |
177.405 |
|
March |
177.408 |
179.792 |
177.408 |
179.792 |
|
April |
179.908 |
181.905 |
179.908 |
181.909 |
|
May |
181.911 |
182.561 |
181.771 |
182.561 |
|
June |
182.651 |
183.888 |
182.651 |
183.888 |
|
July |
183.937 |
184.202 |
183.937 |
184.394 |
|
August |
184.199 |
184.115 |
183.926 |
184.199 |
|
September |
184.145 |
185.344 |
184.145 |
185.344 |
|
October |
185.346 |
185.962 |
185.346 |
185.962 |
|
November |
185.962 |
187.016 |
185.962 |
187.016 |
|
December |
187.081 |
188.492 |
187.081 |
188.523 |
Gov Capital
Price range: ¥186,26 – ¥244,78 (as of 26.09.2024).
Analysts at Gov Capital predict a bullish EURJPY rate with the target at 244,78.
LongForecast
Price range: ¥175 – ¥197 (as of 26.09.2024).
LongForecast expects moderate fluctuations in the EURJPY pair in 2026, with the price trading between ¥175 and ¥197. Overall, stable growth is projected.
| Month | Open, ¥ | Min–Max, ¥ | Close, ¥ |
|---|---|---|---|
|
January |
175 |
175-183 |
180 |
|
February |
180 |
176-182 |
179 |
|
March |
179 |
179-187 |
184 |
|
April |
184 |
181-187 |
184 |
|
May |
184 |
184-191 |
188 |
|
June |
188 |
186-192 |
189 |
|
July |
189 |
182-189 |
185 |
|
August |
185 |
178-185 |
181 |
|
September |
181 |
181-189 |
186 |
|
October |
186 |
186-192 |
189 |
|
November |
189 |
189-197 |
194 |
|
December |
194 |
185-194 |
188 |
Recent Price History of the EURJPY Pair
Over the past several years, the EURJPY pair has experienced significant highs and lows shaped by economic and geopolitical developments. The pricing trended downward in 2018, hit by the strengthening dollar and trade tensions, before rebounding in 2019–2020 on improved eurozone growth forecasts. The bullish momentum stalled in 2021 amidst Covid-induced slowdowns but regained steam eventually.
However, higher inflation dampened growth projections in the second half. Recently, the pricing has settled into the ¥146 – ¥157 range bound by the tightening monetary policies of respective central banks. The technical analysis shows that historical support and resistance levels continue to sway.
Long-Term EURJPY Forecast for 2027–2030
Wallet Investor forecasts stable growth for the EURJPY pair to around ¥221.59 by 2029.
Gov Capital offers a bolder forecast. Analysts expect significant growth, with the price hitting ¥368.09 by 2027–2030, suggesting a significant appreciation of the euro against the yen.
Long Forecast provides a more moderate outlook. In 2027, the EURJPY exchange rate will range between ¥187 and ¥212, with the increase expected to continue through 2028.
Overall, the forecasts indicate a long-term uptrend for the EURJPY pair, although the projected growth rates vary among experts. Besides, potential volatility due to changes in economic policy in the EU and Japan should be taken into account.
Which Factors Impact EURJPY Price?
- European Central Bank interest rate decisions. The ECB has been hiking rates to combat high inflation in the eurozone. Further rate hikes could support the euro.
- Bank of Japan yield curve control policy. The BOJ aims to keep Japanese bond yields low to stimulate growth. Any changes by the BOJ could significantly impact the yen.
- Risk sentiment and growth outlook. As a safe-haven currency, the yen strengthens during market uncertainty. Improving global growth prospects tend to favor higher-yielding currencies like the euro.
- Relative monetary policy outlook. The policy divergence between ECB and BOJ could drive capital flows between the euro and yen.
Conclusion: Is EURJPY Still a Good Investment?
Based on the analysis and forecasts, the EURJPY currency pair remains a potentially profitable investment option, albeit with some risk. The modest bullish outlook suggests the possibility of gains if global economic conditions remain relatively stable. However, higher volatility is possible due to inflation, posing challenges for the European Central Bank and the Bank of Japan.
Analysts indicate a long-term uptrend in the EURJPY pair due to the strengthening of the euro and the weakening of the yen. Nevertheless, possible fluctuations caused by changes in economic policy should be taken into account.
FAQs on EURJPY Forecast
The EURJPY is trading at around ¥162.758 as of 15.10.2024.
The price is expected to break through the 161–162 level soon and then rise to 180,000 by the end of 2024.
Based on various forecasts, the EURJPY exchange rate will gradually appreciate in 2025. The price is projected to range between ¥175.544 and ¥185.344.
The most favorable time to trade EURJPY typically aligns with the active trading sessions when the European and Asian markets overlap. This usually occurs during the morning hours in Europe and the evening hours in Japan.
The EURJPY exchange rate experiences the highest volatility when trading sessions overlap, especially during the morning hours in Europe and the evening hours in Japan. Additionally, significant events such as the release of economic data or official central bank statements can markedly increase volatility. The most volatile days for EURJPY are Monday, Wednesday, and Friday.
The EURJPY forecast is swayed by monetary policy from the ECB and BOJ, the eurozone inflation trends, and global risk sentiment.
Upcoming ECB rate decisions, Japan CPI and GDP data, geopolitical developments, and broad risk appetite could impact EURJPY pricing.
The EURJPY exchange rate correlates with several financial instruments, including the EURUSD and USDJPY pairs and the DAX and Nikkei stock indices.
EURJPY forecasting analyzes the relative monetary policies and economic situations in Europe and Japan, while USDJPY examines divergences between the US and Japan’s fundamental data.
The key risks include changes in central bank monetary policy, volatility spikes, and economic data that invalidate projections. Therefore, it is vital to follow risk management rules when trading and to diversify your investment portfolio.
Widening rate differentials between the EU and Japan drive capital flows from the low-yield yen to the euro, strengthening EURJPY.
Price chart of EURJPY in real time mode
The content of this article reflects the author’s opinion and does not necessarily reflect the official position of LiteFinance. The material published on this page is provided for informational purposes only and should not be considered as the provision of investment advice for the purposes of Directive 2004/39/EC.
{{value}} ( {{count}} {{title}} )
This post is originally published on LITEFINANCE.

