
The Donchian Channel is a widely used technical analysis tool that helps traders identify trends and determine optimal entry and exit points. This indicator relies on bullish and bearish extremes over a specified period. The Donchian Channel is an ideal tool for trend trading when a trend direction is clearly defined.
This article examines the Donchian Channel indicator’s functionality, the strategies that can be developed based on it, as well as the indicator’s advantages and disadvantages.
The article covers the following subjects:
Major Takeaways
-
Richard Donchian developed his indicator in the mid-20th century. While the exact date of its creation is unknown, the tool was actively used in trading as early as the 1950s.
-
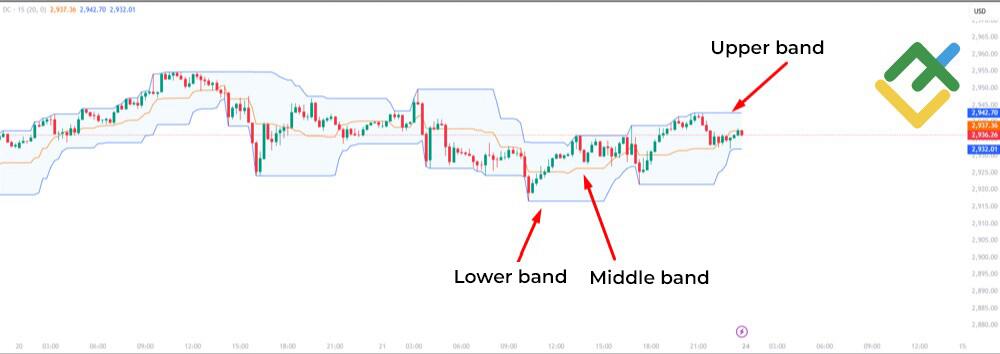
The indicator consists of three lines: the upper band (high), the lower band (low), and the middle band (median).
-
The indicator is effective in trending markets but can give false signals in flat markets.
-
Popular strategies include breakouts, returns to the middle line, and range-bound trading.
-
To enhance the precision of signals, it is advisable to use Donchian channels with the best technical indicators such as the RSI, MACD, or ATR.
-
The choice of channel period (e.g., 20, 10, or 50 candlesticks) affects the indicator’s sensitivity: lower periods better suit scalping, while higher periods are optimal for long-term trading.
-
The primary risks associated with this strategy include false breakouts and signal delays, especially in rapidly moving financial markets.
Understanding the Donchian Channels Formula and Calculation
The Donchian Channel is a straightforward yet technically sophisticated tool developed by Richard Donchian. It assists traders in identifying price trends and determining optimal entry and exit points. The primary objective of the indicator is to draw a channel based on the highest and lowest prices over a specified period.
The formula for Donchian channels
The Donchian channel is made up of three bands:
- The upper band is the highest price over the last N periods (for example, 20 candlesticks).
- The lower band is the lowest price over the last N periods.
- The middle band is the average value between the upper and lower bands.
The formula for the Donchian channel is as follows:
Middle Band = (Upper Band + Lower Band) / 2
How to apply the formula?
-
Choose the period (N). The most common period is 20. However, you can select another figure depending on your needs. For example, you can choose a period of 10 to make the channel more responsive to price changes, or use a higher period of 50 to build a smoother channel.
-
Plot the channel. You will see upper, lower, and middle bands on the chart.
-
Check the result.
-
If the price is closer to the upper band, this indicates an upward trend.
-
If the price is closer to the lower band, the trend is likely to be downward.
-
The middle line often serves as a support or resistance level.
Example
Let’s say you are analyzing a chart with a period of 20.
-
Upper band = the highest price over the last 20 candlesticks.
-
Lower band = the lowest price over the last 20 candlesticks.
-
Middle band = (Upper band + Lower band) / 2.
These guidelines can be used to inform trading decisions. For instance, if the price exceeds the upper band, it could generate a signal to open a long position.
Reading and Interpreting Donchian Channels
Let’s take a closer look at the indicator’s elements:
-
The upper band shows the maximum price for the selected period. If the price approaches this band, an uptrend is expected. A breakout of the upper band is often seen as a signal to open a long position.
-
The lower band reflects the minimum price for the period. When the price approaches this band, it signals a downtrend. When the lower band is broken through, short positions can be opened.
-
The optional middle band is the average value of the upper and lower bands. It often serves as a support or resistance level. If the price crosses the middle band, the trend direction may change.
How to Use the Donchian Channel?
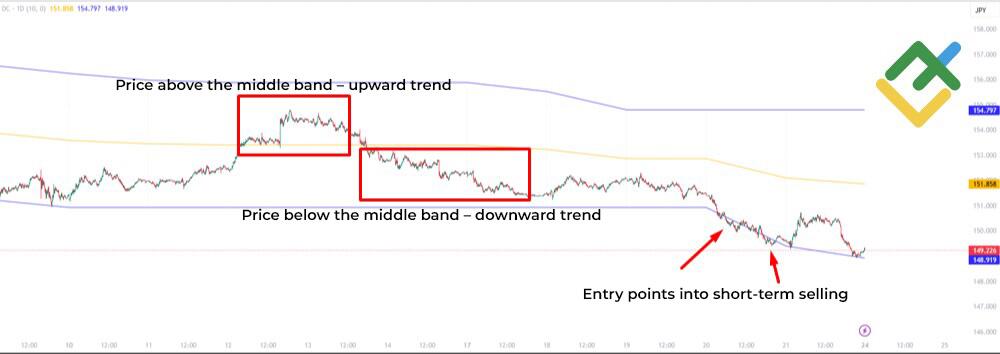
Trend identification.
-
Price above the middle band – an upward trend is expected.
-
Price below the middle band – a downward trend is likely to start.
Breakout trading.
-
Buy if the price breaks through the upper band of the channel.
-
Sell if the price breaches the lower Donchian channel band of the channel.
-
Set a stop-loss order beyond the opposite band.
Choosing the Right Time Period
The period selected when trading with the Donchian channel can affect the accuracy of trade signals. The period determines the number of candlesticks (or price bars) that will be used in the Donchian formula.
Short-term period (10–20 candlesticks):
-
Suitable for scalping or intraday trading.
-
The channel becomes more sensitive to price movements, but may generate more false signals.
Medium-term period (20–50 candlesticks):
-
Perfect for swing trading and tracking medium-term trends.
-
The channel is less sensitive to price movements and filters out market noise better.
Long-term period (50 candlesticks or more):
-
Suitable for position trading or long-term investments.
-
The channel shows global trends but generates signals less frequently.
Tips:
-
Begin with a standard period of 20 candlesticks and tailor it to your trading style.
-
Test different periods on a demo account to find the optimal setting.
Get access to a demo account on an easy-to-use Forex platform without registration
Trading Strategies Using Donchian Channels
In this section, we will explore the most popular strategies. Each of them is suitable for different market conditions and trading styles.
Donchian Channel Breakout Strategy
The breakout strategy is one of the simplest and most efficient. The idea is simple: open long or short positions and identify potential breakouts of the channel, expecting a strong trend to start.
How does it work?
A breakout of the upper band:
-
If the price closes above the upper band, you can open long positions.
-
Set an SL order at the upper band of the channel.
A breakout of the lower band:
-
If the price breaks through the lower band, you can open short trades.
-
Set a stop-loss order at the channel’s lower band.
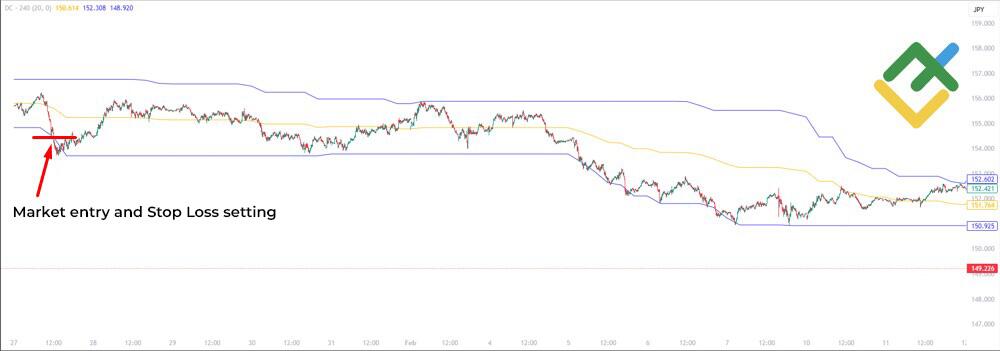
Here is an example of the breakout strategy.
-
Period: 20 candlesticks.
-
The price falls below the lower band, so you can open a short position.
-
Set a stop-loss order at the lower band.
The screenshot shows that the price continued to fall after breaking through the lower band. One could have taken advantage of this and made a profit before the quotes started to recover. The strategy works well because it is reliable, but its main drawback is that signals to open trades appear infrequently.
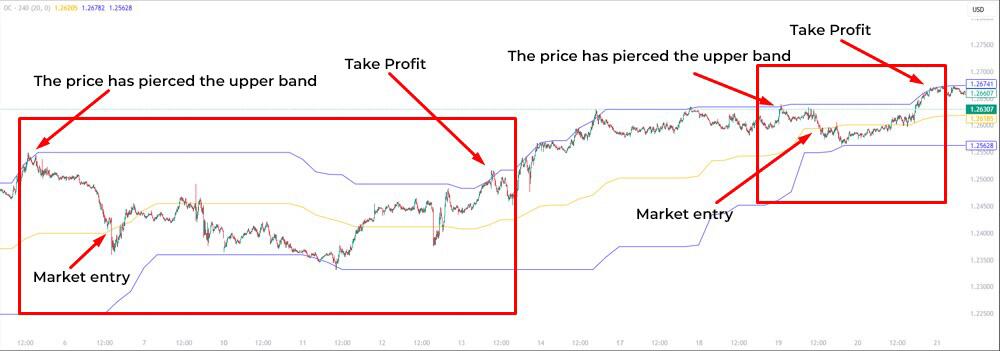
Donchian Channel Crawl Strategy
The Donchian Channel crawl strategy is a trend-following strategy suitable for markets with low volatility. Let’s take a closer look at it.
Buy at the lower band:
-
When the price approaches the lower band, you can open long trades.
-
Set a take-profit order at the middle or upper band.
Sell at the upper band:
-
When the price reaches the upper band, you can open short positions.
-
Set a take-profit order at the middle or lower band.
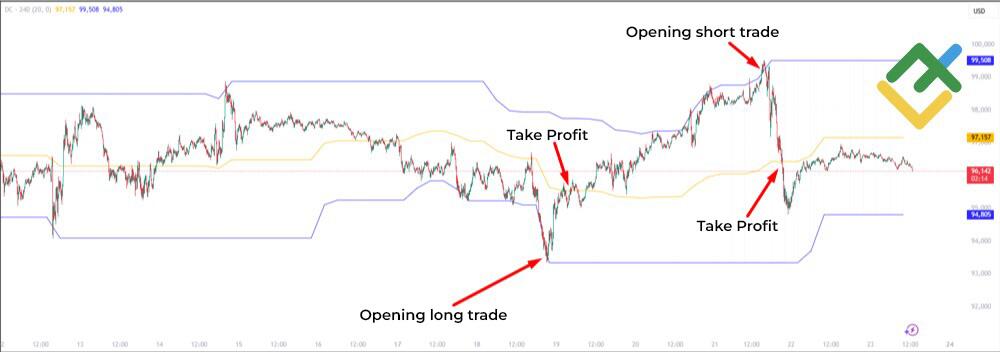
Below is an example of the crawl strategy.
-
Channel period: 20 candlesticks.
-
The price reaches the lower band – open a long position.
-
Set a TP order at the middle band.
-
The price reaches the upper band – open a short position.
-
Set a TP order at the middle band.
Donchian Channel Mean Reversion Strategy
The mean reversion strategy is based on the idea that prices often return to the middle band after strong movements. This strategy is suitable for those who prefer to trade on corrections.
Long position:
-
If the price drops to the middle band after breaching the upper band, you can consider buying an asset.
-
Set a stop-loss at the middle band.
Short position:
-
If the price rises to the middle band after testing the lower band, short positions can be considered.
-
Place a stop-loss at the middle band.
The chart shows an example of the mean reversion strategy.
-
Period: 20 candlesticks.
-
The price breaks through the upper band, then returns to the middle line, allowing you to open a long position.
-
Place a stop-loss at the entry level (the break-even point).
This strategy is perfect for trading in volatile market conditions where prices often return to their average values. For example, it can be applied to trading major currency pairs.
Coordinating Donchian Channels with Other Tools
The signals provided by the Donchian channel can be made more accurate and reliable when the indicator is combined with other technical analysis indicators. For example:
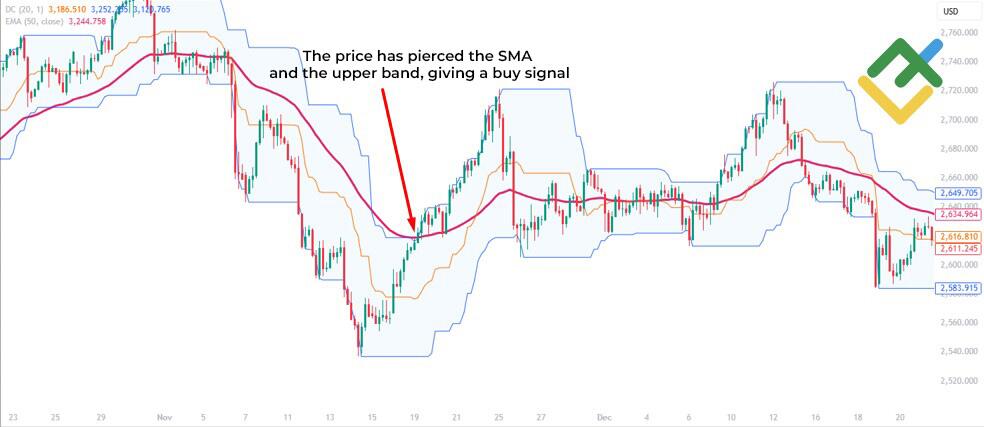
Moving Averages:
-
Use moving averages as a trend filter.
-
If the price is above the moving average and breaks through the upper band of the Donchian channel, this is a strong buy signal.
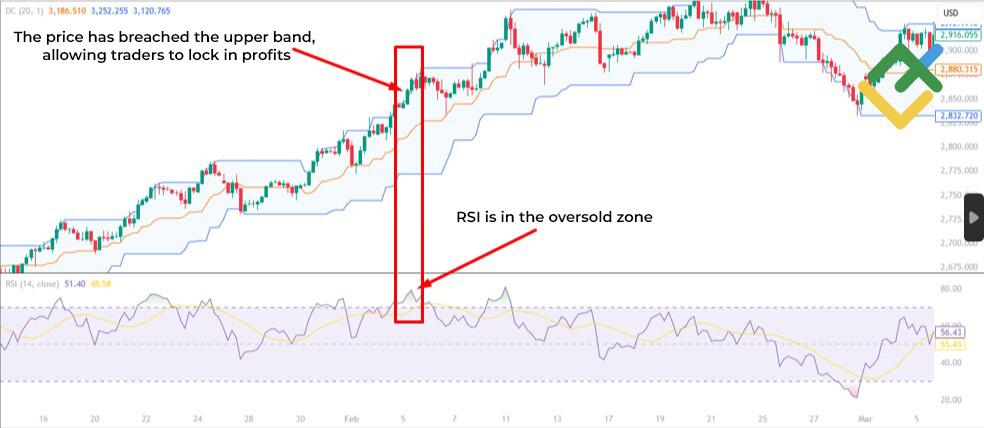
Relative Strength Index (RSI):
-
RSI helps determine whether the market is overbought or oversold.
-
If the price crosses the upper band while the RSI is in the overbought zone, it is better to trade with caution, as a trend reversal may occur.
Average True Range (ATR):
-
ATR allows you to gauge volatility.
-
Use this indicator to set stop-loss and take-profit orders. For example, set a stop-loss at a distance equal to 1.5 x ATR.
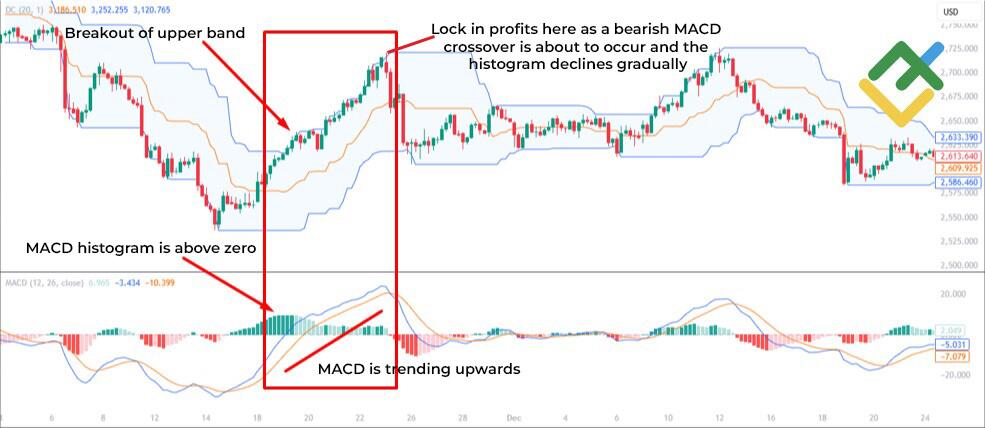
Moving Average Convergence Divergence (MACD):
-
MACD serves to confirm the trend direction.
-
If MACD signals an upward trend and the price breaks through the upper band, this setting reinforces the buy signal.
Support and resistance levels:
-
Plot key levels on the chart.
-
If the price breaks through the upper band and the key level simultaneously, the signal becomes more reliable.
Factors to Consider When Using Donchian Channels
If you want to use the Donchian Channel effectively, there are several key factors you need to consider. The following tips will help you avoid mistakes and improve the accuracy of trading signals:
-
Market conditions. The Donchian channel works best in trending markets. In flat markets, it can generate a lot of false signals.
-
Period. The period affects the indicator’s sensitivity. Short periods are suitable for fast-paced trading, while longer periods are better for long-term strategies.
-
Volatility. In volatile markets, the Donchian channel widens, which can increase risk. Use additional tools such as ATR to assess volatility.
-
Confirm signals. Do not rely solely on the Donchian channel. Use it in combination with other indicators such as RSI, MACD, or moving averages to filter out false signals.
-
Risk management. Always use stop-loss and take-profit orders. For example, you can set a TP order at the middle band or at the opposite band.
-
Test your strategy. Before using the Donchian channel on a live account, test it on a demo account. This will help you understand how it works in different market conditions.
Limitations and Risks
The Donchian channel has its drawbacks, which are important to consider when trading.
-
False signals. In flat markets, the price may make a lot of false breakouts, leading to false signals. As a result, traders may suffer losses.
-
Lag. The Donchian channel is based on historical data, so it can generate signals with a delay, especially in rapidly changing markets.
-
Dependence on volatility. In volatile markets, the channel broadens, increasing the risk of significant drawdowns.
-
Requires confirmation. Without additional indicators such as the RSI or MACD, channel signals are less reliable.
-
Limited use. The Donchian channel works best in trending markets but is less effective in low-volatile or noisy markets such as the stock market.
-
It can be confusing. Attempting to find the “right” period for the channel can lead to a flawed understanding of how the indicator functions, potentially compromising the efficacy of your strategy.
Keep these limitations in mind and always complement the Donchian channel with other tools and analysis methods.
Conclusion
The Donchian Channel is a simple trading tool that helps you effectively identify trends and find entry/exit points. It is straightforward in its design, but it is essential to exercise caution when selecting the period. One should not forget about confirming signals using additional technical analysis tools.
Range-bound trading strategies are suitable for a variety of market conditions. However, keep the limitations of this indicator in mind, such as the potential for false signals and lag. In order to enhance the accuracy and profitability of your trading, it is essential to utilize the Donchian Channel in conjunction with other indicators. It is also crucial to always adhere to risk management rules and conduct fundamental analysis.
Donchian Channel FAQs
The Donchian width is the distance between the lower and upper bands of the Donchian channel, which reflects market volatility. The wider the channel, the higher the volatility, and vice versa. This helps traders assess market conditions and adjust their strategies to open more profitable trades.
The Donchian channel is calculated using three bands: the upper band is the highest price over N periods, the lower band is the lowest point over N periods, and the middle band is the average between the upper and lower boundaries.
The best strategy depends on market conditions. In trending markets, a breakout strategy is effective, while in volatile markets, a mean reversion strategy is more effective. A crawl strategy is also commonly used.
A price above the middle band indicates an uptrend, while a price below the middle band suggests a downtrend. A breakout above the upper band gives a buy signal. A breakout below the lower band is a sell signal. The middle band often serves as a support or resistance level.
It is best to use it with the RSI or MACD to filter out false signals. The ATR is also useful for assessing volatility and setting stop-loss and take-profit orders. You can also try using the Donchian channel with a moving average.
This is a strategy that uses two channels with different periods. A short period of 10 is used for precise signals, while a long period of 50 is used to determine the primary trend, filtering out false breakouts.
For scalping, use a short period of 10–15 candlesticks. This makes the channel more sensitive to short-term price movements. Consider high volatility and always use stop-loss orders.
The Donchian Channel is effective in trending markets, but when the market is flat, it can give false signals. It is best used in combination with other indicators, such as the RSI or MACD, to improve the accuracy of your trading strategy.
The Keltner Channel uses a moving average and the ATR, which makes it less sensitive to volatility. The Donchian Channel is designed based on highs and lows, which is better suited for identifying trends.
The price channel is built based on current highs and lows, while the Donchian channel is based on historical data. The indicator is designed to identify trends, while the price channel is used to analyze current key levels.

The content of this article reflects the author’s opinion and does not necessarily reflect the official position of LiteFinance broker. The material published on this page is provided for informational purposes only and should not be considered as the provision of investment advice for the purposes of Directive 2014/65/EU.
According to copyright law, this article is considered intellectual property, which includes a prohibition on copying and distributing it without consent.
{{value}} ( {{count}} {{title}} )
This post is originally published on LITEFINANCE.