The Directional Movement Index (DMI) is a technical indicator commonly used to confirm signals in trend-following strategies. Different sources may interpret the indicator in various ways. Internationally, the DMI often includes three components: +DI, -DI, and the Average Directional Index (ADX). In trading platforms, this full combination is often called the ADX. However, in some strategies, when the DMI is mentioned, it may refer specifically to the +DI and -DI lines only, excluding the ADX line.
This article compares the ADX and DMI indicators, explains the signals generated by the DMI, and explores how this tool can be applied in trading strategies.
The article covers the following subjects:
Key Takeaways
|
Main thesis |
Conclusions and key points |
|
DMI indicator definition |
The directional movement index helps identify the direction of a trend at its early stages and determine potential pivot points. |
|
DMI calculation formula: general principle |
The DMI consists of two lines, +DI (Positive Directional Movement) and -DI (Negative Directional Movement). The +DI line is calculated using the highs of the current and previous candlesticks, while the -DI line involves their lows. Both lines’ calculations take into account the true range (TR) and are smoothed using the Exponential Moving Average (EMA). |
|
DMI usage |
When the +DI line crosses above the -DI, it signals the start of an uptrend. Conversely, when -DI crosses +DI from below, it indicates a downtrend. The wider the gap between the two lines, the stronger the trend. The ADX line can be added to assess the strength of a trend. |
|
DMI advantages |
The DMI is versatile and serves as an excellent confirmation tool for trend-following indicators and patterns. |
|
DMI disadvantages |
The index tends to lag behind market movements and is ineffective in flat markets, particularly on M5–M15 time frames. |
|
DMI combination with other indicators |
As an additional trend tool, the DMI works well with other trend indicators. It confirms or invalidates reversal patterns and helps to distinguish between real and false breakouts of support/resistance levels or trendlines. The DMI signals can also be filtered using additional oscillators. |
|
DMI Indicator strategies |
One of the strategies involves waiting for a preliminary signal from a trend indicator and then confirming it with the DMI over the next 3–4 candlesticks. Alternatively, a preliminary signal from the DMI can be confirmed by a trend indicator supported by additional technical tools. |
Understanding the DMI Components
The Directional Movement Index (DMI) is a trend-following indicator developed by J. Welles Wilder. Traders typically use this indicator to identify the direction the asset price is moving, detect moments when the market exits consolidation phases, and, less commonly, confirm potential pivot points. As an oscillator, the DMI consists of two lines and is usually plotted beneath the price chart.
The Directional Movement Index components:
-
+DI (Positive Directional Indicator) measures the strength of upward movement. It is calculated based on the difference between the current and previous highs, factoring in the true range and the EMA.
-
-DI (Negative Directional Indicator) reflects the strength of downward movement. It is derived from the difference between the current and previous lows and also incorporates the true range and the EMA.
The Directional Movement Index serves as the basis for calculating the Average Directional Movement Index. In some sources, the DMI and ADX are regarded as the same trend strength indicators.
The key distinction is that ADX adds a third line, the average directional line, which is calculated using the values of +DI and -DI, typically over 14 periods. This line is used to measure the trend’s strength and direction. However, traders may choose not to use the ADX line, as some find it too complex to interpret. Three lines with different interpretations can sometimes conflict with one another. For this reason, the ADX line can be removed on some platforms, leaving only the DMI indicator.
Besides, some sources provide another version of the indicator. In addition to the +DI, -DI, and ADX lines, the fourth ADXR line is added. It is calculated as the average value between the current ADX value and its value from 14 candles ago.
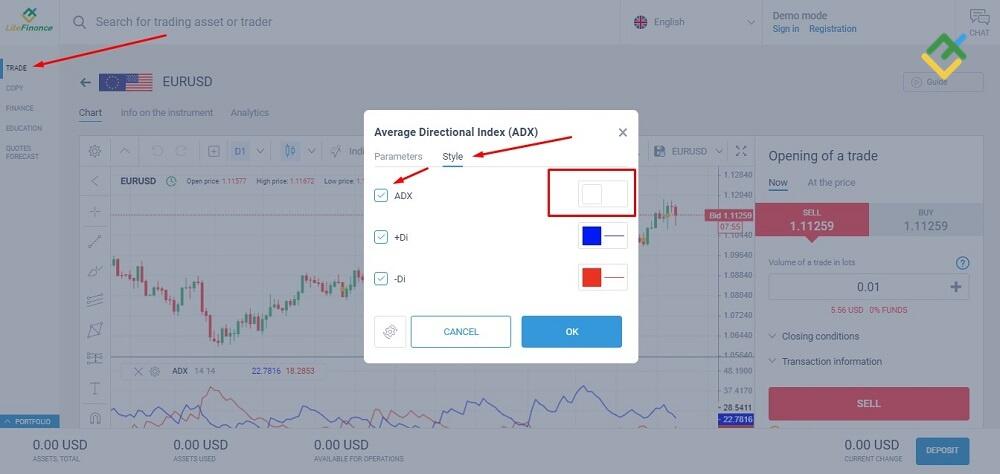
1. Follow these steps to install the DMI indicator in the LiteFinance browser platform:
-
On the left panel, select Trade and choose an asset. Let’s click on the EURUSD currency pair, for example. From the top menu, click on Indicators, then navigate to Built-in, and select the ADX.
-
In the indicator settings, go to the Style tab. In the ADX line settings, either set the color to white or uncheck the box to hide the ADX line.
Only the +DI and -DI lines remain on the chart, representing the DMI.
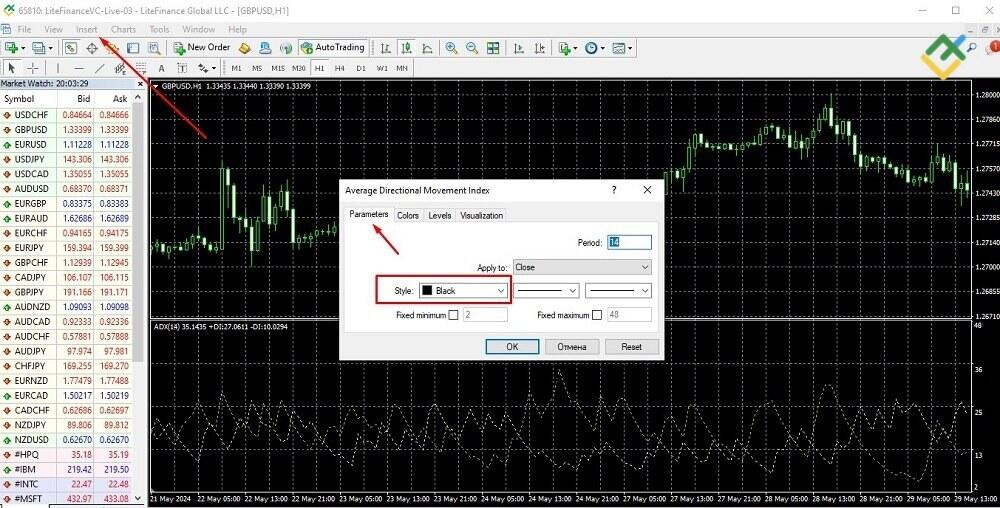
2. How to set up the DMI in MetaTrader 4:
-
On the chart of your chosen asset, go to the top menu and select Insert > Indicators > Trend > Average Directional Movement Index (ADX).
-
In the indicator settings, under the Parameters tab, navigate to Style and set the color of the ADX line to black.
The ADX line vanishes, leaving only the DMI indicator.
Calculating the DMI
Since the DMI consists of two curves, +DI and -DI, the value of each curve is calculated separately.
1. Calculation of the +DI line (Positive Directional Indicator):
+DI = EMA (+DM/TR) * 100
EMA is an exponential moving average.
The +DM value is calculated as follows:
-
+M = High of the last closed candlestick – High of the second-to-last closed candlestick. It represents the current high minus the previous high.
-
+DM takes the value of +M if +M is greater than -M for the same candlestick and(!) is also greater than 0. +DM is set to 0 if +M is less than 0 or(!) less than -M.
+M is the absolute positive price movement of an asset, meaning the current high is greater than the previous high.
-
TR = max (High(i) − Low(i); abs(High(i) − Close(i-1)); abs(Low(i) − Close(i-1))).
In order to calculate the true range (TR), the maximum value is chosen from three options, with the second two being absolute price differences. The largest of these values is taken as the TR. In some sources, the formula uses the Average True Range (ATR), typically calculated with a 14-period smoothing, to provide a more stable view of market volatility.
2. Calculation of the -DI line (Negative Directional Indicator):
-DI = EMA (-DM/TR) * 100
The -DM value is calculated as follows:
-
-M = Low of the second-to-last closed candlestick – Low of the last closed candlestick. This represents the previous low minus the current low.
-
-DM takes the value of -M if -M is greater than +M for the same candlestick and is also greater than 0. -DM is set to 0 if -M is less than +M or less than 0.
-M represents the absolute negative movement of the security price, indicating that the current low is below the previous low.
The calculation of the true range follows a similar approach. For each pair of candles, the current closed and the previous one, both +M and -M parameters are calculated simultaneously. Depending on the conditions, either +DM or -DM is set to zero. This process is repeated for all candles within the DMI period specified in the indicator settings.
Interpreting and Trading with the DMI
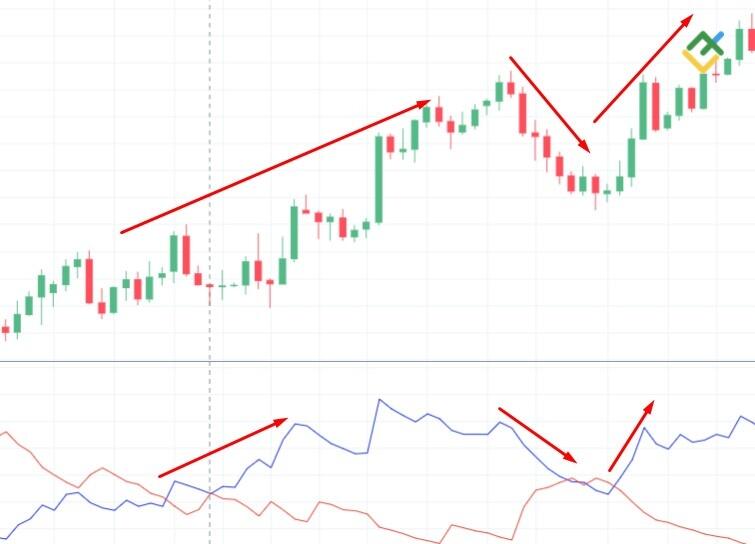
The interpretation of the Directional Movement Index (DMI) is straightforward. The starting point is when the lines cross. The direction of the asset’s price movement is determined by which line moves upward after the crossover:
-
If the +DI line moves upward after the crossover, it indicates an uptrend.
-
If the -DI line moves upward after the crossover, it signals a downtrend.
Additionally, pay attention to how high the line moves relative to previous highs. On a zoomed-out chart, a horizontal line is drawn through the previous highs. If the price pierces this horizontal line, the current trend may end soon.
This chart shows that after a short-term fluctuation, the blue +DI line has moved upward. The trend is strong and has headed upward as well. The lines’ crossover is only a preliminary signal to buy or sell. Trades should be opened when there is a clear divergence.
When the divergence reaches its maximum, it could signal an upcoming change in the trend’s direction, as shown in the second section of the chart. Once the lines’ difference started to increase again in the third section, the trend continued.
This is an example of using highs to confirm trend reversals. On a smaller scale, a horizontal line is drawn along the previous peaks. The blue +DI line broke through the horizontal from below, reversed, and the downtrend started almost immediately. In the second case, this approach did not work, indicating that using DMI to validate reversal levels is not always reliable.
The DMI serves as the foundation for the ADX line calculation.
-
Calculation formula:
The ADX value is an exponential moving average of the Directional Index.
-
The ADX value below 20 indicates a weak or non-trending market. The value above 25 signals the start of a trend. An ADX reading above 40 indicates a strong trend.
-
If the ADX reading exceeds 50, it suggests that the trend may be losing strength, raising the probability of a reversal.
The ADX measures only the trend’s strength when used without the DMI line. A growing index line can mean both a rising and a descending strong trend. Therefore, it is reasonable to set all three lines on the chart.
Copy successful traders
Make profits from the first day of trading without training. The best traders from the whole world gathered on the same platform to share their money-making strategies.
Pros and Cons
Like any indicator, the DMI has pros and cons. Some drawbacks can be mitigated, while others can be turned into advantages. Much depends on the trading system and your ability to optimize it.
Benefits of Using the DMI
-
Relatively simple signal interpretation. The main signals come from the position of the lines relative to each other, the direction they are moving, and the distance between them. The greater the distance between the lines, the stronger the trend. Conversely, if the -DI line is above, it indicates a bearish trend. If the +DI line is above, it means the bulls are stronger in the market.
-
Filtering potential false signals. The DMI helps during the flat market. When a trend indicator suggests a breakout from a sideways channel, the DMI helps traders confirm this breakout and identify the beginning of a potential trend.
-
Flexibility in combination with other indicators. The DMI is a helpful tool for confirming signals generated by trend-following indicators, such as moving averages and momentum indicators. A common strategy involves using one trend indicator along with two oscillators, the DMI with either the RSI or MACD. The simplicity of the MACD and RSI formulas contrasts with the more complex calculation of the DMI, making them complementary and enhancing the overall analysis by providing different perspectives on market movements.
The indicator is quite versatile. Combined with the ADX line, it can show the trend direction and strength. Besides, the indicator can be used on any asset.
Limitations and Drawbacks of the DMI
-
Frequent false signals on lower time frames. It is not advisable to use the indicator on M5–M30 time frames.
-
Lagging. Signals are frequently delayed. The indicator confirms the direction of price movement when the trend has already progressed a significant portion. This is why the oscillator is used on time frames from H1, where trends are more stable and prolonged.
-
The indicator is suitable only for trending markets. In a flat market, even with high volatility, the efficiency of the indicator is low.
-
Usually, traders do not use the indicator as a standalone tool. Instead, it serves as a supplementary indicator that filters signals of trend tools and patterns, as the DMI helps enhance accuracy and reduce false signals.
Similarly to other indicators, its signals should be ignored during high volatility. This includes the hour before and after major news releases, as well as during the opening of significant trading sessions, like the European trading session for the EURUSD pair.
Combining DMI with Other Indicators
The DMI refers to confirming signals of trend indicators. It can be used in conjunction with the following tools:
-
Standard trend indicators such as moving averages, momentum, and the Alligator indicator. The DMI confirms the trend and its direction. For example, if the price breaks through the moving average from below or if there is a divergence of the Alligator‘s moving averages after the crossover, it is a signal to initiate a long trade. Additionally, if the DMI line moves upward after crossing the +DI line, it confirms the uptrend.
-
Reversal patterns. “Pin bar” and “Head and shoulders” patterns show a potential reversal. However, the reversal may turn out to be false or a short-term correction. The DMI indicates the direction of movement of the asset price, confirming or denying the change of trend.
-
Resistance and support levels, trend lines. The DMI helps to determine whether the breakout of levels is true or false. If the indicator lines are at the level of crossover and do not give an accurate signal, the breakout is false.
-
Oscillators. Additional filters for the Directional Movement Index and trend indicators. For example, the Moving Average and the DMI show potential upward movement, but the oscillator is in the overbought zone. This may indicate weakness in the uptrend and a possible reversal.
Thus, these were general examples of using the indicator in combination with other technical analysis tools. Volume indicators can also be added here. If trading volumes are growing when the lines diverge, it indicates an increasing trend’s momentum.
Differences between the DMI and the Aroon Indicator
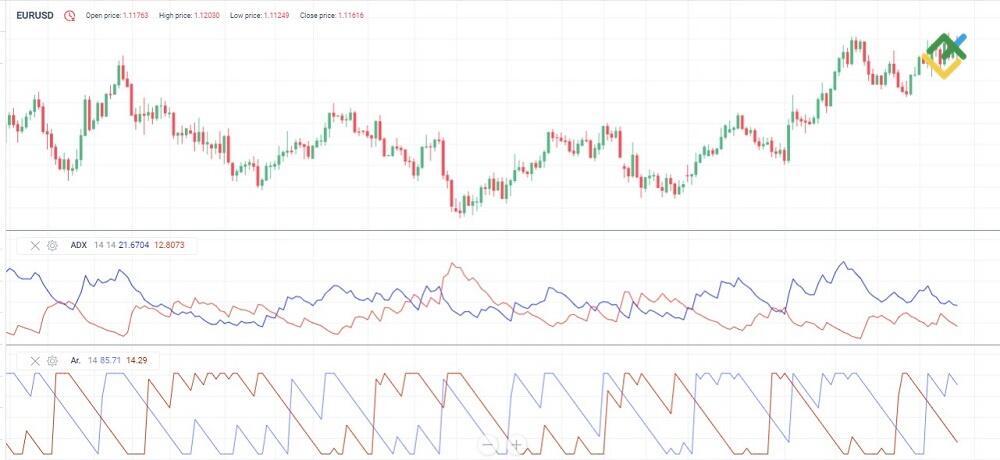
The Aroon indicator is a technical analysis tool that is similar to the DMI but differs in its calculation formula. It also consists of two lines, which show the strength and direction of an asset’s price. The up line shows the strength of upward pressure in the market, while the down line shows the strength of a downtrend. The interpretation of its signals is akin to that of the DMI. If the up line rises above the down line, the trend is upward, whereas if the down line grows above the up line, the trend is downward.
Because of the different calculation formulas, the indicators look quite different. The DMI curve movements are smoother and slower, with relatively rare peaks and troughs. The Aroon indicator’s curves, on the contrary, are sharper and move in a range.
The DMI and Aroon indicators comparison:
|
DMI |
Aroon |
|
|
Calculation |
Compares consecutive highs and lows of an asset’s price action considering the true range and smooths the DMI values using the EMA. |
Calculated based on the number of days since the high was formed. In case of a steadily upward trend, the value will be 100. In case of a downward trend, it will be 0. |
|
Interpretation |
The signal occurs when the lines cross over each other. Depending on which line rises higher, a long or short trade is taken. |
The signal is determined by the lines being in the 70 to 100 range or in the 0 to 30 range. |
|
Application |
The indicator is used to determine the trend’s direction and strength. |
Traders can use the indicator during a sideways market, where highs and lows alternate frequently. During distinct trends, it confirms the trend reversal. |
Practical Example: Using DMI in Trading
If you are a novice trader, you can also incorporate the DMI indicator into your strategy. Simply wait until the indicator, such as the Alligator, Momentum, or others, signals the beginning of an uptrend and get confirmation from the DMI. This confirmation should occur within 3–4 candlesticks. A longer period may imply a delayed signal, which should be ignored. Conversely, the crossover of the DMI lines can serve as an early signal, prompting you to look for its confirmation from a trend indicator.
A long trade opening example.
Parameters (market conditions do not take into account fundamental factors):
-
SMA (14) — the same period as the DMI in the default settings.
-
DMI (14) without the ADX line. The +DI line is blue, and the -DI line is red.
-
H4 time frame, the EURUSD currency pair.
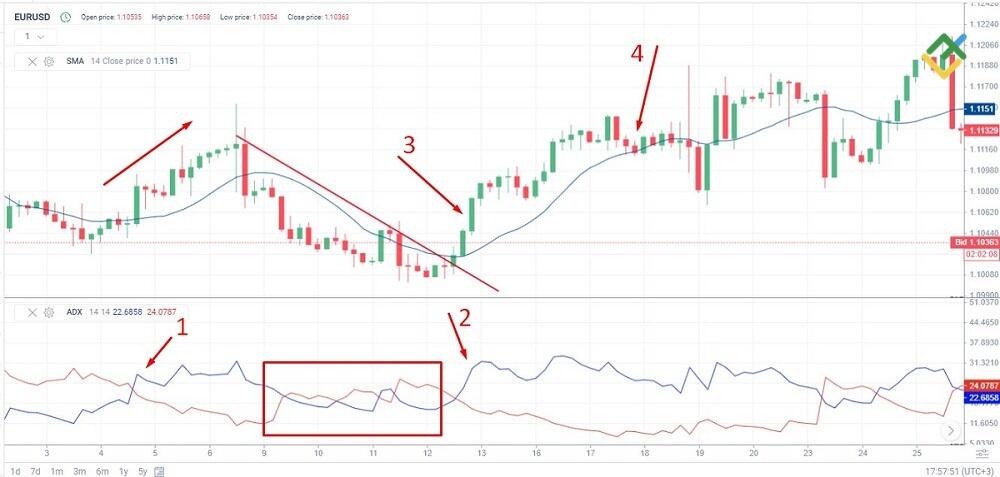
Let’s conduct a preliminary technical analysis. The chart shows the lines’ crossover and divergence at point 1, where the blue DMI line signals an uptrend, though it proves to be short-term. A descending trend forms, allowing a line to be drawn across the peaks and troughs. During this time, the DMI reflects uncertainty, with the lines intertwining almost throughout the downtrend, as highlighted by the red rectangle.
The first main signal for a trader occurs when the price crosses the moving average from below and simultaneously breaks through the trend line. Wait for the first candlestick to close above the moving average after the breakout. The price then starts moving upwards. There is a divergence in the DMI lines (arrow 2), with the blue line rising. A trade is opened on the third candlestick with an entry at 1.1058, which corresponds to the midpoint of the candlestick indicated by arrow 3. The midpoint is used to ensure the previous breakout was not false.
Partially exit the market. Close 50% of the position after a 30-pip profit. The remaining 50% is closed when the asset’s price touches the moving average, indicating a potential breakout. As a result, 50% of the trade is closed at 1.1090 (+30 pips) and the other 50% at 1.1113 (+23 pips). However, the trade was held for 5 days, so consider a single swap for each day and a triple swap.
A short trade opening example.
Parameters:
-
SMA (14).
-
DMI (14) without the ADX line. The +DI line is blue, and the -DI line is red.
-
H4 time frame, the EURUSD currency pair.
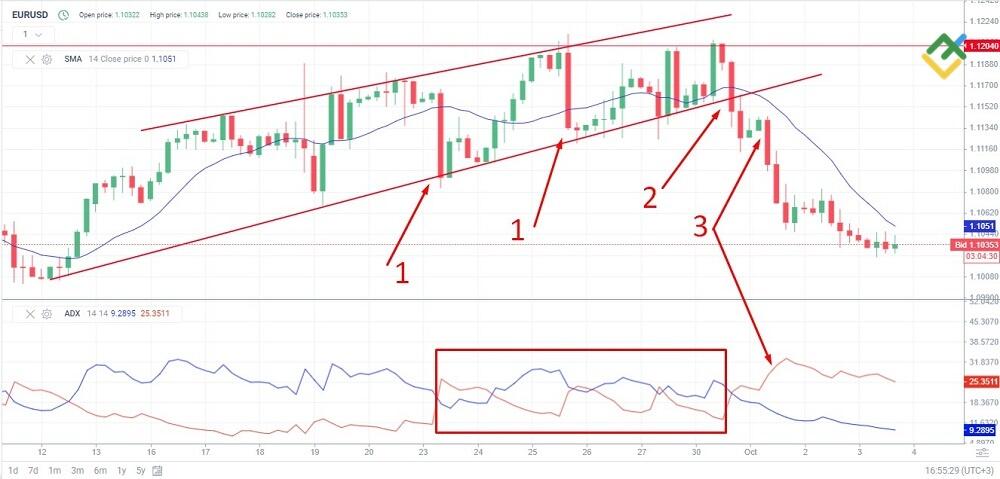
Preliminary analysis. The price experienced a strong uptrend moving within a channel. Notably, small green candlesticks were followed by large red ones (Arrow 1), suggesting that the uptrend was unstable and could reverse at any moment. Although the price pierced the SMA line from above, the DMI did not provide any confirming signals. The oscillator showed intertwined lines with no clear divergence.
The arrow 2 points at a preliminary sell signal. A red candlestick broke through not only the moving average but also the channel’s boundary. The following candlestick was also red and closed completely outside the channel. The red -DI line moved upward, showing a divergence in the lines. Two small-bodied green candles indicated a correction as the DMI continued to signal a downtrend.
Once the next red candlestick fully engulfs the preceding green candlesticks, short positions should be opened, as all signals suggest a continuation of the downtrend. The entry point is at 1.1124. 50% of the trade should be closed after a 30-pip profit, with the remaining 50% closed when the price reverses upward and touches the moving average.
Conclusions:
-
Preliminary analysis is crucial. Look for clues that indicate a trend before executing any trades based on initial signals from a newly opened chart. Wait until a clear preliminary picture has formed before taking any action.
-
If preliminary analysis shows an uptrend in the market, look for signals to open a short trade. If there was a preceding downtrend, look for a signal indicating the beginning of an upward trend.
-
The DMI lines’ crossover is only a preliminary signal. What really matters is their distinct divergence. Therefore, it is advisable to wait for 2–3 candlesticks, provided that there is already a trend indicator signal.
-
Patterns, levels, and trend lines are great tools that help traders identify true and reject potentially false signals.
-
The indicator is generally not used for exiting the market. In theory, the lines converging could indicate the end of a trend. However, testing shows that trends often finish earlier than the indicator suggests.
Besides, it is essential to consider fundamental factors. A breakout and the beginning of a trend should be confirmed by news.
Improving DMI Reliability and Best Practices
There are no perfect indicators. Nevertheless, there are some tips that will help to increase the number of effective signals:
-
Utilize the DMI on higher time frames like H1 or H4. On lower time frames, there is a greater chance of false signals due to increased volatility from high-volume trades and fundamental factors. Higher time frames offer more stable trends, making them easier to predict.
-
Combine the DMI with other oscillators that use different calculation formulas. The DMI is not a primary indicator. Instead, it acts as a confirmation for signals from trend indicators or patterns.
-
Exercise caution during news releases. Although these periods can provide accurate data, the increased volatility and lagging indicator signals can lead to errors. For instance, the DMI may show a rise when the uptrend is nearly over.
The main recommendation is to test the trading system with the DMI indicator. Testing should be conducted in three stages:
-
Preliminary testing based on historical price data. The goal is to identify the situations where the DMI provides the most accurate signals and determine the most effective assets and time frames, the optimal time of the day, the complementary indicators to the DMI, and the best settings to use.
-
Forward testing. Divide the historical data into two segments. For example, split a 3-year period into 2.5 years and 6 months. Optimize the parameters on the first 2.5 years segment. The remaining 6 months serve as the forward test period, where the trading system should produce similar results, preventing overfitting of parameters.
-
Test the final strategy in a live market using a demo or cent account.
You can test the trading system in the built-in MT4/MT5 testers or in a separate testing software providing technical analysis tools.
Start trading right now
Conclusion
Let’s summarize the results of using the DMI indicator in trading.
-
The DMI is a technical indicator used by traders to gauge the strength of an uptrend or downtrend in the market. It is a type of lagging oscillator used to confirm the direction of a potential trend. The DMI is a part of the basic ADX oscillator for most trading platforms. Some sources refer to the DMI as the ADX.
-
The calculation process is intricate, requiring a comparison of current highs and lows with previous ones while factoring in the true range value. The resulting value is then smoothed using the EMA.
-
Main trading signals. When the +DI line is above the -DI line and then moves upward after the crossover, it indicates an uptrend. Conversely, when the -DI line is above the +DI line and moves higher after crossing, the price trend is strongly bearish. Additionally, if there is a significant divergence with +DI above, it suggests a potential quick reversal for an uptrend. If the -DI is higher, it implies a downward trend, but with a possibility of an upward reversal.
-
The indicator is used in trend strategies on H1 time frames and higher. It is better to disregard the signals in a sideways channel.
-
The DMI is more effective when used with trend indicators, and its signals can be filtered by incorporating an additional oscillator.
As mentioned before, the indicator is called the ADX in trading platforms. It is up to you to decide which of its lines to utilize. Once you have installed the indicator, test your trading strategies, and feel free to share your thoughts on how to effectively apply the DMI in the comment section.
Directional Movement Index (DMI) FAQs
The indicator analyzes the divergence between the highs/lows of the last and second-to-last closed candlesticks. The calculation formula factors in the value of the true range and smoothing of the data using the exponential moving average (EMA). Consequently, the indicator allows you to predict the direction of a potential trend at the beginning of its formation.
No, the DMI indicator is a part of the ADX. The DMI consists of two curves, +DI and -DI. The ADX includes the +DI, -DI curves, and the ADX index line, which is calculated based on these curves. If you hide the index line in the ADX indicator settings, the DMI indicator will remain on the chart. Moreover, their functions differ. The DMI indicates only the trend’s direction, while the ADX can also reveal its strength, the rate of growth or decline.
A good DMI indicator provides the most accurate and easily interpretable signals. This typically occurs when the lines diverge sharply after crossing at a significant angle. The sharper and more distinct the divergence of the lines, moving to the upper and lower zones without intertwining, the stronger the signal, confirming a trend.
Like other indicators and oscillators, the DMI does not provide 100% accurate signals. Its precision may depend on the asset’s current volatility, indicator settings, selected time frame, trading sessions, etc. The optimal parameters are first selected in the strategy tester, then adjusted during forward testing, and finally on the demo account. The performance of each combination is evaluated at all three stages through backtesting.
The indicator is used to identify the direction of a potential trend by determining the position of the +DI and -DI lines relative to each other and their upward or downward direction. Another signal is the divergence of lines to the maximum distance from each other, suggesting a trend reversal.
In day trading, the indicator is used to confirm the signals of patterns and trend indicators. The divergence of lines is a signal confirming the trend. When the DI+ line is above the DI- line, a bullish trend prevails in the market. Conversely, when the DI- line exceeds the DI+ line, it signifies a bearish trend. The ADX auxiliary line can also be used to gauge the strength of the trend.
These indicators are calculated differently and serve different purposes. The RSI indicates overbought and oversold conditions as an oscillator, confirming trend reversals. The DMI helps to determine trend direction and is used much less frequently as a reversal confirmation tool.
The DMI is a lagging indicator, which is why it is best utilized on higher time frames. However, whether the indicator is leading or lagging also depends on the settings. The longer the period, the more the indicator will lag.
The content of this article reflects the author’s opinion and does not necessarily reflect the official position of LiteFinance. The material published on this page is provided for informational purposes only and should not be considered as the provision of investment advice for the purposes of Directive 2004/39/EC.
{{value}} ( {{count}} {{title}} )
This post is originally published on LITEFINANCE.

