
When it comes to technical analysis, one tool stands out for its effectiveness and simplicity: Bollinger Bands. Invented by John Bollinger in 1983, Bollinger Bands are a crucial component of any successful trading strategy. They offer traders a unique way to measure price volatility and predict market movements. By using Bollinger Bands, traders can gain insights into whether a stock is overbought or oversold, which can be invaluable for making informed decisions.
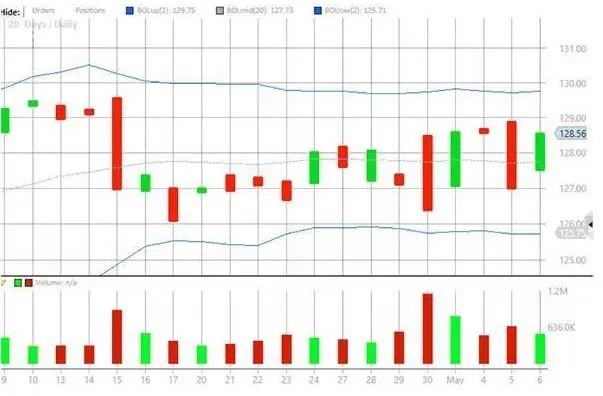
Bollinger Bands consist of three lines: a middle band, which is a moving average, and two outer bands that represent standard deviations above and below this average. These bands expand and contract based on price volatility, giving traders a visual representation of market conditions. Understanding how to interpret and apply Bollinger Bands in your trading strategy can provide a significant edge in spotting potential market moves.
Understanding Bollinger Bands
At the core of Bollinger Bands is the concept of price volatility. Volatility is a measure of how much the price of an asset fluctuates over time. When prices move significantly, the bands widen, indicating high volatility. Conversely, when prices are stable, the bands contract, signaling low volatility.
A typical Bollinger Band setup uses a 20-period moving average, with the upper and lower bands set two standard deviations away. This setup allows the bands to capture approximately 95% of price action, making them a reliable indicator for most market conditions. However, traders can customize the number of periods and the number of standard deviations based on their specific needs.
One of the key strengths of Bollinger Bands lies in their ability to adapt to changing market conditions. Whether the market is trending, consolidating, or reversing, Bollinger Bands provide valuable insights that can help traders make more informed decisions. For example, when the price touches the upper band, it may indicate that the asset is overbought, while a touch of the lower band might suggest that it is oversold. However, as we’ll explore, interpreting these signals requires a nuanced approach.
How to Use Bollinger Bands in Your Trading Strategy?
Incorporating Bollinger Bands into your trading strategy can help you identify potential entry and exit points. However, it’s important to remember that Bollinger Bands are not standalone indicators. They work best when combined with other technical analysis tools and chart patterns, such as the double bottom and classic M top.
One of the most common mistakes traders make is assuming that a touch of the upper or lower band automatically signals a reversal. While this can sometimes be the case, it’s not a guarantee. Instead, look for additional confirmation from other indicators or chart patterns. For example, in an uptrend, prices may “walk the band,” repeatedly touching or exceeding the upper band without reversing. Similarly, in a downtrend, prices might stay close to the lower band for an extended period.
To effectively use Bollinger Bands, you should also pay attention to the width of the bands. Narrow bands often indicate a squeeze, a period of low volatility that can precede a significant price move. When the bands start to widen again, it can signal the beginning of a new trend. By identifying these squeezes, traders can position themselves to capitalize on potential breakouts.
The Double Bottom Pattern and Bollinger Bands
The double bottom is one of the most reliable chart patterns in technical analysis. It occurs when a price makes a low, rebounds, and then falls again to a similar level before rising once more. This pattern can signal a reversal from a downtrend to an uptrend, especially when confirmed by Bollinger Bands.
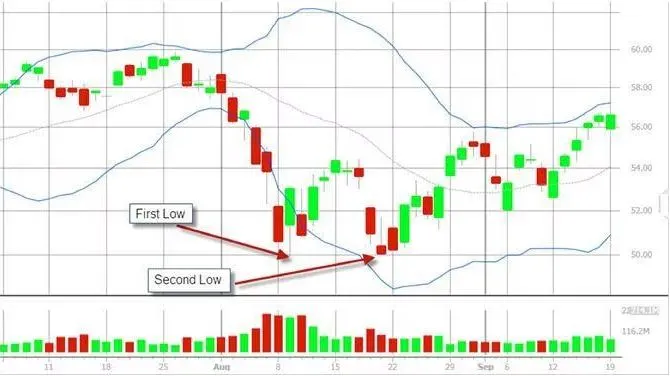
When the first low touches or slightly breaks below the lower Bollinger Band, it may indicate that the asset is oversold. After the price rises towards the middle band, the second low should ideally stay within the lower band. This scenario suggests that the selling pressure is diminishing, and the asset is preparing for an upward move. The double bottom pattern, in conjunction with Bollinger Bands, can be a strong signal to enter a long position.
Traders should wait for the price to break above the middle band before confirming the double bottom. This break is often seen as a signal that the downtrend is over and that a new uptrend is beginning. By combining the double bottom pattern with Bollinger Bands, traders can gain a clearer picture of potential market reversals.
The Classic M Top and Bollinger Bands
Just as the double bottom can indicate the start of an uptrend, the classic M top can signal a potential reversal from an uptrend to a downtrend. The M top forms when the price makes a high, pulls back, and then retests the previous high or creates a slightly higher high. This pattern is particularly significant when it interacts with Bollinger Bands.
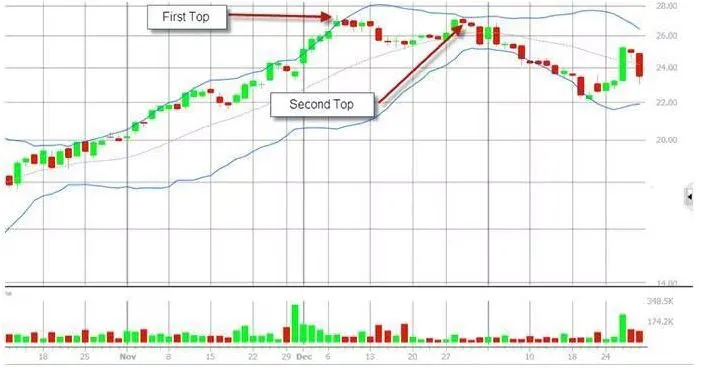
In a classic M top, the first high often touches or exceeds the upper Bollinger Band, suggesting that the asset might be overbought. After a pullback towards the middle band, the second high occurs within the upper band. This lower high on a relative basis suggests weakening momentum, a potential signal that the uptrend is losing steam.
Traders can use the classic M top in conjunction with Bollinger Bands to identify potential shorting opportunities. When the price fails to break above the upper band during the second high, it may indicate that the buying pressure is fading. This signal, especially when combined with other indicators like volume or momentum oscillators, can be a strong indication to sell or short the asset.
The “Three Pushes to High” Pattern and Bollinger Bands
Another powerful pattern to watch for is the “three pushes to high,” which often develops as a precursor to a larger topping formation. This pattern is characterized by three consecutive price peaks, each higher than the last, but with diminishing momentum. Bollinger Bands can provide valuable context for this pattern, helping traders identify when the trend might be losing steam.
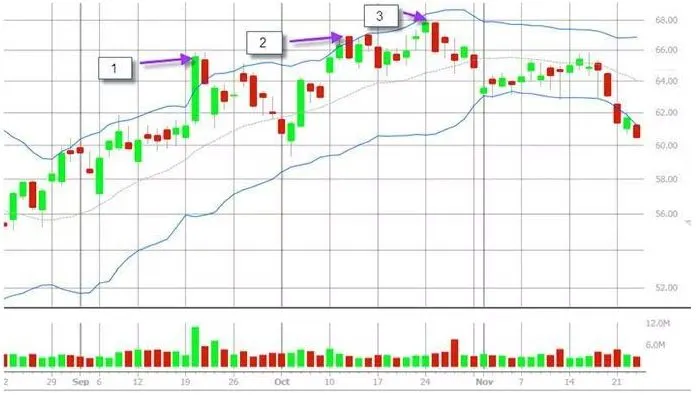
In the first push, the price typically breaks above the upper Bollinger Band, indicating strong momentum. The second push usually touches the upper band, but without the same force as the first. By the third push, the price struggles to reach the upper band, often failing to do so entirely. This sequence of diminishing peaks, combined with the position of the Bollinger Bands, can signal that the uptrend is nearing its end.
Traders should pay attention to the volume during these pushes. Decreasing volume alongside the “three pushes to high” pattern can reinforce the idea that the upward momentum is fading. When the third push fails to reach the upper band, it may be time to consider selling or shorting, as the trend could be on the verge of reversing.
Spotting the End of Trends
Bollinger Bands are not only useful for identifying potential entry points but also for spotting the end of trends. During strong trends, especially after a breakout from a trading range, the bands will often expand significantly. This expansion reflects the increased volatility associated with the trend. However, when the trend starts to lose momentum, the bands will begin to contract.
One key signal to watch for is when the lower Bollinger Band turns upward during an uptrend. This movement can indicate that the upward momentum is weakening, and a reversal may be imminent. Similarly, in a downtrend, the upper band turning downward can signal the end of the downtrend.
Another interesting aspect of Bollinger Bands is their ability to capture the cyclical nature of volatility. Periods of low volatility, indicated by narrow bands, are often followed by periods of high volatility. This phenomenon, known as mean reversion, can help traders anticipate potential breakouts or reversals. By identifying these shifts in volatility, traders can better time their entries and exits.
Combining Bollinger Bands with Other Indicators
While Bollinger Bands are a powerful tool on their own, they become even more effective when combined with other indicators. Volume indicators, for example, can provide additional confirmation of price movements. A spike in volume alongside a price break above or below a Bollinger Band can indicate a strong move.
Similarly, momentum oscillators like the Relative Strength Index (RSI) or the Moving Average Convergence Divergence (MACD) can help traders gauge the strength of a trend. When these indicators align with signals from Bollinger Bands, the likelihood of a successful trade increases.
For example, during a squeeze, when the bands are at their narrowest, combining Bollinger Bands with RSI can help traders identify overbought or oversold conditions. If the RSI shows overbought conditions as the price touches the upper band, it could be a signal to prepare for a potential reversal. Conversely, if the RSI indicates oversold conditions when the price touches the lower band, it might be an opportunity to go long.
Conclusion
Bollinger Bands are a versatile and powerful tool in technical analysis, offering traders insights into price volatility and potential market moves. By understanding how to interpret the bands and combining them with other indicators and chart patterns like the double bottom and classic M top, traders can enhance their trading strategy.
Whether you’re spotting the end of a trend or preparing for a breakout, Bollinger Bands can provide the signals you need to make informed decisions. Remember, no single indicator guarantees success, but when used correctly, it can be your secret weapon for spotting market moves and staying ahead in the trading game.
Click here to read our latest article Geopolitical Risk Shockwaves: How Global Events Impact Forex
This post is originally published on EDGE-FOREX.


