The price of Binance Coin (BNB), the native token of the Binance cryptocurrency ecosystem, has seen monumental growth since its launch in 2017. However, just like other digital assets, BNB is highly volatile. Multiple technical and fundamental factors provide insight into the potential future BNB price levels.
Binance is expanding its market presence by finding new use cases for the BNB token, which is good for the coin’s exchange rate. This article explores cryptocurrency market trends, BNB price forecasts for several years ahead, and factors determining the coin’s future in the blockchain technology sector.
The article covers the following subjects:
Highlights and Key Points: Binance Coin (BNB) Exchange Rate Forecast 2024–2030
- BNB’s current price stands at $577.8000 as for 01.07.2024. The exchange rate has returned to late 2021 levels and has reached new highs.
- According to ChangellyBlog and AMBCrypto, the Binance Coin exchange rate will be around $548.68 – $654.81 in 2024.
- In 2025, BNB is predicted to grow even more strongly. Based on CoinPriceForecast’s data, the price may reach $1,412.
- Long-term forecasts for 2027–2031 remain optimistic. The Changelly data suggests that the BNB price will exceed $6605,04 by 2030.
BNBUSD Exchange Rate Today, in Coming Days and Week
For an effective short-term forecast of Binance Coin’s (BNB) price, consider several key factors. Monitor Binance’s platform developments and updates, as enhancements can drive user adoption and demand for BNB. Pay attention to overall market sentiment towards cryptocurrencies, as it significantly impacts price movements. Stay updated on regulatory news, as changes in cryptocurrency regulations can influence market conditions. Analyze BNB’s trading volumes and liquidity to assess market strength and potential volatility. Additionally, keep an eye on Binance’s strategic partnerships and integrations, as these can enhance BNB’s utility and investor appeal.
Analysts’ BNB Price Projections for 2024
Let’s take a look at BNBUSD’s expert forecasts for 2024.
Changelly
Price Range in 2024: $530.76 – $654.81 (as for July 1, 2024).
According to Changelly, BNB will decline during the second half of 2024. The average price will see its peak at $624.54 in August and then decrease to $598.15. As prices fall, the return on investment (ROI) will also change, indicating market volatility.
| Month | Minimum, $ | Average Price, $ | Maximum, $ |
|---|---|---|---|
| July | 575.43 | 608.89 | 642.34 |
| August | 594.26 | 624.54 | 654.81 |
| September | 590.29 | 605.77 | 621.24 |
| October | 533.88 | 571.99 | 610.10 |
| November | 530.76 | 591.85 | 652.93 |
| December | 545.85 | 598.15 | 650.45 |
AMBCryto
Price Range in 2024: $439.56 – $548.68 (as for July 1, 2024)
AMBCrypto’s BNB price prediction sees a moderate bullish movement in the second half of 2024. The price is expected to gradually increase with minimal fluctuations. Thus, the overall verdict is ‘Buy’. The data shows a steady rise in the BNB price, making it an attractive asset to invest in for 2024.
| Month | Average, $ | Min, $ | Max, $ |
|---|---|---|---|
| July | 512.78 | 476.88 | 548.68 |
| August | 472.65 | 439.56 | 505.74 |
| September | 481.72 | 448.00 | 515.44 |
| October | 490.79 | 456.44 | 525.15 |
| November | 499.87 | 464.87 | 534.86 |
| December | 508.94 | 473.31 | 544.56 |
CoinPriceForecast
Price Range in 2024: $569 – $1,097 (as for July 1, 2024)
According to CoinPriceForecast, the price of BNB Coin in 2024 started at $314.35. Today, Binance Coin is trading at $577.8000. The price will likely reach $1,097 by the end of the year. The forecasted price for the middle of 2024 is $569 per 1 Binance Coin.
| Year | Mid-Year, $ | Year-End, $ |
|---|---|---|
| 2024 | 569 | 1,097 |
PricePrediction
Price Range in 2024: $587.98 – $788.15 (as for July 1, 2024)
According to PricePrediction, the Binance Coin price will steadily grow in the second half of 2024. In July, the price is expected to range from a low of $587.98, an average of $616.48, to a high of $645.56. Moving into August, the projected range is $606.01 to $676.38, with an average of $628.81. From September to December the average price will grow from $647.68 to $707.67, indicating a strong uptrend for Binance Coin.
| Month | Min, $ | Average, $ | Max, $ |
|---|---|---|---|
| July | 587.98 | 616.48 | 645.56 |
| August | 606.01 | 628.81 | 676.38 |
| September | 619.18 | 647.68 | 707.82 |
| October | 650.78 | 673.59 | 733.73 |
| November | 664.26 | 687.06 | 760.67 |
| December | 684.87 | 707.67 | 788.15 |
BNBUSD Technical Analysis
Let’s use different time frames, ranging from 1-hour and 4-hour to daily and weekly, to conduct the technical analysis of BNBUSD. This approach helps assess both short-term and long-term price trends, providing traders with a comprehensive understanding of the market situation.
Using price charts with varying intervals is a crucial aspect of technical analysis. These charts enable the identification of key support and resistance levels, which is vital for pinpointing entry and exit points and planning strategies based on price movements.
Indicators are also integral to technical analysis. For instance, moving averages such as the SMA or EMA can be helpful in determining trend direction. A stochastic oscillator and the RSI are useful for evaluating an asset’s overbought/oversold condition. These analytical tools assist traders and investors in making informed decisions based on objective data.
It is important to pay attention to reversal patterns, such as a “Double top” pattern, as well as trend continuation patterns, like “Flags” and “Triangles“, when analyzing price movement. Identifying these patterns helps to pinpoint key points on a chart and increase the chances of successful trades.
Get access to a demo account on an easy-to-use Forex platform without registration
BNBUSD Exchange Rate Analysis For Next Three Months
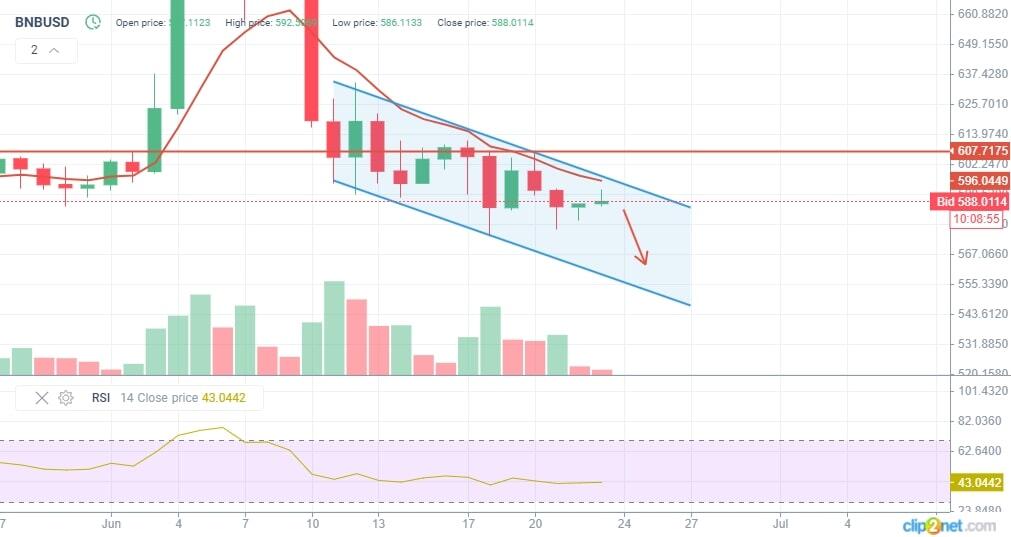
The technical analysis of the BNBUSD price suggests that the pair may experience a consistent downtrend over the next three months. The 50-day moving average line on the daily price chart confirms this downward movement, indicating a strong bearish trend. As a result, the price will likely continue to decrease in the coming months.
The daily chart also shows a descending trending channel, indicating a possible continuation of the price decline. The key resistance levels are at $607, while the support level is around $550.
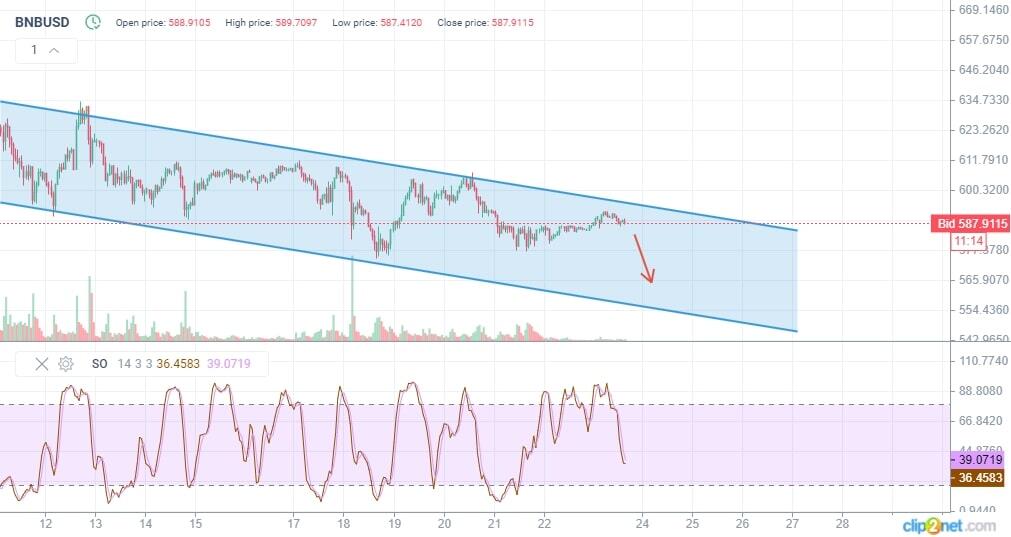
On the hourly time frame, the stochastic oscillator shows signs of an oversold market condition, hinting at a potential price correction in the next few days. If a decline occurs, the $600 mark will become a significant resistance level.
Consequently, the BNBUSD price will likely fluctuate within a downtrend over the next three months, with possible short-term corrections. Traders should carefully monitor the resistance and support levels, using the mentioned technical indicators to identify entry and exit points.
Long-Term BNBUSD Technical Analysis for 2024
The long-term technical analysis of BNBUSD for 2024 indicates several key factors influencing its price movement.
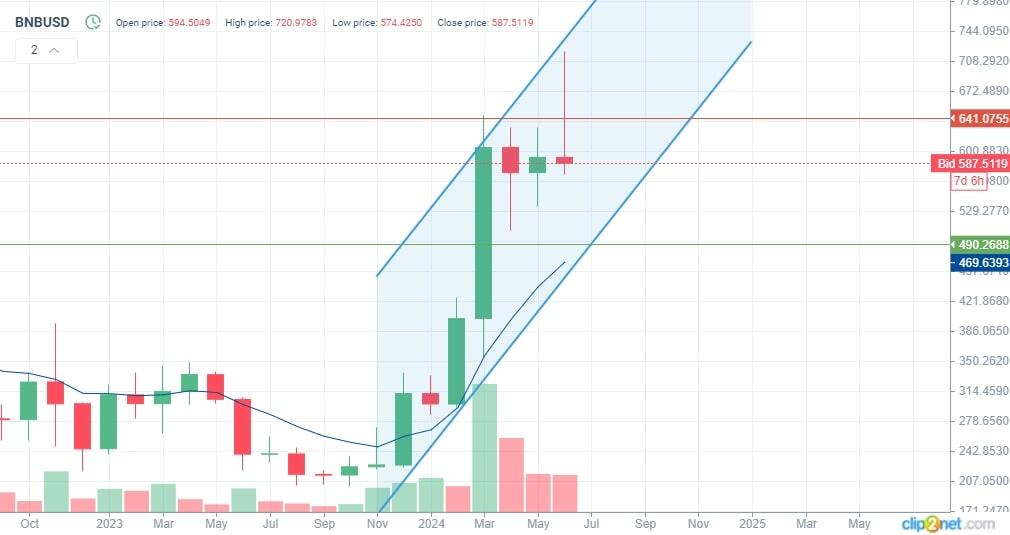
The monthly chart shows a clear uptrend. The candlesticks’ lows and highs form an uptrend, signaling strong buyer interest. The asset is trading above the 200-day moving average, which is a positive sign for long-term investors.
The key resistance levels are at $630 and $640. If the asset breaks through these levels, the BNBUSD price may increase rapidly. At the same time, support levels located around $490 and $510 offer protection in case of corrections.
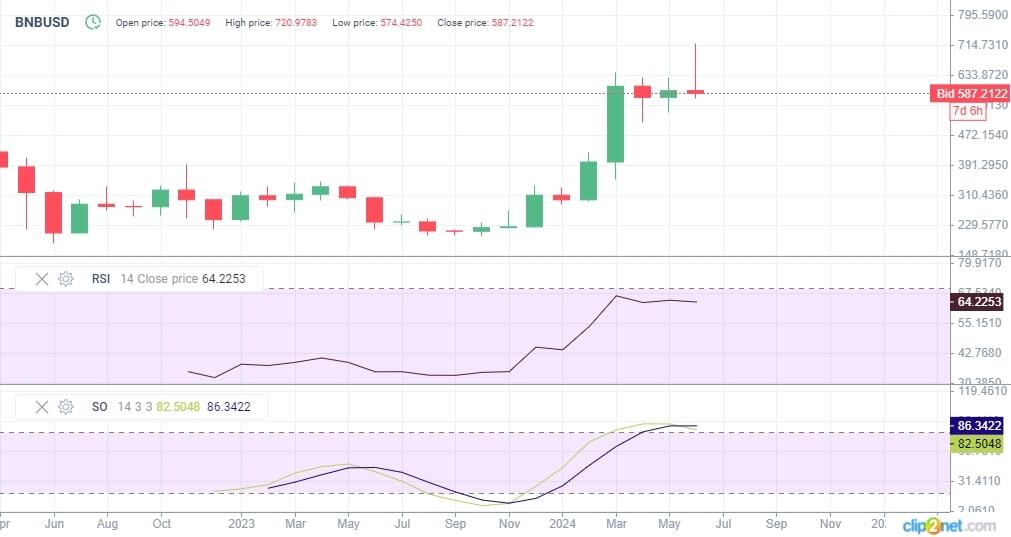
The stochastic oscillator and the RSI (Relative Strength Index) reveal an overbought condition on the monthly chart, indicating a potential correction before a new upward movement. These indicators are crucial for determining entry and exit points.
Overall, the BNBUSD price will likely maintain an uptrend in 2024.The price is likely to continue to rise as the BNB cryptocurrency fundamentals improve and the popularity of the Binance platform increases. Traders and investors should carefully monitor the support and resistance levels using technical analysis to make informed investment decisions.
| Month | BNBUSD price forecast | |
|---|---|---|
| Minimum, $ | Maximum, $ | |
| July | 644.12 | 698.35 |
| August | 664.34 | 725.32 |
| September | 698.10 | 753.09 |
| October | 712.54 | 789.19 |
| November | 734.64 | 826.02 |
| December | 764.98 | 856.36 |
Long-term trading plan for BNBUSD
The long-term trading plan for BNBUSD for the next three months and the coming year includes several key aspects based on technical analysis and current market conditions.
Targets for the next three months:
- support and entry levels are $500 and $560. Consider opening long-term positions there, as there will be strong support in these areas;
- the short-term target level is $630. The price is expected to reach this mark in the next 1-2 months, confirming the uptrend;
- the medium-term target level is $670. When the price reaches this level, traders should partially take profits or move stop-loss orders to protect their investments.
Targets for the year:
- the long-term target level is $1,000. This is the key psychological level that the price can reach during the year with sustained market growth and increased interest in BNB;
- the target level for the long-term strategy is $1,200. If the long-term uptrend is confirmed and BNB’s fundamentals strengthen, consider this level as a long-term target.
Recommendations and additional factors:
- monitor the stochastic oscillator on different time frames to validate buy or sell signals;
- place stop-loss and take-profit orders according to your strategy to minimize losses and protect profits.
Analysts’ BNB Exchange Rate Forecast for 2025–2026
Let’s take a look at BNBUSD experts’ forecasts for 2025–2026.
Changelly
According to Changelly, BNB will rise significantly over 2025–2026. The BNBUSD exchange rate will likely surpass the $1,000 mark by the end of summer in 2025 and climb even higher in 2026, potentially reaching beyond $2,000 by December. In the middle of 2026, the BNBUSD is forecast to be $1,459 per one Binance Coin.
| Month | Minimum, $ | Average Price, $ | Maximum, $ |
|---|---|---|---|
| 2025 | |||
| January | 584.11 | 700.49 | 654.47 |
| February | 637.47 | 746.18 | 716.16 |
| March | 690.82 | 791.86 | 777.84 |
| April | 744.17 | 837.54 | 839.53 |
| May | 797.53 | 883.22 | 901.21 |
| June | 850.88 | 928.91 | 962.90 |
| July | 904.23 | 974.59 | 1,024.58 |
| August | 957.59 | 1,020.27 | 1,086.26 |
| September | 1,010.94 | 1,065.95 | 1,147.95 |
| October | 1,064.29 | 1,111.64 | 1,209.63 |
| November | 1,117.65 | 1,157.32 | 1,271.32 |
| December | 1,171 | 1,203 | 1,333 |
| 2026 | |||
| January | 1,212.33 | 1,245.67 | 1,392.50 |
| February | 1,253.67 | 1,288.33 | 1,452 |
| March | 1,295 | 1,331 | 1,511.50 |
| April | 1,336.33 | 1,373.67 | 1,571 |
| May | 1,377.67 | 1,416.33 | 1,630.50 |
| June | 1,419 | 1,459 | 1,690 |
| July | 1,460.33 | 1,501.67 | 1,749.50 |
| August | 1,501.67 | 1,544.33 | 1,809 |
| September | 1,543 | 1,587 | 1,868.50 |
| October | 1,584.33 | 1,629.67 | 1,928 |
| November | 1,625.67 | 1,672.33 | 1,987.50 |
| December | 1,667 | 1,715 | 2,047 |
AMBCrypto
According to AMBCrypto, Binance Coin (BNB) will show significant growth over two years, with an average price of $512.06 in 2025, rising to $650.31 in 2026. The lowest price will also increase from $409.64 to $520.25, emphasizing its heightened resilience. The highest price will climb from $614.47 to $780.37, indicating high volatility and strong investor interest. This data suggests a potential surge in BNB’s popularity and its appeal in the ever-expanding cryptocurrency market.
| Year | Average, $ | Min, $ | Max, $ |
|---|---|---|---|
| 2025 | 512.06 | 409.64 | 614.47 |
| 2026 | 650.31 | 520.25 | 780.37 |
CoinPriceForecast
CoinPriceForecast offers price predictions for cryptocurrencies, including Binance Coin (BNB). According to their analysis, in 2025, the average price of BNB may reach $1,086 by mid-year and $1,412 by the end of the year. In 2026, the price may rise to $1,730 by mid-year and $1,832 by the end. These projections are grounded in analysts’ assessments of BNB’s anticipated price movements amid current trends in the cryptocurrency market.
| Year | Mid-Year, $ | Year-End, $ |
|---|---|---|
| 2025 | 1,086 | 1,412 |
| 2026 | 1,730 | 1,832 |
PricePrediction
PricePrediction‘s forecast suggests that the price of Binance Coin (BNB) will show significant growth in the next few years. Between January and December 2025, the average price of BNB is expected to increase from $743.05 to $1,038.25, reaching a high of $1,193.08 by the end of the year. In 2026, this growth will likely continue with an initial low of $996.72 in January and a possible high of $1,770.72 in December. This data reflects optimistic expectations about BNB’s prospects amid current trends in the cryptocurrency market.
| Year | Min, $ | Average, $ | Max, $ |
|---|---|---|---|
| 2025 | |||
| January | 672.29 | 743.05 | 764.28 |
| February | 737.04 | 765.34 | 794.00 |
| March | 767.65 | 795.96 | 824.62 |
| April | 784.45 | 819.84 | 864.42 |
| May | 816.12 | 844.43 | 897.21 |
| June | 833.01 | 861.32 | 930.99 |
| July | 867.47 | 895.77 | 965.44 |
| August | 885.38 | 913.69 | 1,010.23 |
| September | 914.85 | 950.24 | 1,055.91 |
| October | 950.44 | 978.74 | 1,103.42 |
| November | 989.59 | 1,017.89 | 1,152.36 |
| December | 1,002.87 | 1,038.25 | 1,193.08 |
| 2026 | |||
| January | 996.72 | 1,090.16 | 1,121.31 |
| February | 1,060.05 | 1,111.97 | 1,175.82 |
| March | 1,104.53 | 1,156.44 | 1,220.30 |
| April | 1,150.79 | 1,202.70 | 1,266.56 |
| May | 1,186.87 | 1,238.78 | 1,314.66 |
| June | 1,246.81 | 1,288.34 | 1,376.60 |
| July | 1,287.96 | 1,339.87 | 1,441.02 |
| August | 1,341.55 | 1,393.46 | 1,494.61 |
| September | 1,379.80 | 1,421.33 | 1,550.35 |
| October | 1,436.66 | 1,478.19 | 1,621.42 |
| November | 1,455.84 | 1,507.75 | 1,695.33 |
| December | 1,511.45 | 1,552.98 | 1,770.72 |
Long-Term BNB Price Predictions 2027–2031
Let’s take a look at BNBUSD’s expert forecasts for 2027–2031.
Changelly
Changelly‘s Binance Coin (BNB) forecasts show impressive growth for the next five years. In 2027, the lowest price is projected to rise to $1 966,58, the average price to reach $2 014,92, and the highest price to climb to $2 531,25. In 2028, BNB will rise even further, with an average of $3 213.92. In 2029, BNB will reach a high of $4 922, representing a remarkable growth. In 2030 and 2031, the price will grow further, potentially breaching $10 000 level.
| Year | Minimum, $ | Average, $ | Maximum, $ |
|---|---|---|---|
| 2027 | 1966,58 | 2014,92 | 2531,25 |
| 2028 | 3104,63 | 3213,92 | 3415,75 |
| 2029 | 4404,25 | 4545,17 | 4922 |
| 2030 | 6394,46 | 6605,04 | 7498,92 |
| 2031 | 9591,29 | 9879,38 | 11103,38 |
AMBCrypto
AMBCrypto projects a bullish future for BNB, predicting a rise from $825.89 in 2027 to $2148.52 by 2031. The forecast is based on algorithmic analysis, highlighting a generally positive market sentiment. However, traders should take into account broader market factors and conduct technical and fundamental analysis.
| Year | Average, $ | Min, $ | Max, $ |
|---|---|---|---|
| 2027 | 825.89 | 660.71 | 991.07 |
| 2028 | 1048.88 | 839.11 | 1258.66 |
| 2029 | 1332.08 | 1065.67 | 1598.50 |
| 2030 | 1691.75 | 1353.40 | 2030.10 |
| 2031 | 2148.52 | 1718.81 | 2578.22 |
CoinPriceForecast
CoinPriceForecast‘s projections for Binance Coin (BNB) over the next five years are optimistic. In 2027, the average price of BNB will rise to $1,632 by mid-year and reach $1,720 by the end. In 2028, the price will grow to $1,684; in 2029 the price will also climb to $1,852. In 2030 and 2031, the price may also rise to $1,731 and $1,950.
| Year | Mid-Year, $ | Year-End, $ |
|---|---|---|
| 2027 | 1,632 | 1,720 |
| 2028 | 1,665 | 1,684 |
| 2029 | 1,776 | 1,852 |
| 2030 | 1,860 | 1,731 |
| 2031 | 1,840 | 1,950 |
PricePrediction
According to PricePrediction, Binance Coin’s (BNB) price will likely rise significantly in the coming years. In 2027, BNB may range between $1839,25 and $2150,74. In 2028, the price will grow to $2599,08 – $2993,12. In 2030, the price will also soar to $5597,81. 2031 will see BNB growing further, potentially reaching the highs of $8972.82. This optimistic forecast can serve as a basis for investment decisions as long as market volatility and other factors are considered.
| Year | Min, $ | Average, $ | Max, $ |
|---|---|---|---|
| 2027 | 1839,25 | 1913,02 | 2150,74 |
| 2028 | 2599,08 | 2702,36 | 2993,12 |
| 2029 | 3838,74 | 3984,5 | 4261,52 |
| 2030 | 5360,29 | 5597,81 | 6393,87 |
| 2031 | 7770,45 | 8088,43 | 8972,82 |
Recent Price History of BNB
The recent price history of Binance Coin (BNB) reflects a dynamic and volatile journey. As of December 31, 2022, BNB opened at $247.19 and saw a close at $247.66 with a market cap of $39.59B and a trading volume of $870.61M. This represents a notable decrease from the previous year’s close at $512.31 on December 31, 2021, with a significantly higher market cap of $86.27B. In 2020, the BNB price ended trading at $37.38 with a market cap of $5.39B.
2019 and 2018 saw even lower market caps and closing prices, reflecting the coin’s growth over time. These figures illustrate the fluctuating nature of BNB market performance, influenced by various factors, including market sentiment, technological advancements, and broader economic conditions.
Factors That Can Affect the BNB Price
Understanding the following factors is crucial to predicting the price movement of BNB:
- Binance Ecosystem Utility: Higher utility within Binance increases BNB’s demand and price.
- Coin Burns: Regular BNB destruction reduces supply, potentially boosting value.
- Speculation: Trader sentiment heavily influences BNB’s volatile price swings.
- Regulatory Environment: Regulatory changes can significantly affect BNB’s accessibility and demand.
- Competition: Rival exchange tokens and platforms can impact BNB’s market dominance and price.
- Market Trends: Overall, crypto market trends can lift or depress the BNB price.
Conclusion: Is BNB a Good Investment?
BNB, the native token of the influential Binance platform, shows promising prospects as a long-term investment in the volatile crypto landscape. The platform’s expanding services, strategic coin management, and increasing market adoption buoy its anticipated growth. The token’s intrinsic value is expected to rise, reflecting its utility and the ecosystem’s robustness.
However, potential investors should remain aware of the inherent market volatilities, regulatory shifts, and competitive pressures accompanying any crypto asset. Overall, BNB stands out as a notable contender in the investment realm, offering a blend of growth potential and utility yet necessitating a balanced approach considering the market’s complexities.
FAQs on BNB Price Prediction
The Binance Coin price is trading at around $577.8000 per BNB token as of today 01.07.2024.
Experts estimate that BNB may reach $549 – $1,097 by the end of 2024 based on Changelly’s, AMBcrypto’s, and CoinPriceForecast’s data.
In 2025, the BNB price may range from $520.25 to $1,412. This forecast considers various scenarios, including possible regulatory changes and the growing popularity of cryptocurrencies, which affect investment decisions and strategies.
The experts suggest optimism in long-term growth for BNB, indicating potential for significant appreciation, but they do not expect a tenfold increase.
According to many analysts, the value of BNB may exceed $5,000 by 2031. The most optimistic scenarios suggest that the price of Binance Coin may soar to over $10,000.
Yes, BNB can be a promising investment. Binance’s strategic growth and the escalating use of cryptocurrencies in a wide range of industries are significant factors that could lead to a substantial increase in BNB value. BNB’s role in the ecosystem of one of the most popular cryptocurrency exchanges further strengthens its long-term price stability and growth.
The BNB price is affected by its utility within the Binance ecosystem, coin-burning events, competition from other exchange tokens, and overall market trends.
Further development of the Binance blockchain could enhance BNB’s utility and adoption, potentially leading to an increase in its price.
Binance’s quarterly burn events reduce the total supply of BNB, which could increase its scarcity and drive up valuation.
BNB ranks 4th with a market cap of around $48.93 billion, behind Bitcoin and Ethereum as of late 2023.
Price chart of BNBUSD in real time mode
The content of this article reflects the author’s opinion and does not necessarily reflect the official position of LiteFinance. The material published on this page is provided for informational purposes only and should not be considered as the provision of investment advice for the purposes of Directive 2004/39/EC.
{{value}} ( {{count}} {{title}} )
This post is originally published on LITEFINANCE.

