
A resumption of trade wars could halve China’s economic growth. The currencies of trading partner countries will be the main victims. Should we be surprised by the fall of the AUDUSD pair? Let’s discuss this topic and make a trading plan.
The article covers the following subjects:
Highlights and key points
- The Trump trade dominates monetary policy.
- The currencies of China’s trading partner countries suffer.
- Carry-trade does not help the aussie as the yen strengthens.
- As long as AUDUSD is trading below 0.665, short trades can be considered.
Weekly Australian dollar fundamental forecast
In the period leading up to the US presidential election, investors were expected to prioritize this event, which was anticipated to occur in the fall or late summer at best. This created an opportunity to speculate on a divergence in monetary policy between the Reserve Bank of Australia and the Federal Reserve and to purchase the AUDUSD pair. However, only the first of the two targets was reached at 0.675. Subsequently, the pair experienced a sudden and significant decline. The premature arrival of the Trump trade in the financial markets is to blame for this.
It would appear that the expansion of Australian employment in June by 50.2K and the related enhancement in the likelihood of a cash rate increase in August from 12% to 20% should have fueled the AUDUSD rally. Derivatives indicate a 94% probability of a Fed rate cut in September.
However, the Trump trade is overshadowing monetary policy, as evidenced by the widening Treasury yields spread. The presidential debate has increased the likelihood of a Republican victory in November, leading to a notable rise in the difference between short- and long-term Treasury yields.
US Treasury bond yield differential
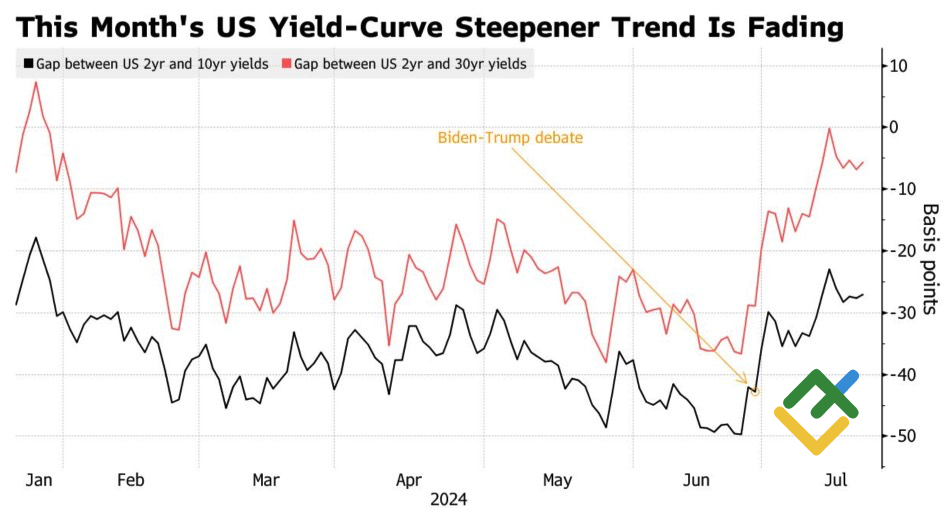
Source: Bloomberg.
Donald Trump’s return to the White House will result in 60% tariffs on all Chinese imports. UBS estimates this will result in a 2.5pp slowdown in China’s GDP. The company predicts that Asia’s largest economy will expand by 4.6% in 2025 and 4.2% in 2026. However, a renewed trade war would bring those numbers down to 3%. This is contingent on Beijing refraining from retaliatory measures against Washington, maintaining current incentives for exporters, and exploring alternative supply chains. Otherwise, the impact will be significantly greater, with the new US tariffs affecting China’s trading partners. This is the likely reason for the poor performance of the Australian and New Zealand dollars in the second half of July.
China exports to United States
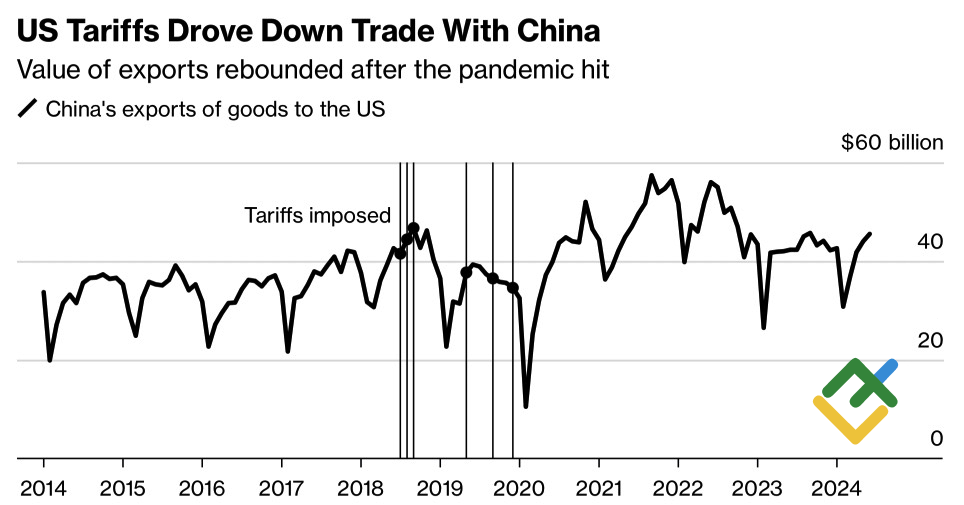
Source: Bloomberg.
However, the currencies should have been reinforced by the influx of capital from Latin America. In 2022-2023, carry traders favored the Mexican peso and Brazilian real, but the increasing volatility of these currencies compelled those seeking to capitalize on them to seek alternative opportunities. Thus, the aussie and kiwi came into play.
Emerging currencies’ volatility
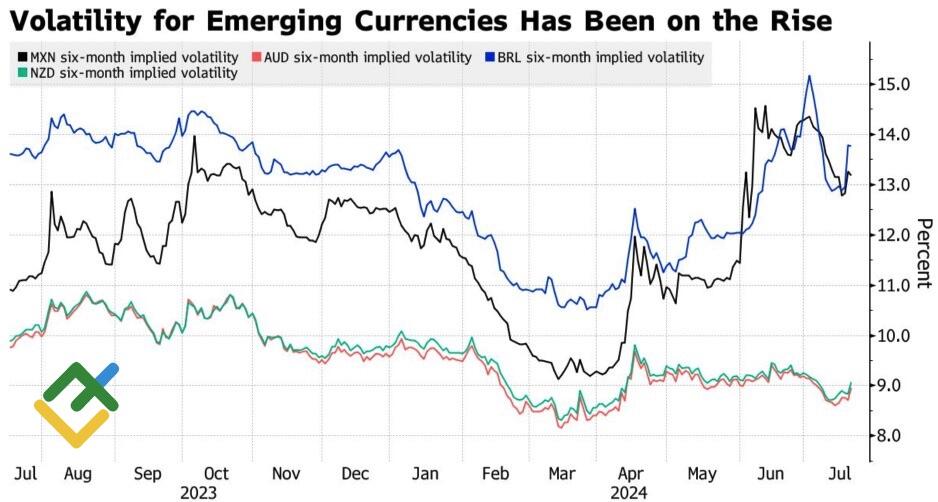
Source: Bloomberg.
The strengthening of the yen, the main funding currency in carry trade operations, has put an end to the bulls’ plans for the AUDUSD pair. Given the current market conditions, carry trade is no longer a viable strategy, resulting in the closure of trades and a decline in the Australian dollar.
Weekly AUDUSD trading plan
It is unclear how long the Australian dollar’s decline will persist. However, it seems unlikely that investors will abandon the Trump trade in the near term. Additionally, the Bank of Japan’s normalization of monetary policy will likely reinforce the yen. Therefore, short trades on the AUDUSD pair remain relevant unless the pair pierces the 0.665 level from below.
Price chart of AUDUSD in real time mode

The content of this article reflects the author’s opinion and does not necessarily reflect the official position of LiteFinance. The material published on this page is provided for informational purposes only and should not be considered as the provision of investment advice for the purposes of Directive 2004/39/EC.
{{value}} ( {{count}} {{title}} )
This post is originally published on LITEFINANCE.


