The volatile cryptocurrency trading world is filled with risks and rewards. For traders interested in Zilliqa (ZIL), the key question is, Does this crypto asset have a bright future? Based on current analysis, the answer is a cautious ”yes”.
While Zilliqa has seen significant price swings since its launch in 2017, its long-term growth prospects remain promising. The blockchain platform is gaining increasing adoption, especially among decentralized apps and fintech companies. With solid technology and an expanding ecosystem, Zilliqa appears positioned for further expansion, and the cryptocurrency has the potential to grow.
This article explores Zilliqa price predictions from top analysts and provides a detailed technical analysis of the cryptocurrency. This data will help traders decide whether ZIL is a profitable investment.
Let us explore the key Zilliqa price predictions and analysis to assess the potential future of this promising blockchain platform.
The article covers the following subjects:
Highlights and Key Points: Zilliqa Price Forecast 2024–2030
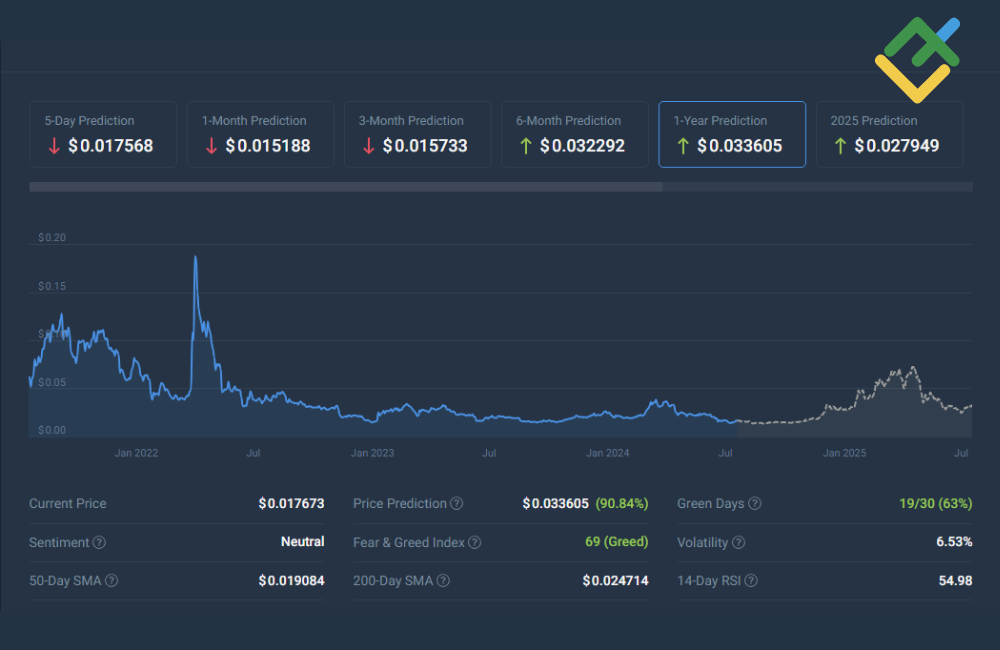
- The current ZIL price is hovering around $0.01780, showing low volatility after the last uptrend in 2022. According to analysts, the stagnation will continue for some time.
- In 2024, the price is projected to trade between $0.0231 and $0.0382, with an increase in the second half of the year. A gradual and modest rise is expected due to platform expansion and positive factors related to cryptocurrency adoption.
- For 2025, experts predict that the price will trade in an uptrend ranging between $0.0365 and $0.0454. Other analysts believe there will be a period of high volatility in 2025, and the asset may theoretically reach $0.0733.
- 2026 is a year of uncertainty for the ZIL token. Overall, analysts are optimistic about this year, predicting a systematic price growth, but there is also an opinion that the asset will trade in a narrow range of $0.0540 – $0.0637.
- Long-term predictions agree that the Zilliqa price will increase. By 2030, the token value is expected to range between $0.13 and $0.2510. This wide range is due to the high uncertainty in the cryptocurrency market in the long term. Much will depend on geopolitical factors, the sentiment of crypto traders in general, the US Federal Reserve rate, and the Zilliqa community development in particular.
- Considering a short-term perspective, the instrument continues to trade in a downtrend. To reverse the trend upward, bulls should set the price above the nearest key high near $0.0255.
Zilliqa Price Today in Coming Days and Week
When forecasting the ZIL/USD exchange rate in the near term, focus on several key factors. Monitor developments and updates within the Zilliqa blockchain, as technological advancements can drive investor interest and adoption. Pay attention to cryptocurrency market sentiment, which heavily influences price movements. Stay updated on regulatory news, as changes in cryptocurrency regulations can impact market conditions. Analyze trading volumes and liquidity, as these metrics indicate market strength and potential volatility. Additionally, watch for partnerships and integrations with other projects, enhancing Zilliqa’s utility and appeal to investors.
ZIL Crypto Price Forecast for 2024: Analysts’ Recommendations
Let’s find out what the ZIL rate will be in the future. Most experts believe that the token’s rate will be quite volatile.
Changelly
Price range in 2024: $0.0140 – $0.0231 (as of July 17, 2024)
Changelly forecasts the lowest price of $0.0140 in August and the highest one of $0.0231 in December 2024. The average projected price for year-end is $0.0190. Experts anticipate the optimistic sentiment to increase the rate, fueled by fundamentals such as the broader adoption of dApps on the Zilliqa network.
The prediction suggests the rate will reach the lowest level in the summer of 2024 and then gradually rise and continue to grow in 2025. Sharp spikes in volatility are not expected. Thus, trading will proceed as usual, with the downtrend reversal. Optimism regarding regulating cryptocurrencies in the United States will likely contribute to the increase in quotations.
| Month | Minimum Price, $ | Average Price, $ | Maximum Price, $ |
|---|---|---|---|
| August | 0.0140 | 0.0169 | 0.0198 |
| September | 0.0149 | 0.0176 | 0.0203 |
| October | 0.0194 | 0.0204 | 0.0214 |
| November | 0.0146 | 0.0184 | 0.0222 |
| December | 0.0148 | 0.0190 | 0.0231 |
PricePrediction
Price range in 2024: $0.0181 – $0.0233 (as of July 17, 2024)
According to PricePrediction experts, slow and steady bullish movement is predicted for ZILUSD rates for the rest of 2024. The averages will surge to $0.0213 by December, with maximum price rising to $0.0233, showing strong crypto investors’ confidence.
| Month | Minimum Price, $ | Average Price, $ | Maximum Price, $ |
|---|---|---|---|
| August | 0.0181 | 0.0187 | 0.0196 |
| September | 0.0184 | 0.0193 | 0.0206 |
| October | 0.0190 | 0.0197 | 0.0215 |
| November | 0.0198 | 0.0205 | 0.0225 |
| December | 0.0206 | 0.0213 | 0.0233 |
CoinCodex
Price range in 2024: $0.0145 – $0.0340 (as of July 17, 2024)
According to CoinCodex, Zilliqa will trade flat until late autumn of 2024, and starting from November, the quotes will grow, reaching the highest level near $0.0340 by early December. Experts suggest that within the next three months, traders will open positions. After that, they will likely try to increase the price and lock in profits at the beginning of next year. Long trades in the long-term perspective are profitable, as volatility spikes are not predicted.
DigitalCoinPrice
Price range in 2024: $0.0145 – $0.0382 (as of July 17, 2024)
DigitalCoinPrice offers a generally positive outlook for 2024. Experts anticipate high volatility for the rest of the year. The price low of $0.0145 is expected in August, and a high of $0.0382 – in December. The price may change by 50%–80% in a month, so investors should closely monitor open positions and take profit in time.
Key highlights include:
- Low volatility in August and September suggests that traders will likely open long positions.
- The last three months of the year will be characterized by a persistent struggle between bulls and bears, implying rate hikes from $0.0151 to $0.0382.
- However, the year-end outlook remains positive, indicating interest in the cryptocurrency.
| Month | Minimum Price, $ | Average Price, $ | Maximum Price, $ |
|---|---|---|---|
| August | 0.0145 | 0.0172 | 0.0376 |
| September | 0.0158 | 0.0166 | 0.0381 |
| October | 0.0154 | 0.0316 | 0.0379 |
| November | 0.0151 | 0.0331 | 0.0372 |
| December | 0.0148 | 0.0297 | 0.0382 |
ZILUSD Technical Analysis
Let us analyze the daily chart of the ZILUSD cryptocurrency pair to explore the historical price movement.
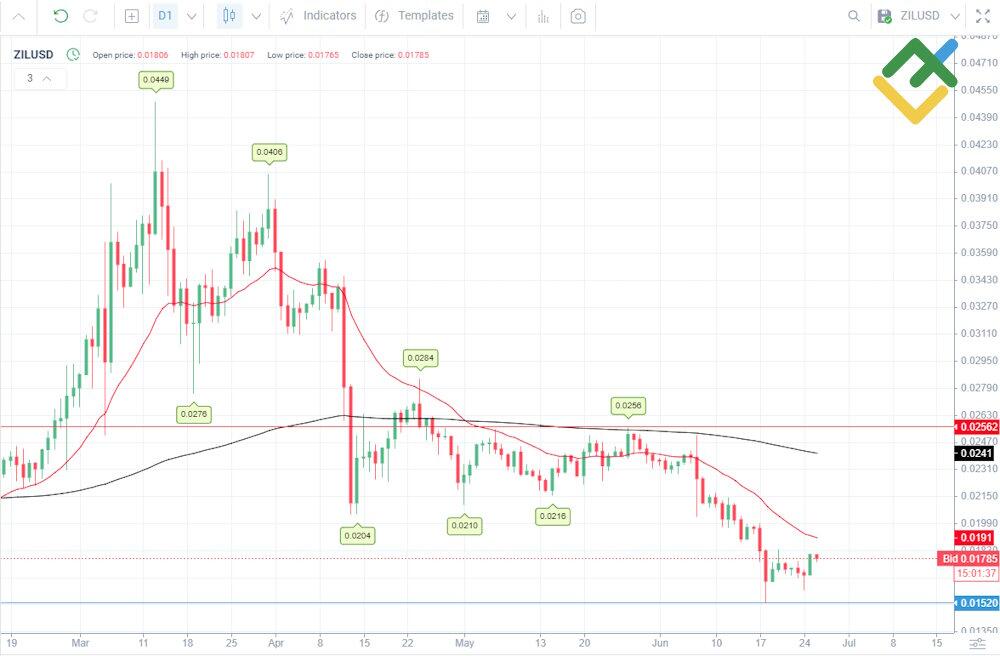
The declining key highs and lows on the chart indicate a long-term downtrend. The moving averages EMA(21) and EMA(190) are also moving downward, indicating a short-term and long-term downtrend.
The price reached a low of $0.0152 on June 18. Now, the cryptocurrency pair is trading in an upward correction. Short trades can be considered at the nearest resistance levels marked by the EMA(21) and EMA(190). The key trend resistance is located near the May 27 high of $0.0256. The June low of $0.0152 will become the bearish target.
Let us use the Bears Power and RSI indicators for a detailed analysis of the current market situation.
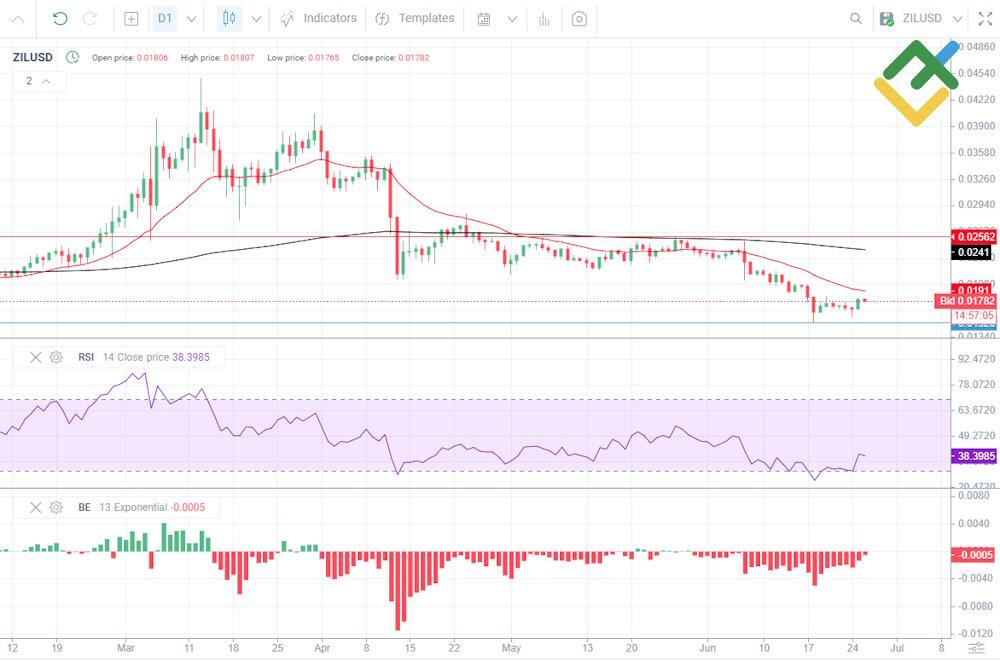
The RSI indicator entered the oversold area when the price hit the June 18 low. After that, it returned to a neutral area, and the correction started. The RSI readings suggest considering short trades for now.
The Bears Power indicator histogram is growing but is still in the negative zone, indicating the strength of the bearish trend. However, short trades are not profitable on the growing histogram bars. To open short trades, one should wait for the Bears Power indicator to form the maximum and for the histogram to decrease.
Get access to a demo account on an easy-to-use Forex platform without registration
ZILUSD Analysis For Next Three Months
To forecast the ZILUSD rate for three months, it is better to use a daily chart with the Ichimoku indicator. This will allow you to identify various trends and potential pivot points.
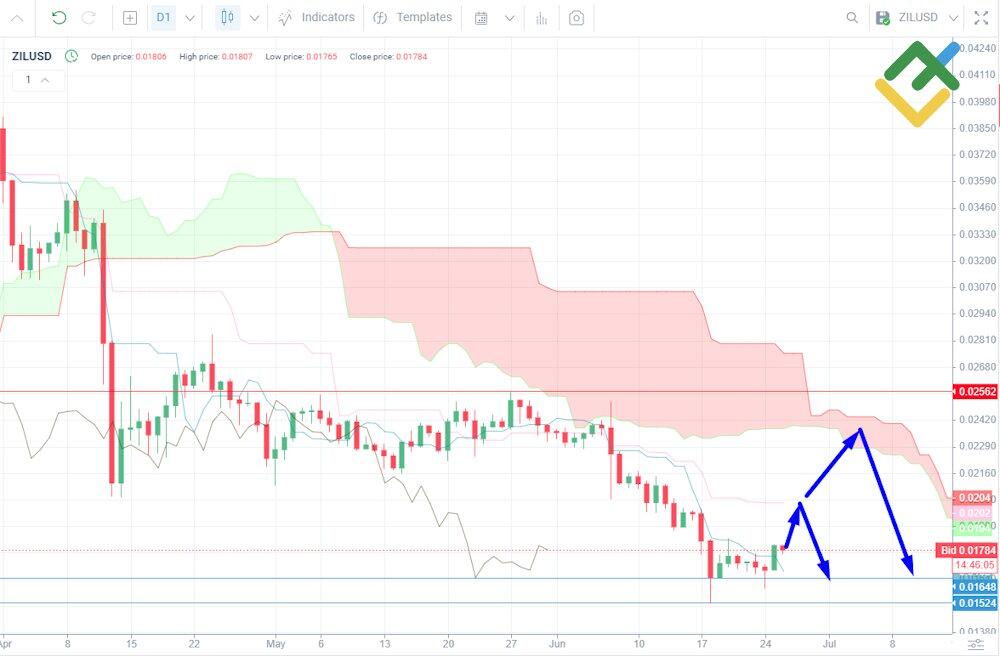
The Ichimoku indicator shows that a red colored cloud is forming to the right of the current price, indicating a potential continuation of the long-term downtrend. The Tenkan and Kijun lines are descending, which also points to a short-term and medium-term downtrend. The Chikou line, which is used as an oscillator, is near the current price. This allows traders to consider both long and short trades.
Thus, the ZIL/USD pair may continue falling within the next three months. In order to get a favorable entry point for short trades, one should wait for a correction to some significant resistance level. The Tenkan and Kijun lines of the Ichimoku indicator, as well as the Ichimoku cloud itself act as such levels.
The price has broken through the resistance — the Tenkan line, implying that the asset may continue its upward correction. The Kijun line is near $0.0202. This is the first entry point for short trades. If the price breaks through the Kijun resistance, the correction will reach the Ichimoku cloud. Along with the key resistance of $0.0256, the red cloud will represent the resistance area, offering the second entry point for short trades. The bearish target will be the $0.0164–$0.0152 zone.
Long-Term ZILUSD Technical Analysis for 2024
For a long-term analysis, we should switch to the weekly time frame, mark the key levels by significant highs and lows, and use the Ichimoku indicator.
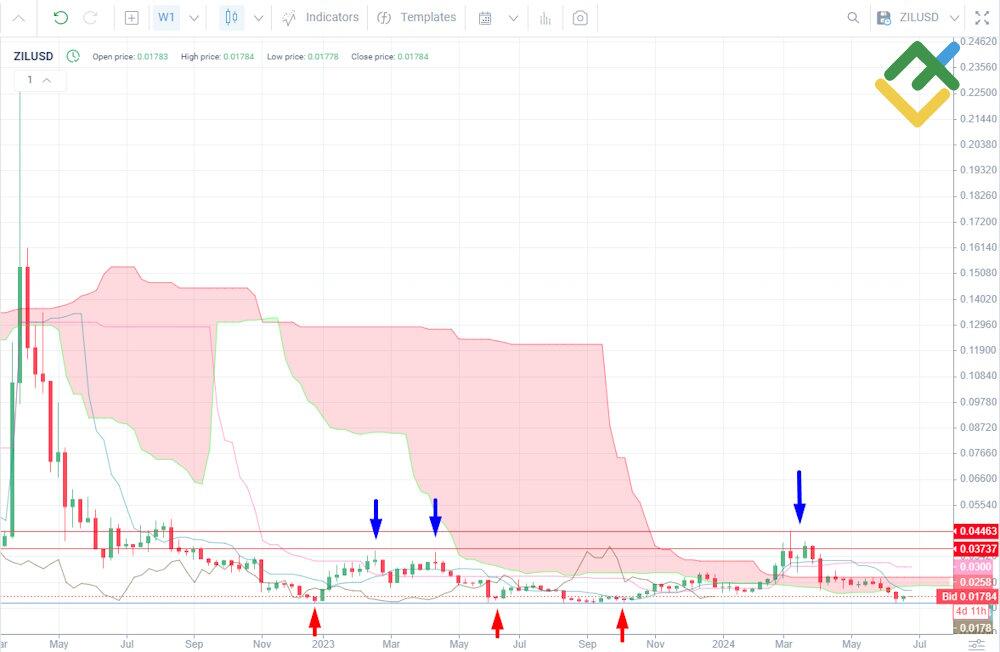
The chart shows that the rapid growth in March 2022 was completely engulfed by the decline in April–June 2022. After that, the pair started trading in a global downtrend. The price reached the support $0.0152 within the downtrend in December 2022. Following this, the price repeatedly failed to break through this level in 2023, which means that the $0.0152 level is the key support.
In April 2023 and March 2024, the asset failed to pierce the resistance level of $0.0373, reached in February 2023. In March 2024, another resistance level of $0.0446 formed. The $0.0373 and $0.0446 levels represent the area of the key trend resistance. As long as the price is trading below this area, one may consider short trades. If the price breaches the resistance, the downtrend will reverse. In this case, consider long-term purchases of the instrument.
The Ichimoku cloud has been red for a long time. However, in June 2024, a green cloud began to form to the right of the price. After that, the green cloud was replaced by a red one again, suggesting that the price trades in a flat. In this case, consider long trades near the key support level of $0.0152 and short trades near the key resistance of $0.0373–$0.0446 with the targets on the opposite boundaries of the sideways channel.
The Tenkan and Kijun lines do not have a clear direction, confirming that the quotes move sideways in the trading range of $0.0152–$0.0446.
| Month | ZILUSD Price Forecast | |
| Min, $ | Max, $ | |
| July | 0.0152 | 0.0259 |
| August | 0.0225 | 0.0322 |
| September | 0.0229 | 0.0373 |
| October | 0.0350 | 0.0405 |
| November | 0.0370 | 0.0446 |
| December | 0.0405 | 0.0510 |
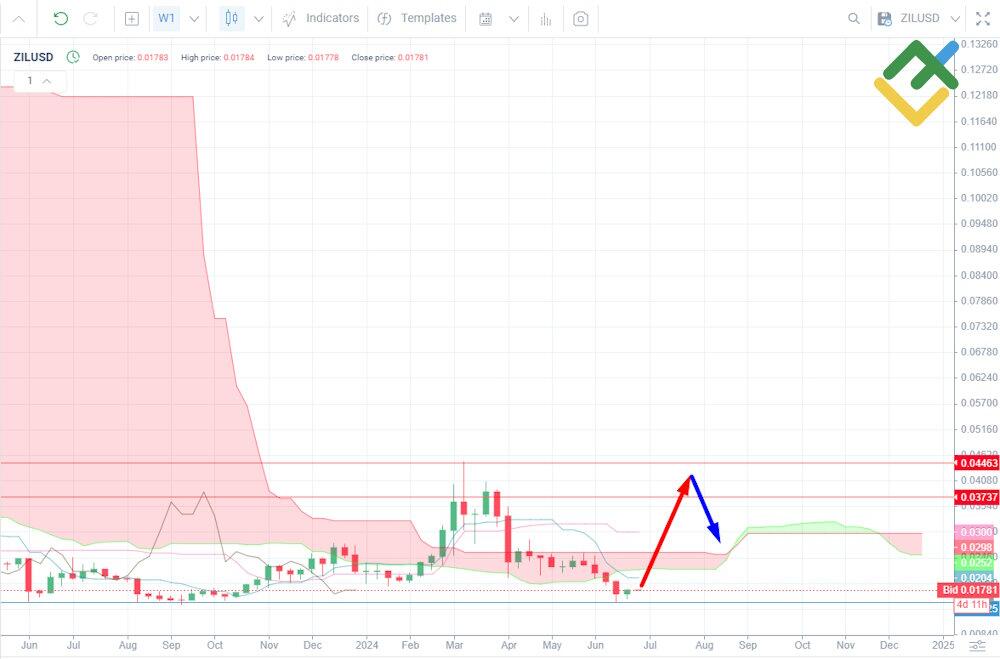
Long-Term Trading Plan for ZILUSD
The technical analysis can be used to make a long-term trading plan for the ZIL/USD pair:
- During the next three months, the price may trade in an upward correction with the targets at the resistance of $0.0202 or $0.0245. If the price remains below these levels, the quotes may fall with the bearish target at the June low of $0.0152.
- In 2024, the price is expected to trade in a wide range between $0.0152 and $0.0446.
- If the price remains below the $0.0152 level, the asset will start to rise to the upper boundary of the flat near $0.0446.
- If the price remains below $0.0446 further, the asset will drop to the boundary at $0.0152.
- To continue the global downtrend, the price should break through and consolidate below the support of $0.0152. In this case, the asset may decline with a target at the 2020 low near $0.0032.
- To reverse the downtrend, the price should breach and consolidate above the resistance of $0.0446. In this case, the quotes may rapidly grow with the targets at $0.0620 and $0.0970.
Traders should consider that long-term forecasting is approximate and may change due to external factors such as the US Federal Reserve rate, the SEC crypto-asset policy, and the general trend in the cryptocurrency market.
Zilliqa Price Predictions for 2025
Will the ZIL price rise? Most experts predict an increase in the value of the asset. Moderate volatility is expected.
Changelly
Price range in 2025: $0.0154 – $0.0365 (as of July 17, 2024)
According to the technical analysis by Changelly‘s cryptocurrency experts, Zilliqa (ZIL) is anticipated to experience a gradual increase throughout 2025.
The forecasted lowest price starts at $0.0154 in January and rises to $0.0310 by December. Similarly, the highest price is expected to grow from $0.0200 in January to $0.0365 by the end of the year.
The average trading price corresponds to the uptrend, beginning at $0.0237 and reaching $0.0319 by December. This projection illustrates a bullish outlook for Zilliqa in 2025, with prices steadily climbing, suggesting increasing investor confidence and potential market growth for the ZIL token.
Analysts anticipate a period of normal volatility, which is ideal for holding long-term positions.
| Month | Minimum Price, $ | Average Price, $ | Maximum Price, $ |
|---|---|---|---|
| January | 0.0154 | 0.0200 | 0.0237 |
| February | 0.0168 | 0.0215 | 0.0244 |
| March | 0.0183 | 0.0230 | 0.0252 |
| April | 0.0197 | 0.0245 | 0.0259 |
| May | 0.0211 | 0.0260 | 0.0267 |
| June | 0.0225 | 0.0274 | 0.0275 |
| July | 0.0239 | 0.0282 | 0.0290 |
| August | 0.0253 | 0.0289 | 0.0305 |
| September | 0.0268 | 0.0297 | 0.0320 |
| October | 0.0282 | 0.0304 | 0.0335 |
| November | 0.0296 | 0.0312 | 0.0350 |
| December | 0.0310 | 0.0319 | 0.0365 |
PricePrediction
Price range in 2025: $0.0204 – $0.0365 (as of July 17, 2024)
PricePrediction analysts are also optimistic about ZIL 2025 performance. It is predicted that the average price will be steadily growing from $0.0224 to $0.0319, showing the continuation of 2024 bullish trend. Growth is also predicted in minimum and maximum levels, and the volatility levels are pretty low — this outlook should encourage investors to open long positions.
| Month | Minimum Price, $ | Average Price, $ | Maximum Price, $ |
|---|---|---|---|
| January | 0.0204 | 0.0224 | 0.0230 |
| February | 0.0222 | 0.0233 | 0.0239 |
| March | 0.0231 | 0.0240 | 0.0248 |
| April | 0.0236 | 0.0244 | 0.0258 |
| May | 0.0243 | 0.0252 | 0.0270 |
| June | 0.0253 | 0.0262 | 0.0280 |
| July | 0.0261 | 0.0270 | 0.0293 |
| August | 0.0272 | 0.0280 | 0.0307 |
| September | 0.0278 | 0.0286 | 0.0321 |
| October | 0.0287 | 0.0297 | 0.0335 |
| November | 0.0301 | 0.0309 | 0.0350 |
| December | 0.0310 | 0.0319 | 0.0365 |
CoinCodex
Price range in 2025: $0.0144 – $0.0733 (as of July 17, 2024)
CoinCodex projects a period of very high volatility for the ZIL/USD pair. The forecast suggests the lowest price is near $0.0144, and the highest one is near $0.0733. If the highest price is reached, the token will grow by 311.41%.
| Year | Minimum, $ | Maximum, $ |
|---|---|---|
| 2025 | 0.014345 | 0.07328 |
DigitalCoinPrice
Price range in 2025: $0.0371 – $0.0454 (as of July 17, 2024)
According to DigitalCoinPrice, the asset will trade in a small range between $0.0371 and $0.0454. This indicates the absence of any trend. Thus, it will be unprofitable for long-term investors to hold trading positions.
In this case, the trading approach should be changed. When the price reaches the highs, one should consider short trades, and when it hits the lows, one should open long trades with the targets at the opposite boundaries of the trading range. At the end of the year, the average price is projected to be $0.0382.
| Month | Minimum Price, $ | Average Price, $ | Maximum Price, $ |
|---|---|---|---|
| January | 0.0376 | 0.0410 | 0.0452 |
| February | 0.0376 | 0.0400 | 0.0411 |
| March | 0.0378 | 0.0389 | 0.0419 |
| April | 0.0379 | 0.0405 | 0.0411 |
| May | 0.0377 | 0.0385 | 0.0444 |
| June | 0.0373 | 0.0388 | 0.0406 |
| July | 0.0373 | 0.0434 | 0.0444 |
| August | 0.0371 | 0.0420 | 0.0448 |
| September | 0.0371 | 0.0389 | 0.0395 |
| October | 0.0374 | 0.0398 | 0.0433 |
| November | 0.0377 | 0.0388 | 0.0454 |
| December | 0.0375 | 0.0382 | 0.0400 |
Zilliqa Price Predictions for 2026
The experts’ forecasts for 2026 are ambiguous. Some sources predict rapid price growth, while others suggest flat trading or sharp fluctuations of quotations in a wide range.
Changelly
Price range in 2026: $0.0.0324 – $0.0540 (as of July 17, 2024)
In 2026, Zilliqa’s value is projected by Changelly to steadily increase throughout the year. The year will start with an average price of $0.0333. By the end of the year, the price will reach $0.0486. This analysis suggests the development of an uptrend with moderate volatility and regular corrections.
| Month | Minimum Price, $ | Average Price, $ | Maximum Price, $ |
|---|---|---|---|
| January | 0.0324 | 0.0333 | 0.0380 |
| February | 0.0337 | 0.0347 | 0.0394 |
| March | 0.0351 | 0.0361 | 0.0409 |
| April | 0.0364 | 0.0375 | 0.0423 |
| May | 0.0378 | 0.0389 | 0.0438 |
| June | 0.0392 | 0.0403 | 0.0453 |
| July | 0.0405 | 0.0416 | 0.0467 |
| August | 0.0419 | 0.0430 | 0.0482 |
| September | 0.0432 | 0.0444 | 0.0496 |
| October | 0.0446 | 0.0458 | 0.0511 |
| November | 0.0459 | 0.0472 | 0.0525 |
| December | 0.0473 | 0.0486 | 0.0540 |
PricePrediction
Price range in 2026: $0.0306 – $0.0540 (as of July 17, 2024)
The optimism of recent PricePrediction forecasts is also present in ZILUSD 2026 price prediction. Steady growth from $0.0335 to $0.0486 is forecasted in average price levels. Maximum levels will surge to $0.0540, the lowest level will also rise, to $0.0473. This, alongside low volatility levels, makes ZILUSD a promising asset.
| Month | Minimum Price, $ | Average Price, $ | Maximum Price, $ |
|---|---|---|---|
| January | 0.0306 | 0.0335 | 0.0344 |
| February | 0.0332 | 0.0348 | 0.0361 |
| March | 0.0342 | 0.0358 | 0.0375 |
| April | 0.0357 | 0.0373 | 0.0393 |
| May | 0.0372 | 0.0388 | 0.0408 |
| June | 0.0387 | 0.0403 | 0.0427 |
| July | 0.0403 | 0.0419 | 0.0443 |
| August | 0.0415 | 0.0428 | 0.0460 |
| September | 0.0425 | 0.0440 | 0.0481 |
| October | 0.0442 | 0.0458 | 0.0499 |
| November | 0.0451 | 0.0467 | 0.0522 |
| December | 0.0473 | 0.0486 | 0.0540 |
CoinCodex
Price range in 2026: $0.0193 – $0.0637 (as of July 17, 2024)
CoinCodex analysts expect a large price spread. The ZILUSD pair is expected to reach the lowest price near $0.0193, and the highest one near $0.0637.
| Year | Minimum, $ | Maximum, $ |
|---|---|---|
| 2026 | 0.019323 | 0.063712 |
DigitalCoinPrice
Price range in 2026: $0.0513 – $0.0636 (as of July 17, 2024)
In 2026, DigitalCoinPrice expects weak fluctuations in the Zilliqa exchange rate. Probably, the forecast is based on the price performance over the past years, during which the quote fluctuated insignificantly. Therefore, the prediction assumes similar price movements as in the forecast for 2025. During the flat trading period, consider opening positions at the range boundaries, where the lowest price is at $0.0513 and the highest – at $0.0636.
| Month | Minimum Price, $ | Average Price, $ | Maximum Price, $ |
|---|---|---|---|
| January | 0.0518 | 0.0563 | 0.0617 |
| February | 0.0517 | 0.0598 | 0.0609 |
| March | 0.0518 | 0.0536 | 0.0636 |
| April | 0.0513 | 0.0527 | 0.0587 |
| May | 0.0516 | 0.0521 | 0.0578 |
| June | 0.0519 | 0.0531 | 0.0548 |
| July | 0.0516 | 0.0545 | 0.0550 |
| August | 0.0516 | 0.0552 | 0.0565 |
| September | 0.0517 | 0.0546 | 0.0588 |
| October | 0.0518 | 0.0599 | 0.0627 |
| November | 0.0518 | 0.0586 | 0.0627 |
| December | 0.0516 | 0.0557 | 0.0580 |
Zilliqa: Price History
Zilliqa’s financial narrative has a huge growth potential and marked volatility, reflected in its historical prices. This crypto has seen its value swing from highs near $0.2554 to lows of $0.002396, illustrating the high stakes of its market journey. Trading volume spikes hint at crucial moments of investor interest, often aligned with Zilliqa’s developmental milestones or market trends.
Zilliqa is currently priced at $[ZILUSDrate]. Given the rapid changes in the cryptocurrency market, Zilliqa’s growth prospects look very optimistic. ZIL’s future depends on further technological advancements and strategic partnerships, suggesting a cautious but optimistic outlook. Zilliqa has demonstrated resilience to market shocks and retains the potential for notable growth in the evolving digital economy.
Long-Term Zilliqa Predictions 2027–2030
Let us look at what analytical agencies are supposed to be happening with the Zilliqa cryptocurrency in the future.
Changelly
Changelly predicts that the ZIL/USD rate will continue to rise between 2027 and 2030. This corresponds to a long-term uptrend that will outpace similar investments in stock indices. If the cryptocurrency market is innovated and there are no major regulatory challenges for the industry globally, long-term purchases of the token will be profitable. By 2030, the average price is expected to be around $0.183.
| Year | Minimum Price, $ | Average Price, $ | Maximum Price, $ |
|---|---|---|---|
| 2027 | 0.0594 | 0.0613 | 0.0693 |
| 2028 | 0.0850 | 0.0880 | 0.104 |
| 2029 | 0.121 | 0.126 | 0.148 |
| 2030 | 0.178 | 0.183 | 0.213 |
PricePrediction
PricePrediction foresees the positive movement of ZILUSD rate during 2027-2030. It is noted that the asset will be growing annually, and the volatility will remain on low levels during the whole reviewed period. By 2030 Zilliqa will trade between $0.2086 and $0.2510 with average price on $0.2144 level.
| Year | Minimum Price, $ | Average Price, $ | Maximum Price, $ |
|---|---|---|---|
| 2027 | 0.0696 | 0.0720 | 0.0823 |
| 2028 | 0.0980 | 0.1016 | 0.1224 |
| 2029 | 0.1411 | 0.1462 | 0.1689 |
| 2030 | 0.2086 | 0.2144 | 0.2510 |
DigitalCoinPrice
According to DigitalCoinPrice, Zilliqa will increase overall between 2027 and 2030. 2027 will start near the $0.068 level. However, there will be no rapid growth this year, and the closing price will be around $0.0685. In 2028, on the contrary, the price is expected to decline to $0.0594 at the end of the period. The lowest price in 2028 is likely to be near $0.0589.
However, in 2029 and 2030, analysts expect a rapid growth up to the $0.1300 area.
| Year | Minimum Price, $ | Average Price, $ | Maximum Price, $ |
|---|---|---|---|
| 2027 | 0.0679 | 0.0790 | 0.0810 |
| 2028 | 0.0679 | 0.0790 | 0.0810 |
| 2029 | 0.0838 | 0.0929 | 0.0958 |
| 2030 | 0.12 | 0.13 | 0.13 |
Factors that Can Affect the Zilliqa Price
As a digital currency analyst, it is essential to recognize the factors affecting Zilliqa’s price, a cryptocurrency known for its sharding technology. Let’s explore these key influences:
- Market Sentiment and Adoption. The general mood in the crypto market and adoption by crucial players can significantly impact Zilliqa’s price. Positive developments tend to boost prices, while negative news can cause declines.
- Technological Developments. Zilliqa’s price is closely tied to advancements in its sharding technology. Enhancements can increase investor confidence, boosting its value.
- Regulatory Environment. Government regulations greatly influence Zilliqa’s market value. Favorable policies can enhance prices, whereas strict rules can lead to decreases.
- Competition. Zilliqa competes in a crowded market. Its standing against rivals, particularly in scalability and speed, affects its price. The emergence of superior technologies can negatively impact its value.
- Economic Factors. Global economic shifts, such as inflation and stock market changes, can indirectly affect Zilliqa’s price. Broader economic trends can influence cryptocurrencies.
- Community and Ecosystem Growth. A robust and growing community, including both developers and users, can lead to increased demand for ZIL, Zilliqa’s native token, potentially driving up its price.
- Liquidity and Exchange Availability. The ease with which Zilliqa can be traded impacts its stability and price. Higher liquidity generally leads to price stability.
- Market Speculation. Speculative trading can lead to rapid price fluctuations in Zilliqa, often independent of its utility or technological advancements.
Conclusion: Is Zilliqa a Good Investment?
When assessing whether Zilliqa is a worthwhile cryptocurrency investment, a more positive yet cautious outlook is preferred.
In terms of technical analysis, the asset is still trading in a long-term downtrend, although this trend has slowed down. The level of $0.0152 is the key support, which the price cannot break through for 1.5 years. Bulls’ interest is definitely concentrated near this level and they are not letting the price go lower. If the price remains above the $0.0152 level, the asset will start to rise. The May high at $0.0253 will be the growth target. Bulls should consolidate the price above this level to reverse the downtrend.
Based on this data, before buying Zilliqa, investors need to see a confirmation of the downtrend reversal by breaking through key resistance levels. In this case, the cryptocurrency will have a good chance of growth with a potential of 150%–200% within two to three years.
Some forecasts suggest trading the asset in the range between $0.0255 and $0.0150. In this case, it will be profitable to open short trades at the upper boundary of the range and long trades at the lower one. Remember to take profits when the price reaches the channel’s boundaries.
Besides, trading can be marked by periods of high volatility, implying sharp growth and equally sharp correction. In such cases, it is important to take profit in parts and let the price grow, closing trades at the previous significant highs.
For traders comfortable with high crypto risk profiles, Zilliqa offers ample profit potential. Still, caution is urged, given the unpredictable swings and competitive landscape. With practical expectations and disciplined investing, Zilliqa could contribute meaningfully to a diversified crypto portfolio.
FAQs on Zilliqa Price Prediction
Zilliqa is a blockchain platform known for pioneering sharding technology, offering high scalability. Its increasing adoption and solid technology base make it a potentially lucrative long-term investment opportunity.
Most experts offer an optimistic forecast for Zilliqa in 2024. It is supposed that the price, which dropped to $0.014 in August, will grow further with the target of $0.0233 by the end of 2024.
The forecasts for 2025 assume growth of ZIL price to $0.0230 at the beginning of the year and reaching $0.0400 at the end of the period. Some projections assume high volatility and the price growth to $0.0733, but one should be cautious about such forecasts.
The long-term Zilliqa coin forecasts for 2030 are different. Most experts predict long-term growth, but the final price diverges. According to Changelly, the currency rate may reach $0.213, while DigitalCoinPrice expects it to grow to $0.13.
No forecast suggests that Zilliqa will rise to $1.0000 in the foreseeable future until 2030. If circumstances are fortunate, investors show interest in this cryptocurrency, and the regulatory authorities are favorable, the highest Zilliqa coin price may reach $0.2510.
Zilliqa is a potentially good long-term investment due to its robust technology base and expanding ecosystem. However, the cryptocurrency faces risks such as a lack of buyer interest, regulatory pressure, and poor integration into apps and the gaming industry.
The Zilliqa blockchain definitely has a future. The token encourages innovations due to its high scalability, eco-friendliness, and useful tools for developers. The platform is in demand among application creators thanks to its infrastructure and community.
Price chart of ZILUSD in real time mode

The content of this article reflects the author’s opinion and does not necessarily reflect the official position of LiteFinance. The material published on this page is provided for informational purposes only and should not be considered as the provision of investment advice for the purposes of Directive 2004/39/EC.
{{value}} ( {{count}} {{title}} )
This post is originally published on LITEFINANCE.