The Wyckoff Method is a technical analysis approach developed by legendary technician Richard Demille Wyckoff in the early 20th century. The method is still used in financial markets, allowing traders and investors to determine entry points and forecast price movement based on market structure analysis. The method’s centerpiece includes such concepts as accumulation and distribution, which reflect the behavior of large market players.
The Wyckoff method helps investors and traders to adapt their strategy to the market situation and contributes to a better understanding of market cycles. This, in turn, allows them to assess market dynamics and build effective trading strategies.
The article covers the following subjects:
Major Takeaways
- The Wyckoff Method is based on three fundamental laws: supply and demand, cause and effect, and effort and result.
- The central concept of the method is the “Composite Man,” which represents the actions of large institutional investors.
- Wyckoff’s market cycle includes four phases: accumulation, markup, distribution, and markdown.
- Market phases are analyzed using technical analysis tools, including assessment of trading volume and price action, along with the relative strength index (RSI).
- The method helps traders identify support and resistance levels and entry points based on market cycles.
- The Wyckoff trading strategy can be applied to the stock market and cryptocurrency trading.
- The Wyckoff analysis includes five additional phases for the accumulation and distribution phases.
What is the Wyckoff Method?
The Wyckoff Method is a comprehensive approach to analyzing financial markets developed by Richard Wyckoff in the 1920s. The method focuses on the study of the behavior of large market participants, summarized in the concept of the Composite Man (or Composite Operator). It assists in comprehending how supply and demand are distributed during various phases of the Wyckoff cycle, facilitating forecasts by analyzing volume, price movements, and market trends.
The Wyckoff Method encompasses three fundamental laws, the concept of the market cycle, and a trading strategy based on market phases. Its primary objective is to empower traders with the tools necessary to accurately analyze price trends and identify promising entry points. By leveraging Wyckoff patterns, traders can enhance their comprehension of market trends and make more informed trading decisions.
Why the Wyckoff Strategy Works
Wyckoff’s trading strategy is based on the idea that price performance is largely determined by the actions of institutional investors. These are large market participants with significant capital, which have a major impact on accumulation and distribution phases, creating horizontal trading ranges. These phases allow traders to:
- identify where demand exceeds supply and vice versa;
- analyze volume to capture momentum and prepare for price movements;
- determine key market trends and pivot points.
The Wyckoff strategy is a widely used technical analysis tool that helps traders identify key levels and avoid mistakes related to misreading the market situation.
By analyzing accumulation and distribution phases, traders gain powerful tools for predicting price movements and interpreting market signals. This approach empowers traders to make more informed decisions and mitigate risks, especially in volatile and unstable market conditions.
By leveraging Richard Wyckoff’s concepts, traders gain a more profound understanding of market structure and can analyze the actions of major players, who use their influence to control market sentiment and capitalize on trends.

Wyckoff’s Three Fundamental Laws
The Wyckoff trading method is based on three fundamental laws that are used to build an effective trading strategy. These principles provide traders with essential tools for generating signals for opening trades, securing profits, and assessing likely price movements.
- The law of supply and demand suggests that if demand exceeds supply, the asset’s price rises. If otherwise is true, the price falls. This law is the basis of all market movements.
- The law of cause and effect implies that the phase of accumulation and distribution (cause) determines the strength and duration of the subsequent trend (effect). Analysis of volumes and time of price presence in the range helps to predict the scale of movement.
- The law of effort and result assumes that by comparing trading volume (effort) with price change (result), traders can identify divergences and determine whether the movement is confirmed by the activity of market participants.

Law of Supply and Demand
This law defines how the interaction of supply and demand determines price movements in financial markets. When demand exceeds supply, the price rises because buyers are willing to purchase the asset at higher prices. Conversely, under selling pressure, when supply exceeds demand, the price begins to decline.
To assess the balance between supply and demand, Wyckoff recommended using a combination of volume and price action analysis. Trading volume allows traders to monitor large market participants – the so-called “Composite Man” – and price action to determine the most likely direction of the trend.
The Wyckoff method is a valuable tool that can help traders determine key support and resistance levels, which serve as important benchmarks for opening and closing positions. By understanding the correlation between supply, demand, and trading volume, traders can make more accurate forecasts of market movements.
Law of Cause and Effect
According to this law, every significant market movement has a cause, and it can be analyzed to predict future changes. For instance, the Wyckoff accumulation phase establishes the foundation for subsequent price increases. During this phase, major players—such as institutional investors—acquire assets in an effort to avoid a sudden rise in price. This strategic behavior sets the stage for a bullish trend.
Through the analysis of volume and market structure, traders can get insights into the activity of major market participants. In the accumulation phase, volumes gradually increase, indicating setup for a significant upward move; similarly, the distribution phase often precedes price declines, when large players begin to sell assets in stages, increasing selling pressure.
The law of cause and effect helps examine the present market situation and anticipate how the market trend will evolve. Traders can determine the stage of the market cycle and identify favorable entry points. This skill is especially valuable in volatile market conditions.
Law of Effort and Result
This law delineates the relationship between trading volume (effort) and price movement (result). According to this principle, price movement should be proportional to the trading volume. If trading volume is increasing while the price is not moving in the expected direction, it may signal that the trend is weakening, and a reversal is looming.
For instance, in an uptrend, an increase in trading volume should be accompanied by a sustained price increase. Conversely, if the price remains within a narrow range while the volume increases, it could signal that major market participants are closing their positions, thereby creating a hidden source of selling pressure. Similarly, in a downtrend, if the growth in volume does not result in a price decrease, it may indicate the end of the directional movement. Therefore, a trend reversal can be expected.
Traders leverage this law to assess the discrepancy between effort and result to predict market reversals and determine optimal entry and exit points. This approach enables a more nuanced understanding of market trends and mitigates the risks associated with unforeseen shifts in trend direction.
The Composite Man Concept
“The Composite Man” or “Composite Operator” is a hypothetical, collective entity that is believed to be the primary force behind market movements, representing large institutional investors and traders. The concept was developed by Richard Wyckoff to explain the influence of these large market players on market sentiment and price movements.
According to Wyckoff, the Composite Man performs the following:
- participates in the accumulation and distribution phases by purposefully buying assets at low prices during the accumulation phase and selling at high prices during the distribution phase when prices peak;
- shapes market sentiment by using price action manipulation, such as false breakouts of support or resistance levels, to misdirect retail traders;
- forms key price breakouts, moving from accumulation to markup or from distribution to markdown at times when retail traders outperform institutional investors and vice versa.
Traders using the Composite Man concept gain a deeper understanding of the market logic and behavior of large market players. The concept helps traders to:
- identify key entry and exit points;
- avoid false signals;
- identify hidden patterns behind price movements and trading volume.
According to Wyckoff, the Composite Man concept is an important tool of technical analysis, allowing you to see the market through the eyes of those who actually run it.
Wyckoff’s Market Cycles and Price Patterns
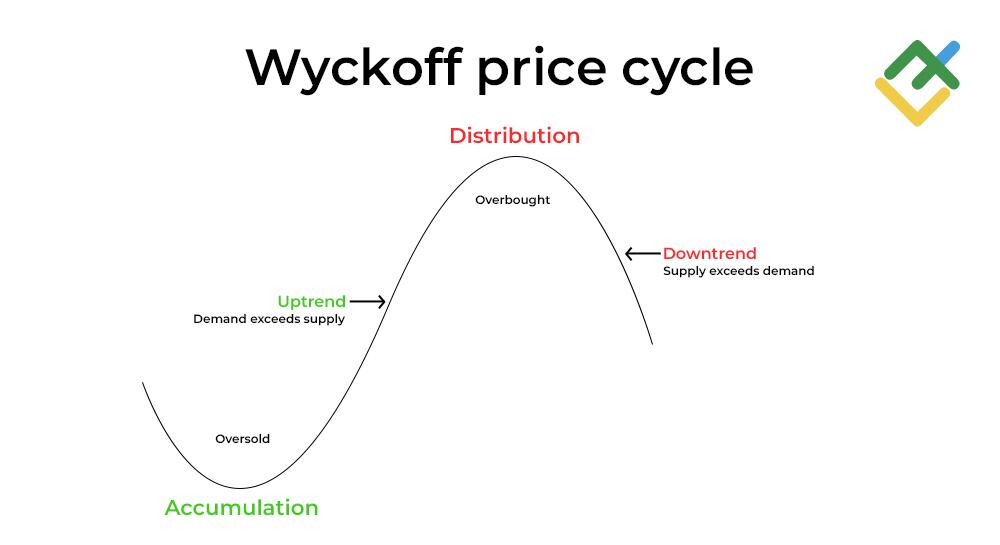
The Wyckoff market cycle includes four key phases, each reflecting the behavior of market participants and the interaction of supply and demand. These phases help traders track the actions of major players and predict price movements.

- Accumulation. During this phase, institutional investors – or the “Composite Man” – begin to purchase assets at undervalued prices. Trading volume gradually increases, but the price remains within a horizontal trading range. This is a signal that the market is gaining strength before shifting to a period of growth.
- Markup. Once the accumulation phase is completed, a strong upward price movement begins. Demand exceeds supply, the market breaks through resistance levels, and trading volume continues to soar. This is the most vibrant phase. As a rule, retail traders often enter the market during the markup stage.
- Distribution. Large players start to lock in profits, selling assets incrementally. The price is moving sideways again, but trading volume increases, pointing to growing selling pressure. False breakouts are often seen to lure buyers into the market before a trend reversal.
- Markdown. When the distribution phase is over, supply exceeds demand, and the price starts to decline, reaching new lows. Trading volume remains high as retail investors sell the asset in panic.
Why are these phases important? According to Wyckoff, these phases allow traders to identify optimal entry and exit points, avoid traps created by big players, adapt strategies to the current market phase, reduce risks, and increase profitability.
Wyckoff’s Accumulation Phase Pattern
The accumulation phase occurs after a prolonged markdown, when large players or so-called smart money start buying assets at favorable prices without causing a sharp rise. This phase forms a wide trading range, setting the stage for a future uptrend.
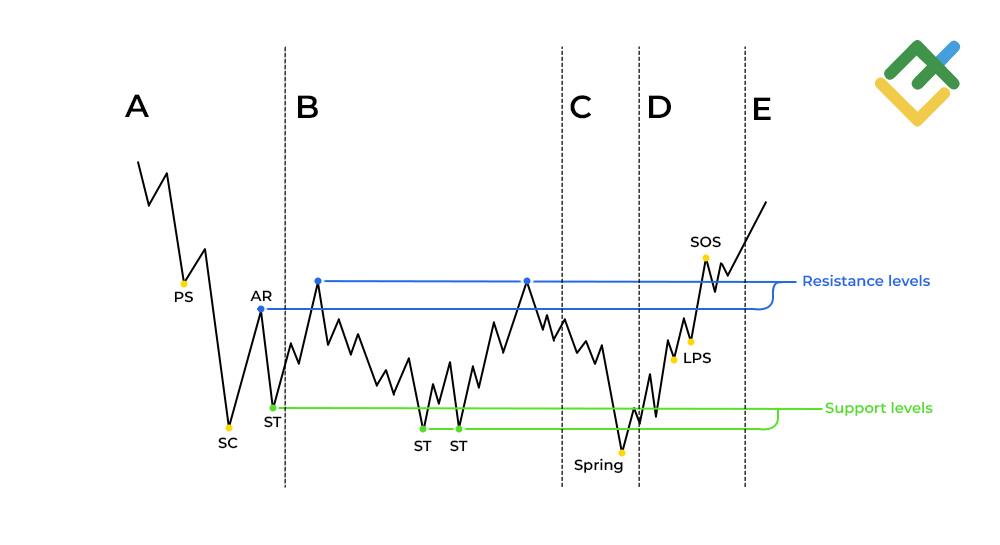
Accumulation is divided into five sub-phases, each of which has characteristic signs and features.
Phase A: End of the Prior Downtrend
The price begins to stabilize after a long downtrend due to a decrease in sellers’ activity, which creates the first conditions for a reversal. The Preliminary Support (PS) appears amid the first purchases at attractive prices.
Then comes the Selling Climax (SC) when the market experiences a powerful downward pressure caused by panic selling. Against this background, trading volume surges.
After sellers are exhausted, buyers enter the market, forming the Automatic Rally (AR). This upward movement shows that the selling pressure has greatly diminished.
The upper point AR and the lower point SC form the primary Trading Range (TR), within which the further accumulation phase will develop.
The Secondary Test (ST) follows, during which the price approaches the SC zone again, demonstrating decreased volume and maintaining its position above the low. This indicates that sellers have exhausted and the first stage of accumulation has been completed.
Phase B: Building a Cause
In Wyckoffian analysis, Phase B is characterized by a horizontal trading range in which institutional investors begin to accumulate positions, “building a cause” for a new uptrend. During this phase, trading volume surges, but the price remains within the established range, creating the illusion of market uncertainty.
The price can test the lower boundary of the range (ST) several times during this phase. These movements mislead retail traders by creating the impression of a possible continuation of the downtrend.
It is important to closely monitor trading volume, as it represents a key indicator of the activity of professionals. False breakouts of support or resistance levels are common techniques by which the Composite Man manipulates market sentiment, forcing retail participants to make hasty decisions.
During this phase, the market may produce a lot of noise, but this appearance hides the purposeful behavior of large participants, forming the basis for future upward movement.
Phase C: The Spring
Phase C is a critical juncture in Wyckoff’s accumulation. This phase is also referred to as “Spring.” Major players test the support level, confirming that they are ready to end the accumulation phase.
During this phase, prices temporarily dip below support levels, creating a false breakout, also known as a Bear Trap. The objective of this phase is to force retail traders to sell, creating a sense of panic and amassing liquidity. This price move enables smart money operators to strategically acquire assets at optimal prices, preceding the market’s subsequent uptrend.
Signs of Phase C are the following:
- a sharp but short-lived breach of the support level;
- growth of volumes during this movement, showing that large players are engaged;
- the price returns to the trading range, signaling a false breakout and a trend reversal.
Phase C marks the end of the period of uncertainty, preparing the market for active growth in Phase D, in which the price settles above the established range.
Phase D: The Effect
It is in Phase D of the Wyckoff Method that the price begins a strong upward movement. At this point, the price breaks through the resistance level and the market shows clear Signs of Strength (SOS).
The key characteristics of this phase are:
- growth of trading volume during upward movements confirms active participation of big players;
- the price consolidates above the resistance level, signaling a shift to bullish sentiment;
- the Last Point Support (LPS) appears, representing pullbacks after resistance breakouts, which provide opportunities to enter the market;
- an upward trend is starting to form, with the price reaching new higher lows and higher highs.
At this stage, it becomes clear that the accumulation is over, and the market has entered a phase of strong growth. Traders receive confirmation of the reversal and can use LPS as entry points with minimal risk.
During Phase D, most traders are starting to notice the upward movement, but the most profitable entry points were left in Phases B and C.
Phase E: Bulls Take Over (Markup)
Phase E marks the period of active growth, when the market finally leaves the trading range formed in the previous phases. This phase is characterized by a robust uptrend, with participation from both professional traders and retail investors and traders.
The key features of Phase E include the following:
- the price is rising to new highs, supported by demand from retail participants;
- trading volume increases, especially during periods of market euphoria;
- a risk of an overbought condition appears, so it is important to monitor price behavior and trading volume near key levels;
- volatility surges, especially near the end of the trend, which may indicate an impending distribution, i.e., transition to the next market cycle.
Although this phase may feature the most significant price movements, the best entry opportunities were in Phases C and D. However, traders can continue to use Phase E to follow the trend and lock in profits partially.
Wyckoff accumulation is a key element of market analysis that allows traders to identify profitable entry points and build a strategy based on the behavior of institutional investors.
Wyckoff’s Markup Phase Pattern
The Wyckoff markup phase is a period of sustained price growth following the end of the accumulation phase. During this phase, demand exceeds supply, fueling a directional and volume-backed upward movement.
At this stage, institutional investors, having completed the accumulation of assets, begin to push the price upwards, attracting more retail participants to the market.
The key features of the markup phase are:
- volume growth accompanies price movement, confirming buying pressure;
- the price reaches new higher highs and higher lows, giving a strong bullish signal;
- breached resistance levels become support areas where traders can open positions in the direction of the trend.
For investors considering entering the market in this phase, it is important to monitor trading volume and momentum strength to recognize signs of trend weakening in time, as it often signals a looming distribution phase.
Wyckoff’s Distribution Phase Pattern
The distribution phase represents another key stage of the Wyckoff market cycle. In this phase, large participants begin to sell assets in stages, locking in profits after an uptrend. This phase is the inverse of the accumulation phase, with the initiative shifting gradually from institutional investors to retail traders.
During the distribution phase, smart money operators sell a substantial volume of assets at elevated prices, thereby averting a precipitous market decline. This is achieved by subtly balancing supply and demand to create the illusion of an ongoing uptrend.
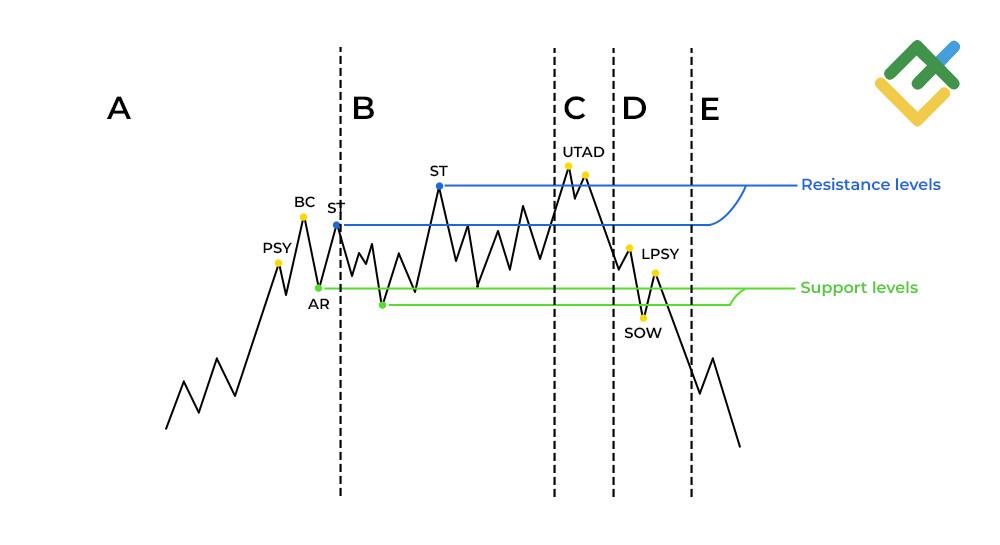
The distribution phase is further divided into four sub-phases, each characterized by a distinct price and volume behavior, indicating a change in market direction.
Phase A: End of the Prior Uptrend
Phase A signifies the end of the uptrend and the beginning of the distribution stage. Following a period of sustained growth, the market experiences a loss of momentum, leading to a sideways price movement, which forms a horizontal trading range.
The key highlights of this phase are:
- Preliminary Supply (PSY). The market is exhibiting initial indications of resistance to growth. Volumes may temporarily decrease, indicating a weakening of bullish momentum. While selling pressure remains subdued, it is becoming more noticeable.
- Buying Climax (BC). The price makes the last upward spurt on emotions and euphoria. Inexperienced traders subject to FOMO (fear of missing out) enter the market. At this point, large market participants start locking in profits, triggering a trend reversal.
- Secondary Test (ST). After the culmination of purchases, the price makes an attempt to test the high once again. At the same time, trading volume is lower, and the upward movement is waning. This implies that the momentum is fading and confirms that the price has already peaked.
Phase A is not always accompanied by a sharp reversal. More often, it marks the beginning of consolidation, in which the first signs of asset allocation from large participants to retail traders can be traced.
Phase B: Building a Cause
Phase B features a horizontal trading range, in which large market participants begin to sell assets partially to prevent the market from dropping sharply. This creates an illusion of an ongoing uptrend, especially for retail traders.
This phase is characterized by the following features:
- Institutional investors are selling assets in small batches, not aiming to cause a market crash; rather, they are exercising caution and gradually closing their positions as less experienced participants continue to purchase the asset.
- Secondary tests (ST) and false breakouts often occur, creating the illusion of continued growth. However, these are actually attempts to attract buyers and create liquidity.
- Upthrust (UT). This is a sharp price spurt above the resistance level, followed by a quick return inside the range. Such a movement is often a sign of manipulation. It creates a bull trap, especially for those late buyers who trade on a breakout.
- Volume Analysis. Despite the apparent calm on the surface, the volumes indicate a build-up of sales—the growth of volumes during pullbacks or periods of heightened activity at false breakouts reveals the actions of the Composite Man.
Phase B is the period when the distribution is not yet obvious to most participants, but it is the time when a downward reversal is impending.
Phase C: The Test
Phase C is the critical phase in which the upper boundary of the trading range is tested. This phase involves the use of manipulative moves, such as false breakouts. This marks the final distribution phase, during which conditions are meticulously crafted to attract the remaining buyers before the decline starts and gains traction.
The key events of this phase are:
- Upthrust After Distribution (UTAD). The price performs a sharp upward impulse beyond the range, followed by a quick return inside. The movement is accompanied by elevated trading volume, signaling that the distribution phase is over.
- Price manipulation. Large players can deliberately push the price above the resistance level to “wrong-foot” uninformed break-out traders and get the necessary liquidity for a final sell-off.
- Sharp increase in volume. Trading volume increases sharply at a false breakout point, indicating aggressive activity of institutional market participants. After that, the price begins to decline rapidly, giving a signal that the markdown phase is beginning.
- Psychological trap. The public perceives the upward movement as confirmation of an uptrend. However, this is a trap that smart money uses to sell additional shares at elevated prices to breakout traders and investors before the markdown begins.
Phase C is the culmination of distribution and a final test of the remaining demand, followed by the transition to the phase of falling prices.
Phase D: The Effect
Phase D is the final stage of distribution, when selling pressure finally prevails over demand. At this point, the market is losing bullish momentum, and a downward trend becomes more and more pronounced.
Phase D has the following key events:
- Last Point of Supply (LPSY). An LPSY is formed near the middle or upper boundary of the range. It represents a swing high where large participants have completed selling. After reaching that point, the price starts to decline gradually.
- Series of LPSYs. The price may form several consecutive LPSYs, looking like short-term upward pullbacks used for the final sell-off of remaining positions. Each new lower high signals weakening demand.
- Sign of Weakness (SOW). This is a breakout of the lower boundary of the trading range, occurring on increased volume. It indicates fading bullish demand and dominance of sellers.
- Reinforced bearish sentiment. At this stage, market participants, who previously believed in the continuation of growth, begin to notice a trend reversal. As a result, volatility increases, and the decline accelerates.
Phase D confirms that the distribution phase is finally over. It signals the transition to the markdown phase when the market enters a sustained downtrend.
Phase E: Bears Take Over (Markdown)
During Phase E, the price exits the trading range. The price breaks through the support level and settles below it, which signals the beginning of a full-fledged markdown phase.
The main characteristics of Phase E are the following:
- Support breakout. The price goes beyond the lower boundary of the range, confirming the completion of the distribution phase. The breakout is usually accompanied by an increase in volumes and acceleration of the decline.
- Settling below the trading range. After the breakout, the price does not return to the previous range, demonstrating the lack of bullish demand and confirming the change of the market phase.
- Asset transition. By this point, most of the positions have already moved from institutional participants to retail traders, who now become vulnerable in a falling market.
- Trend formation. The market enters the markdown phase, a steady decline accompanied by seller dominance, increased panic selling, and subdued demand.
Phase E is the culmination of the distribution phase, marking the beginning of a new market cycle, where bearish sentiment and high risks for non-professional participants prevail.
The distribution phase requires traders to stay focused, as it heralds a change in trend. The use of technical analysis methods such as trading volume, price action, and key levels helps to recognize reversal signals and make informed trading decisions.
Wyckoff’s Markdown Phase Pattern
The markdown phase is a stage of the market cycle characterized by the dominance of sellers and an active decline in prices. In this phase, supply significantly exceeds demand, pushing the price to new lows. Institutional investors who have completed the distribution phase have already sold their assets. These assets have been purchased by retail traders, who are lagging in their response to the changing market context.
Key signs of the markdown phase include:
- decrease in volumes on upward pullbacks, indicating that bulls are weak;
- sharp downward price movements accompanied by an increase in sales volumes;
- the price reaches new support levels, which confirms the strength of the downward impulse.
The phase is often accompanied by panic among retail investors, which only accelerates the price decline. However, for attentive traders, the downtrend provides opportunities for opening short positions. The phase ends with the formation of a new horizontal range, which becomes the basis for the next accumulation phase.
Trading Strategies and Implementation
The Wyckoff Method is a powerful tool for analyzing market cycles and making informed trading decisions. The strategy’s versatility extends to a wide range of assets, including stocks, cryptocurrencies, commodities, and currencies. In practice, the method is based on the phases of accumulation, distribution, and price movement within the market cycle.
In the accumulation phase, traders seek confirmation of major players’ activity by analyzing volume and false breakouts of support levels. Entry into the market is strategically timed to occur after Phase C, when the final test is conducted and the price begins to grow steadily. During this phase, it is crucial to monitor resistance levels and the growth of trading volume.
In the distribution phase, the opposite strategy is employed. Traders capitalize on market peaks by locking in profits, while simultaneously initiating short positions in instances of price declines, such as plunging volumes during price surges or false breakouts of the resistance level.
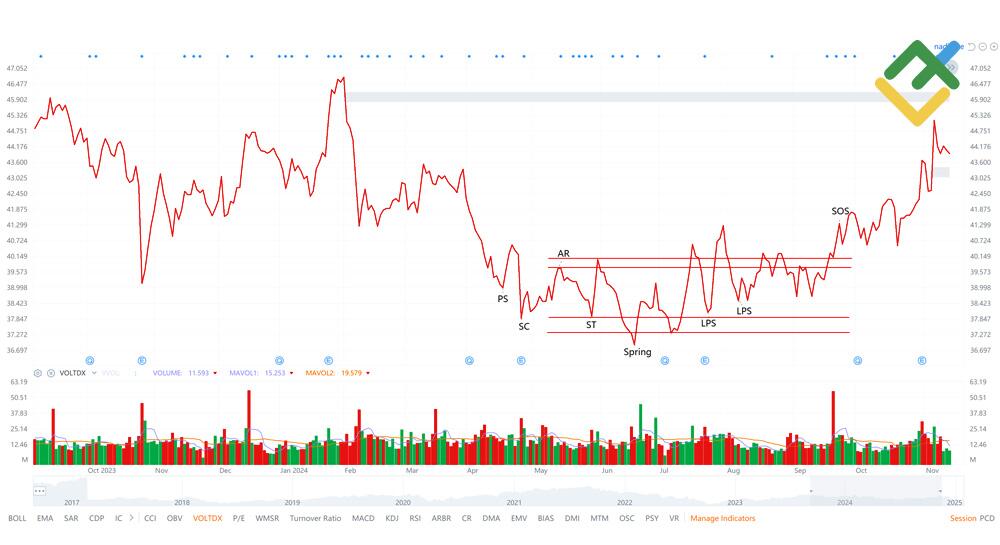
The chart above shows a live trading example. On the COMCAST #SMCSA stock chart in May – September 2024, there was an accumulation phase after a significant downtrend, during which, after reaching the Selling Culmination (SC), trading volumes declined. Price started testing resistance and support levels, formed a false breakout (Spring) on increased volumes, tried to break out of the trading range upwards twice, formed Last Support Levels (LPS), then broke out of the range upwards on elevated volumes showing a Sign of Strength (SOS), and finally formed an uptrend in October 2024.
Applying the Wyckoff method requires careful monitoring of trading volume, support and resistance levels, and price and volume patterns. By following these principles, traders and investors benefit from identifying entry and exit points, while minimizing risk and maximizing profits.
Pros and Cons of the Wyckoff Method
The Wyckoff method is a valuable tool for traders, offering a robust way to analyze the market. However, as with any method, it has its own set of strengths and weaknesses.
Advantages:
- Insight into market structure. The method focuses on the actions of major market participants, helping traders identify accumulation, distribution, markup, and markdown phases.
- Versatility. The method can be applied to all types of assets, including stocks, cryptocurrencies, and commodities.
- Technical analysis. Wyckoff pays attention to trading volume and price levels, which increases the accuracy of forecasts and allows you to find profitable entry points.
- Manipulation analysis. The method helps to identify false breakouts and manipulations carried out by large players.
Disadvantages:
- Difficulty for beginners. It requires experience and in-depth knowledge to understand market phases, Wyckoff’s laws, and volume analysis.
- Ambiguity of interpretation. Different traders may interpret the same market signals differently.
- Dependence on volume. In modern markets, where volume data is distributed across multiple exchanges, the method may be less effective.
This balance makes Wyckoff’s method suitable for professionals, but requires training to apply it successfully.
|
Pros |
Cons |
|
Allows you to predict market trends |
Requires knowledge of the market |
|
Can be applied to different types of assets |
High difficulty for beginners |
|
Relies on technical analysis |
Takes time to master |
Comparing Wyckoff Method with Other Technical Analysis Methods
The Wyckoff Method is unique in that it emphasizes the accumulation and distribution phases with a strong focus on analyzing trading volume and key price levels. Unlike the Dow method, which focuses on identifying the overall trend, dividing it into three phases, the Wyckoff approach provides a more nuanced analysis of market cycles and trading volume.
The Elliott Wave Theory, on the other hand, looks at price movement through a prism of a wave structure, where each wave is broken down into sub-waves, adding more detail to the analysis.
The main difference is that the Wyckoff method emphasizes volume and market phases, while the Dow and Elliott methods offer a macro-analytical approach and analysis through wave structures, respectively. Thus, the Wyckoff Method offers more precise tools for analyzing market trends than the Dow method and less detailed technical pattern analysis than the Elliott Wave Analysis.
Conclusion
The Wyckoff Method is a proven trading and investment tool that helps traders gain a deeper understanding of market cycles and the behavior of key market participants. Its application requires careful study and attention, but the results more than justify the effort.
By focusing on trading volume and price action, as well as market structure, this method becomes versatile for analyzing various financial assets. It allows investors to make informed decisions and improve their investment strategies, making it a valuable tool in any professional trader’s arsenal.
Wyckoff Method in Trading FAQs
The essence of the strategy is to analyze the behavior of large market participants, called “The Composite Man” or “Smart Money,” which is based on the study of accumulation and distribution phases. This helps to determine the future price movement.
Wyckoff is recognized as the originator of the theory of market cycles and technical analysis. His contributions to the development of methods for analyzing the volume and behavior of large market participants remain relevant today.
Wyckoff’s theory has proven to be effective when applied correctly. It provides accurate trading signals, especially when combined with volume and key price level analysis, helping traders make accurate trading decisions.
According to Wyckoff, accumulation can be determined by analyzing trading volume. This phase marks a decline in selling pressure and the emergence of a horizontal price range. As a result, a breakout of support and resistance levels is accompanied by increased trading volumes.
The accumulation phase indicates an upcoming rise in the stock price, while the distribution phase signals a looming decline. These phases help traders to determine the future market movement.

The content of this article reflects the author’s opinion and does not necessarily reflect the official position of LiteFinance broker. The material published on this page is provided for informational purposes only and should not be considered as the provision of investment advice for the purposes of Directive 2014/65/EU.
According to copyright law, this article is considered intellectual property, which includes a prohibition on copying and distributing it without consent.
{{value}} ( {{count}} {{title}} )
This post is originally published on LITEFINANCE.


