
The article covers the following subjects:
Highlights and key points
- Main scenario: consider short positions from corrections below the level of 72.42 with a target of 61.50 – 53.60. A sell signal: if the price holds below 72.42. Stop Loss: above 73.00, Take Profit: 61.50 – 53.60.
- Alternative scenario: breakout and consolidation above the level of 72.42 will allow the asset to continue rising to the levels of 78.05 – 83.75. A buy signal: once the level of 72.42 is broken to the upside. Stop Loss: below 72.00, Take Profit: 78.05 – 83.75.
Main scenario
Consider short positions from corrections below the level of 72.42 with a target of 61.50 – 53.60.
Alternative scenario
Breakout and consolidation above the level of 72.42 will allow the asset to continue rising to the levels of 78.05 – 83.75.
Analysis
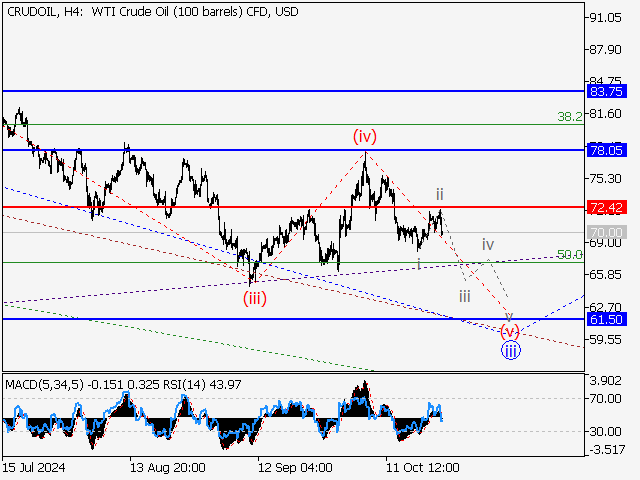
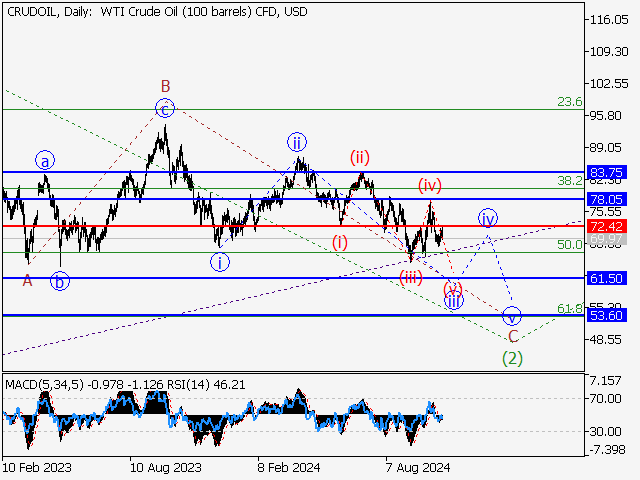
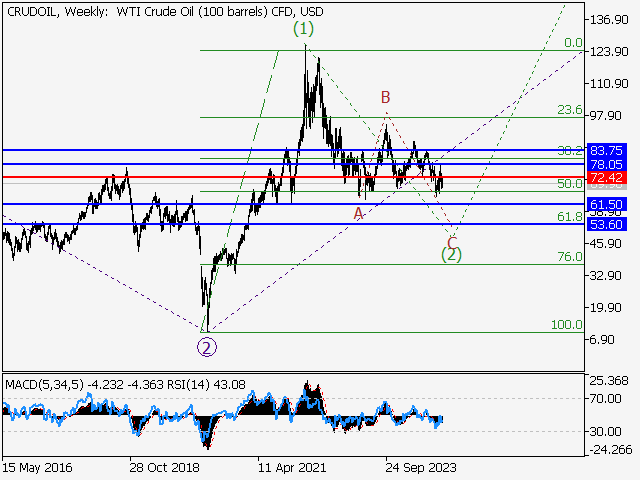
A descending correction appears to continue forming as the second wave of larger degree (2) on the weekly chart, with wave С of (2) developing as its part. Apparently, the first wave of smaller degree i of С is formed, a correction is completed as second wave ii of С, and the third wave iii of C is developing on the daily time frame. On the H4 time frame, a local correction has formed as the fourth wave (iv) of iii, and the fifth wave (v) of iii is unfolding, with wave iii of (v) developing as its part. If the presumption is correct, the WTI will continue to drop to 61.50 – 53.60. The level of 72.42 is critical in this scenario as a breakout will enable the price to continue growing to the levels of 78.05 – 83.75.
Price chart of USCRUDE in real time mode

The content of this article reflects the author’s opinion and does not necessarily reflect the official position of LiteFinance. The material published on this page is provided for informational purposes only and should not be considered as the provision of investment advice for the purposes of Directive 2004/39/EC.
{{value}} ( {{count}} {{title}} )
This post is originally published on LITEFINANCE.