The Inverted Hammer is one of the most common candlestick patterns in technical analysis. It resembles a long upper shadow above the candle’s body, signaling a potential bullish trend reversal.
Understanding the Inverted Hammer candlestick pattern helps traders improve their trading efficiency and gain insight into market psychology. This knowledge enables them to make more informed forex trading decisions considering technical and fundamental analysis.
In this article, we’ll explain the Inverted Hammer candlestick pattern in detail.
The article covers the following subjects:
Key takeaways
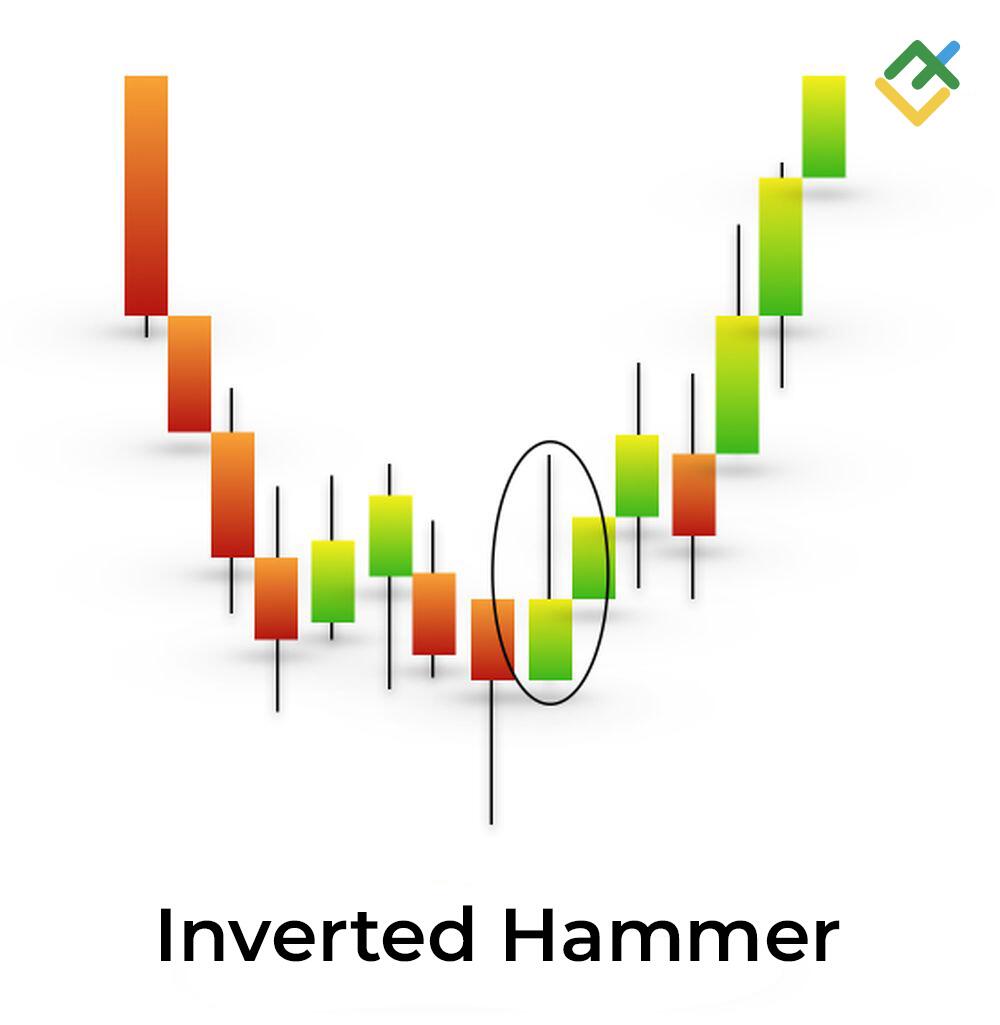
- The Inverted Hammer is a well-known pattern that forms at the end of downtrends and indicates a potential trend reversal. It looks exactly like a candle with a short body near the bottom and a long upper wick.
- This Inverted Hammer structure shows that the price soared drastically, but buyers couldn’t hold the price at the high level.
- The Inverted Hammer occurs on the chart when sellers temporarily lose control of price movement, allowing buyers to push the price significantly above the opening level. However, buyers fail to maintain those high price levels. The strength of the downtrend weakens, potentially leading to consolidation or a bullish price reversal following a bearish trend.
- One advantage of the Inverted Hammer is its simplicity. It allows traders to prepare for potential price reversals in advance. However, its drawback lies in the risk of false signals, especially in low-liquidity markets or amid low trading volumes.
- When trading stocks based on the Inverted Hammer, traders typically open positions after confirming the reversal. Confirmation could come in the form of a bullish candle that signals the continuation of the upward movement. Traders are advised to place buy orders above the Inverted Hammer’s high.
- The Inverted Hammer candlestick pattern in technical analysis can appear on different timeframes. However, it provides the most reliable signals on daily and weekly timeframes. Trading on shorter timeframes may require additional confirmation to filter out market noise.
- One common strategy involving the Inverted Hammer is a trend-following approach combined with confirming the pattern’s signal. Traders can enhance accuracy by combining the pattern with other tools, such as moving averages or support and resistance levels. An additional confirmation could come from analyzing trading volumes to validate the signal’s strength.
- When traders trade using the Inverted Hammer, they usually place a stop-loss order below the pattern’s low. It is also important to consider the asset’s volatility to determine the optimal stop-loss distance.
What is an Inverted Hammer Candlestick?
The Inverted Hammer is one of the key candlestick patterns in technical analysis, signaling a possible trend reversal. This pattern occurs at low price levels after a price decline, suggesting buyers may start opening long positions.
The pattern gets its name because the candle visually resembles an upside-down hammer, with a small body and a long upper shadow. It indicates that buyers managed to counter the bearish sentiment and prevent further price decline despite selling pressure on the market. The long wick shows that the price increased during the session, but bears pushed it back down before the close.
Like many other candlestick patterns, the Inverted Hammer originated in the Japanese rice markets during the 17th-18th centuries. The renowned rice trader Homma Munehisa laid the foundation for this pattern, which was later adopted in financial markets.
Homma understood that both market conditions and public sentiment influenced price fluctuations. Using Japanese candlesticks, he demonstrated the relationship between opening, closing, high, and low prices over a given period. This led to the creation of the Inverted Hammer and other candlestick patterns.
Traders view the Inverted Hammer as a potential buy signal, especially when increasing trading volumes accompany it. Confirming the pattern with additional signals, such as a higher closing price on the next candle, is important to avoid false signals. This pattern is a valuable part of a trader’s toolkit, helping them make more informed decisions based on technical analysis.
Structure of the Inverted Hammer Candlestick Pattern
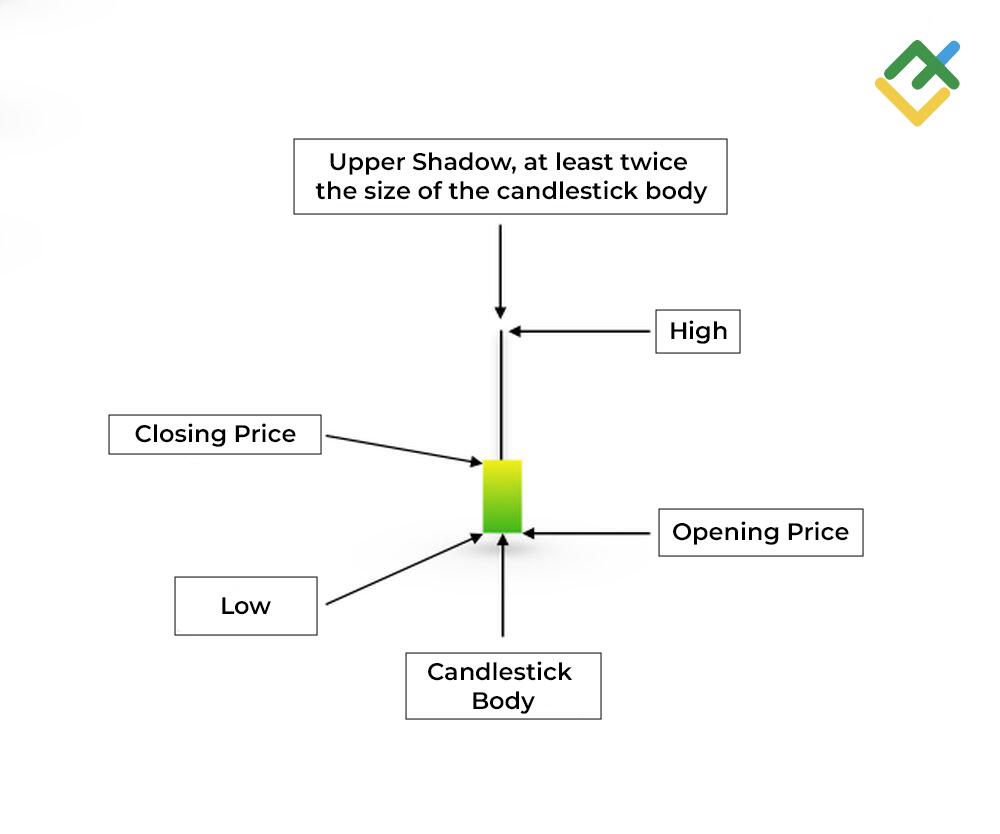
The Inverted Hammer is a single candlestick pattern consisting of four key elements: the candle body, a long upper wick, a nearly absent or short lower wick, and its interaction with support and resistance levels.
- The candle body of the Inverse Hammer is usually short, reflecting a minimal difference between the opening and closing prices.
- The upper shadow is at least twice the length of the body and indicates that buyers tried to push the price significantly higher than the opening level. However, they failed to maintain these gains by the close.
- There is little to no lower shadow, indicating a lack of significant selling pressure.
- This pattern typically occurs near support levels and can signal a potential upward trend reversal. Conversely, if the Inverted Hammer candlestick is formed near resistance, this may indicate a continuation or weakening of the current bull trend.
An increase in trading volume during the formation of an Inverted Hammer signals growing interest in the asset and a possible bullish reversal. Conversely, low volumes suggest uncertainty among traders.
The candle’s color offers additional context. A green Inverted Hammer is typically considered a bullish signal, especially when it appears at the bottom, near a key support level. A reversal to the upside will likely occur.
A red Inverted Hammer may indicate a continuation of the downtrend, but in its final phase. It suggests that bears are weakening while bullish traders are gaining strength.
To use the Inverted Hammer pattern effectively, traders should consider all these factors together to make better-informed decisions.
When Does the Inverted Hammer Candlestick Pattern Occur?
The Inverted Hammer pattern in candlestick analysis signals a possible trend reversal and typically forms in specific market situations.
This pattern usually appears near support levels, indicating a downtrend’s end and an upward movement’s start. At key price levels, the number of buyers often increases as market participants anticipate price increases. During such periods, prices often bounce back while trading volumes rise.
The frequency of the Inverted Hammer formation can vary depending on the asset and its volatility. In markets with high price fluctuations, this pattern occurs more often. For example, currency pairs, cryptocurrencies, and small-cap stocks tend to show sharper and more frequent movements, increasing the chances of spotting an Inverted Hammer.
On shorter timeframes, such as 15-minute or hourly charts, the Inverted Hammer pattern may signal rapid market sentiment shifts but could also produce false signals. Daily and weekly charts provide more reliable signals as they are confirmed by higher trading volumes and more stable trends.
Traders should consider this when making decisions and developing trading strategies.
Signals and Types of Inverted Hammer Candlestick Pattern
The Inverted Hammer stands out in technical analysis due to its role in signaling potential bullish trend reversals. It is also easy to spot on a chart. There are two types of Inverted Hammer patterns—red and green, each with unique characteristics.
What does the Red Inverted Hammer indicate?
The red Inverted Hammer is a candlestick with a long upper shadow and a small body near the bottom, colored red. It usually signals a slowdown in the bearish momentum and the potential strengthening of bullish positions.
This occurs when the opening price is higher than the closing price. This pattern example can be seen on the daily chart of Pfizer Inc. (#PFE).
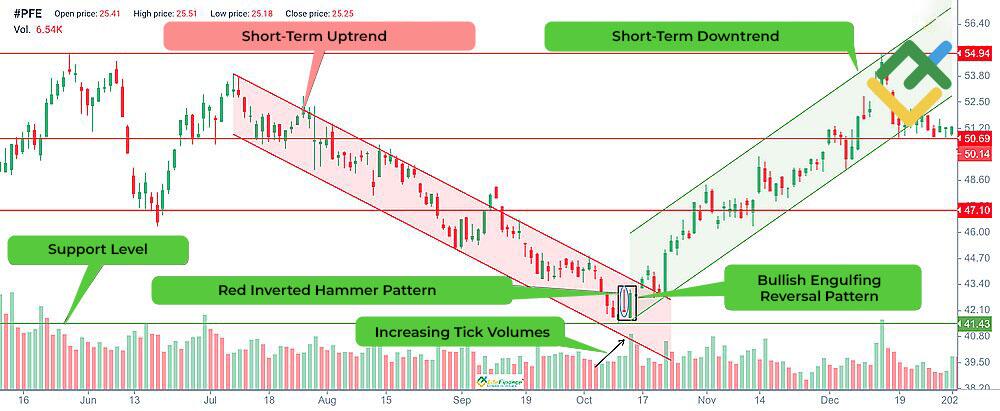
After a prolonged downtrend, the Inverted Hammer formed near the key support level of $41.43. Rising trading volumes and the formation of a long bullish candle confirmed increased buyer activity.
The Inverted Hammer and the second green candle formed the Bullish Engulfing pattern, a strong signal for a trend reversal to the upside.
What does the Green Inverted Hammer tell?
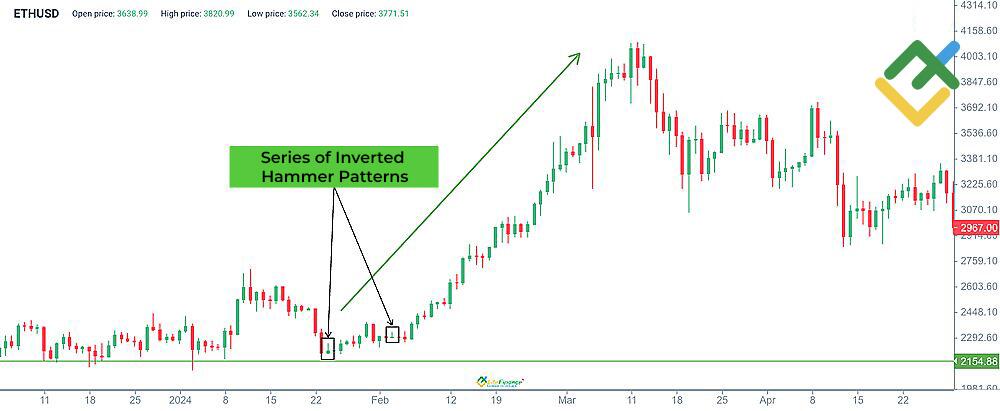
The green Inverted Hammer has a small green body and a long upper wick. This pattern occurs when the closing price is higher than the opening price, indicating potential buyer activity. If the green Inverted Hammer appears after a downtrend, it may suggest a shift in market momentum in favor of the bulls.
The pattern reflects buyers’ growing strength over sellers and hints at a possible trend reversal. An example can be seen on the weekly chart of the Dow Jones Index (DJIA).
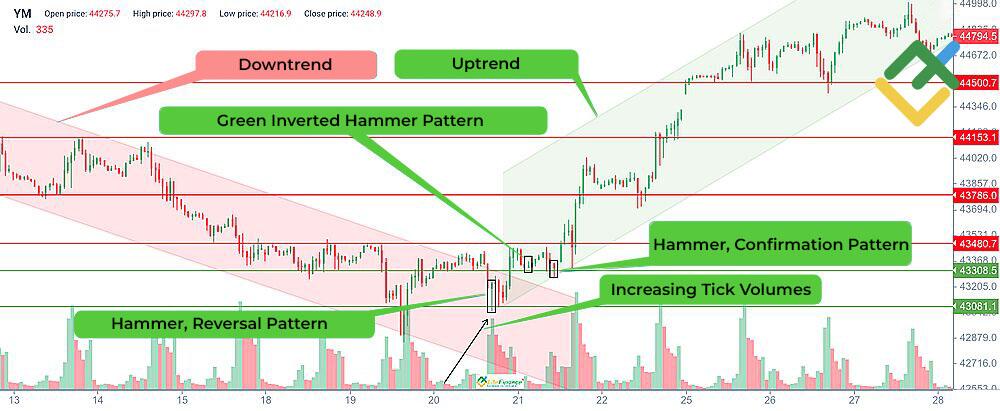
After a prolonged downtrend, the Hammer pattern (a small candle with a short body and a long lower wick) formed amid rising trading volumes. Then, the green Inverted Hammer appeared as a confirmation following the initial Hammer pattern.
The final trend reversal signal came with another Hammer pattern featuring a small body and a long lower shadow.
These three formations collectively signaled a shift in market sentiment and an impending price reversal, allowing traders to open long positions.
Green vs Red Inverted Hammer
The color of the Inverted Hammer candle is not a key aspect in market analysis. Both green and red variations indicate potential trend reversal points. However, the green Inverted Hammer signals a stronger bullish sentiment, while the red Inverted Hammer warns that the trend change requires confirmation from additional buy signals.
To successfully use either the red or green Inverted Hammer in trading, traders must closely monitor complementary indicators and the broader market conditions.
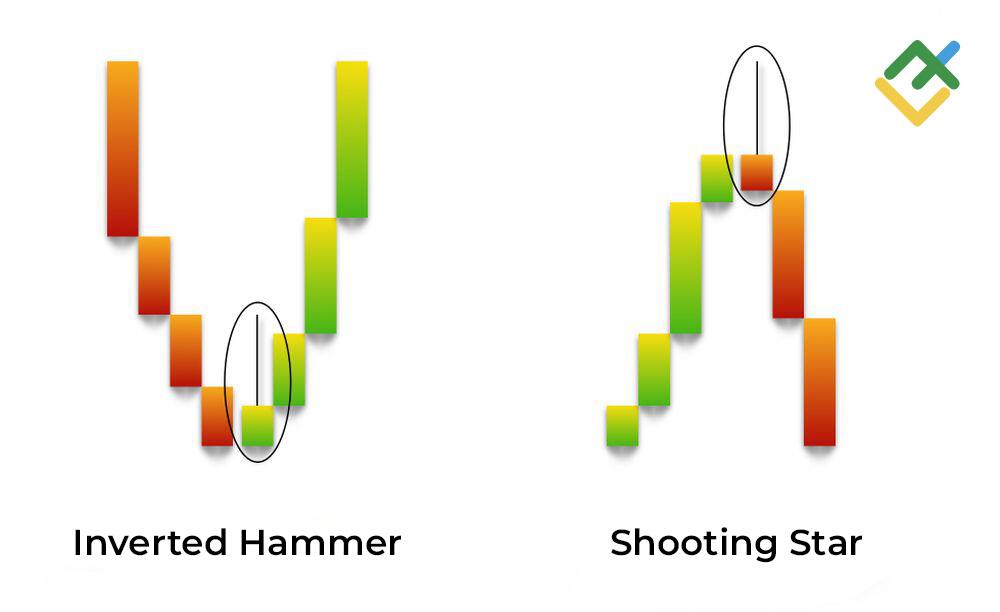
Differences between Shooting Star and Inverted Hammer
The Shooting Star and the Inverted Hammer are unique candlestick patterns, although they may look similar at first glance. Both patterns have a long upper wick and a small body, which can confuse beginner traders.
Let’s start with the Shooting Star. This pattern forms at the peak of an uptrend and signals weakening buyer momentum.
The long upper shadow indicates buyers tried to push the price higher but failed to sustain it at new highs. As a result, the Shooting Star suggests a potential trend reversal to the downside. When confirmed, traders usually open short positions. Confirmation of the Shooting Star can come from other candlestick or chart patterns, such as Hanging Man, Bearish Engulfing, and Bearish Flag.
Conversely, the Inverted Hammer candlestick appears during a downtrend. Its long upper wick reflects buyers’ attempts to push the price upward. This shows that buyers are willing to enter the market and potentially reverse the downtrend into an uptrend. Therefore, the Inverted Hammer serves as a buy signal. Additional confirmation of the pattern can come from Piercing Line, Hammer, Bullish Flag, and others. A gap up between the Inverted Hammer and the next bullish candle further confirms the reversal signal.
In summary, despite their similar appearance, the Shooting Star and the Inverted Hammer serve different purposes—one is a bearish reversal pattern, while the other signals a potential bullish reversal.
Using the Hammer Pattern: Trading and Analysis
Candlestick patterns have long proven to be a reliable and effective way to achieve profits in the financial market.
The Inverted Hammer is one of these patterns. In this guide, we will go through the step-by-step process of using it, from identifying and confirming the pattern to analyzing the trade results.
Step 1: Identifying and Confirming the Pattern
The Inverted Hammer pattern occurs when we see a candle with a small body and a long upper shadow on the chart. This candle has almost no lower shadow, or it is very small. It may indicate a potential trend reversal.
For confirmation, look for the following signals:
- The candle should appear during a downtrend.
- The next candle should show price growth, confirming the trend reversal.
Step 2: Determining the Entry Point
Once the bullish confirmation candle forms, consider long positions:
- Set a buy limit order slightly above the high of the Inverted Hammer candle.
- Ensure trading volume is high, which supports the strength of the signal.
- If you identify the signal later, you can enter a long position at market price after analyzing the situation.
Step 3: Determining the Exit Point
- Set a stop-loss slightly below the low of the Inverted Hammer.
- Use a trailing stop to lock in some profits as the price rises while minimizing potential profit loss.
Step 4: Monitoring the Trade
Continuously monitor the market and adjust your trading strategy as needed.
- Pay attention to trading volume and overall market conditions.
- Be prepared to close the trade if market conditions change significantly.
Step 5: Analyzing the Results
After closing the trade, conduct a detailed review.
- Evaluate the profitability of the trade against initial expectations.
- Analyze how strategic adjustments could have impacted the outcome.
When used correctly, the Inverted Hammer can be a valuable tool for successful trading, especially when combined with other patterns and technical indicators.
Let’s consider an example of trading XAU/USD using the Inverted Hammer candlestick pattern on a 30-minute timeframe:
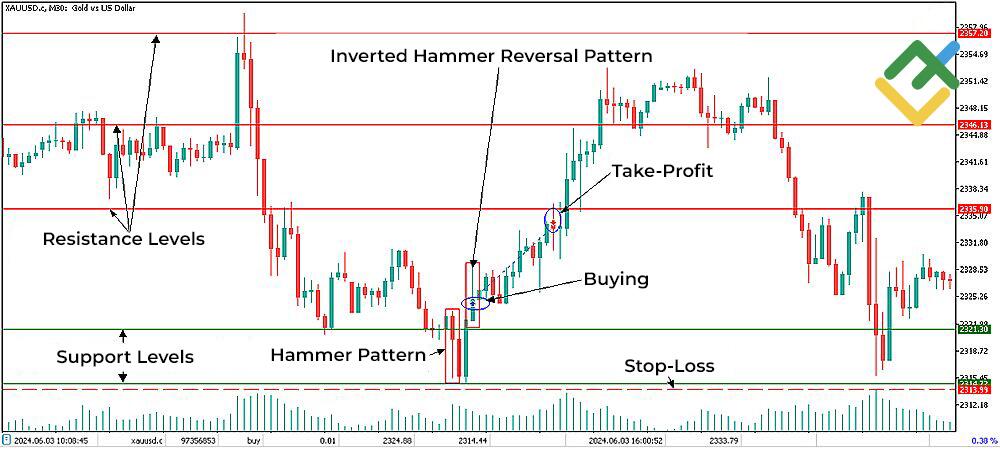
At the end of the price decline, the Hammer candlestick formed at 2,321.30. After a small additional drop to 2,314.77, the price started recovering rapidly, forming a large green candle.
The Inverted Hammer pattern appeared on the candlestick chart to confirm the bullish Hammer. A long position was opened one minute before the candle closed since the quotes held steadily at that level.
The stop-loss was placed below the low of the Hammer pattern to account for a possible price return to 2,314.77. Potential targets based on the pattern were 2,335.90, 2,346.13, and 2,357.20.
The asset reached the first target at the 2335.90 resistance level, and the position was closed with a good profit.
Start trading right now
Inverted Hammer Candlestick: Pros and Cons
Like any other technical analysis tool, the Inverted Hammer has its advantages and disadvantages that traders should consider.
Advantages of the Inverted Hammer Candlestick Pattern
- Trend Reversal Indicator: The Inverted Hammer is seen as a bullish reversal pattern. It is instrumental in identifying market entry points.
- Simplicity of Interpretation: This pattern is easily recognizable on candlestick charts due to its distinctive shape, making it simple to use.
- Market Sentiment Analysis: The Inverted Hammer demonstrates that bulls have managed to take control of the market.
- Use with Other Indicators: The pattern provides more reliable signals when combined with other technical tools.
Disadvantages of the Inverted Hammer Candlestick Pattern
- Low Reliability: The Inverted Hammer alone may not be the most reliable indicator since it requires confirmation through other candlestick patterns or technical indicators.
- Dependence on Market Conditions: The effectiveness of this pattern heavily depends on the market environment and the current trend.
- Risk of False Signals: The pattern often appears in volatile markets and may generate false signals, posing a risk of premature market entries.
Conclusion
The best results are achieved when the Inverted Hammer is used with other technical analysis tools, such as support and resistance levels, trading volumes, and other candlestick patterns. It is also important to consider fundamental factors affecting the overall market.
Thus, the effectiveness and significance of the Inverted Hammer candle lie in its integration into a trading strategy and risk management. Understanding fundamental market processes will help traders identify optimal entry points.
Remember that before investing, it’s important to understand the risk of losing your money and carefully assess whether you can afford to take the high risk involved. You can practice trading with the Inverted Hammer pattern using LiteFinance’s free demo account.
Get access to a demo account on an easy-to-use Forex platform without registration
Inverted Hammer Pattern FAQs
The Inverted Hammer is a candlestick pattern often found at the end of a downtrend, indicating a potential upward market reversal. It is characterized by a small body and a long upper shadow.
The bullish Inverted Hammer appears at the end of a downtrend and may signal a potential upward reversal. Its long upper shadow reflects a surge in buying activity in the market, suggesting a price increase is expected.
The pattern can warn traders that selling pressure caused by bears is weakening, and a trend reversal may occur. Experienced traders pay attention to this signal and other confirming factors, such as increased trading volumes, to open long positions.
The red Inverted Hammer indicates that the closing price is lower than the opening price. This could signal a temporary buyer weakness. However, a trend reversal is still possible, and confirmation from additional technical tools is needed.
The green candle highlights the bullish nature of the pattern. This indicates that buyers took control during this period, driving the market upward.
The Inverted Hammer pattern forms at the end of a downtrend, and often signals increased buying activity. The long upper shadow shows that bulls tried to push the price higher, but the candle closed near its low. This can indicate a potential upward trend reversal.
To trade the Inverted Hammer effectively, traders should wait for confirmation by seeing the next candle close above the hammer’s body. This confirmation serves as a signal to open a long position.
After the Inverted Hammer forms, uncertainty often sets in, leading to a period of price consolidation. During this time, traders closely watch for additional signals to anticipate the next market move.
The content of this article reflects the author’s opinion and does not necessarily reflect the official position of LiteFinance broker. The material published on this page is provided for informational purposes only and should not be considered as the provision of investment advice for the purposes of Directive 2014/65/EU.
According to copyright law, this article is considered intellectual property, which includes a prohibition on copying and distributing it without consent.
{{value}} ( {{count}} {{title}} )
This post is originally published on LITEFINANCE.