
Order blocks in trading refer to specific price areas where large market participants, such as institutional traders, place significant buy or sell orders. Clusters of such orders can impact price movement, liquidity, and market sentiment. On the chart, such an area resembles a chart pattern consisting of several candlesticks, whereas subsequent ones engulf earlier candlesticks. As a rule, order blocks point to a looming trend reversal.
This article provides a comprehensive overview of order blocks and their practical applications in chart analysis and trading strategies.
The article covers the following subjects:
Major Takeaways
| Main Thesis | Insights and Key Points |
|---|---|
| Definition: | Order blocks in Forex are specific areas where institutional traders place significant buy or sell orders. |
| How does it work? | Order blocks allow institutional traders to split large orders, preventing drastic price changes in Forex. |
| How to identify: | To spot an order block, look for an Engulfing pattern and observe the price’s behavior relative to this range. |
| Features: | Profitable order blocks often indicate trend reversals, with clear support and resistance levels in Forex. |
| Why order blocks form? | Order blocks form to allow institutional traders to execute large orders without significantly affecting price. |
| Examples | A strategy involves spotting downtrends, identifying bullish candlesticks, and observing price movements. |
| Best order blocks indicators: | The article mentions support, resistance, and engulfing patterns as key indicators of order blocks in Forex. |
| Pros and cons: | Using order blocks provides insights into institutional trading patterns, but requires practice to interpret |
What is Order Block in Forex
Order blocks are supply and demand zones where large market participants place large orders. Since a large volume order can cause a sharp price change, it is divided into smaller order blocks, which are executed as the liquidity of counter orders accumulates. This strategy allows institutional traders, such as central banks and other financial institutions, to fully fill a large order without significantly affecting the price.
In the chart, the order block looks like a range in which the price reverses under the pressure of institutional investors, then returns to the zone, and finally exits it, changing its original direction.
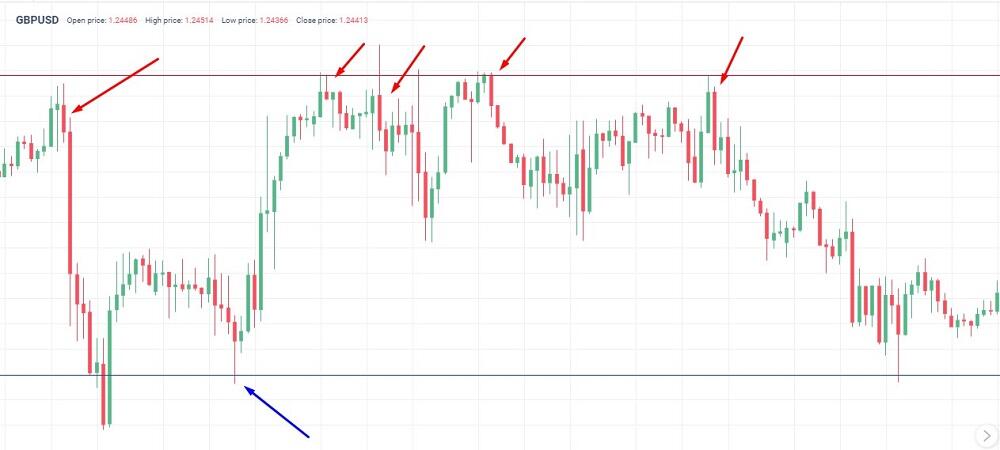
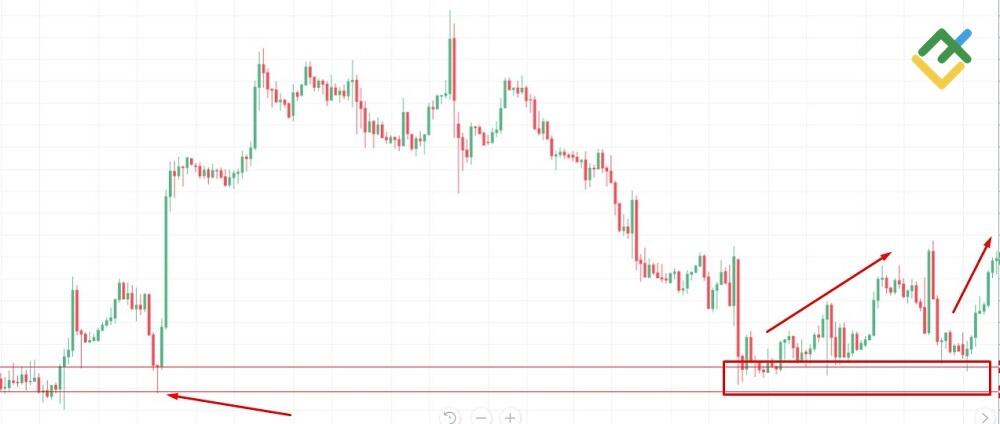
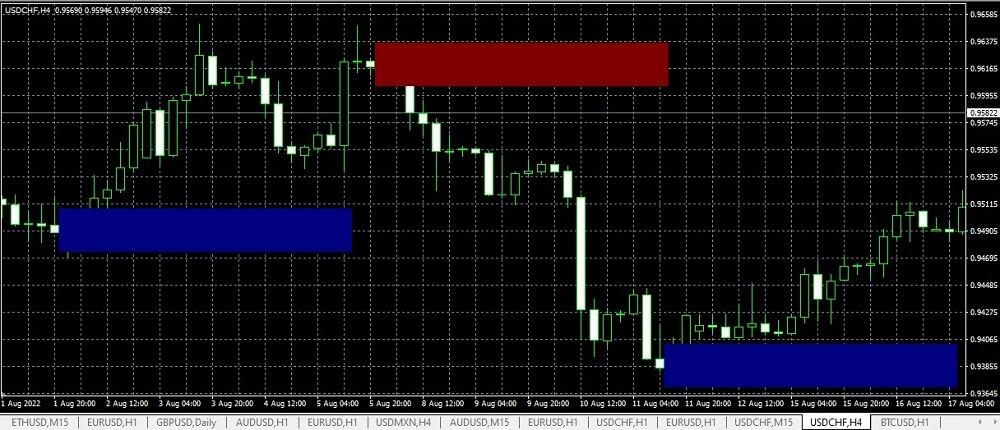
Order block ranges are clearly visible on a zoomed-out scale. The blue and red lines are the support and resistance levels, respectively. At the resistance level, there is an accumulation of liquidity, which is absorbed by the orders of large traders to sell. Under the buying pressure, the price goes up, reaches the level where the orders for the sale of market makers are located and reverses. Candlesticks with such a cluster of orders are marked with red arrows.
It is the same with bullish order blocks. The price is trying to break out the support, but the triggering of buy orders placed at the support level by large traders leads to a price reversal upwards. Then the price again tries to get to the support level (blue arrow), but market makers’ buy orders are triggered here.
Types of Order Blocks
One large order without sufficient counter trade volume can change the structure of the market and lead to a gap. But if it is broken into small and manageable blocks, for example, set in equal volumes every 10 minutes, the market structure will change slowly.
In the M15 timeframe, you will see several candlesticks in a row going up or down. But in the H1 or H4 timeframes, this will be one large candlestick formed by order blocks. Therefore, order blocks are also considered as a pattern.
Order blocks in trading are formed at the extreme points of the trend and at the beginning of the price movement. They can appear in different forms, but their price pattern has a common feature. Order blocks in Forex are:
Bullish Order Blocks
Bullish order blocks occur in a bear trend, after which the price rises.
A bullish block of orders is defined by the last down (bearish) close candlestick followed by an up (bullish) close candlestick that goes above the previous bearish candle’s high. In terms of chart analysis, this is the Engulfing pattern.
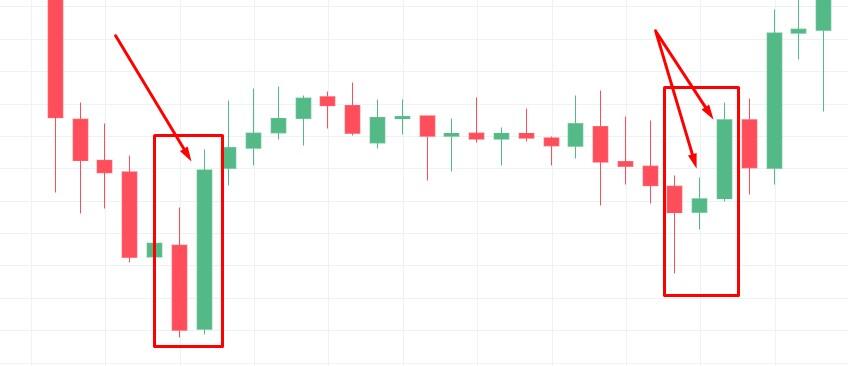
In the first case, the bullish engulfing candlestick, which consists of buy blocks, completely overlaps the previous bearish candlestick. In the second case, absorption does not occur immediately. At first, the bearish candlestick tries to return to the support level, but the volume of sell orders is absorbed by a number of blocks of buy orders. Their execution leads to the appearance of two bullish candlesticks. Sellers continue to place orders, and the price rolls back down again. And again, buy orders absorb this volume, and a new uptrend begins.
Bearish Order Blocks
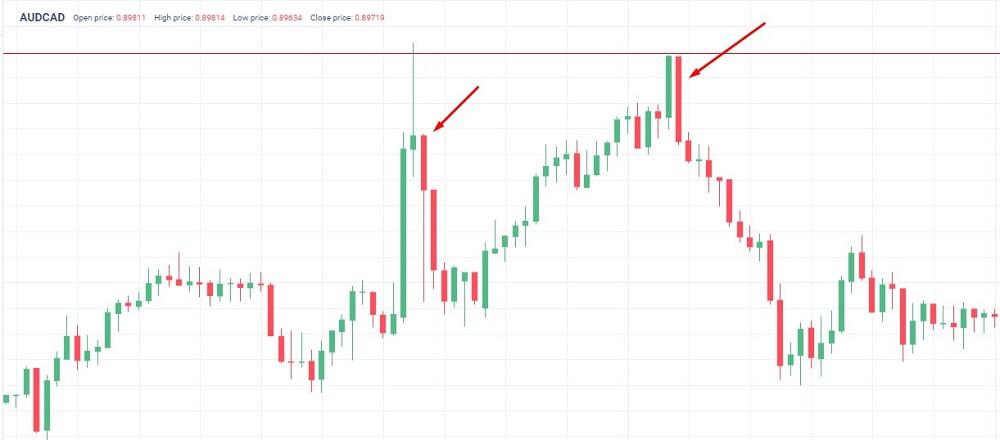
Bearish order blocks occur in a bullish trend, following which the price turns down.
A bearish order block is a mirror situation. Buyers push the price up, but at a certain level, they meet with the corresponding order blocks of the sellers. Demand is satisfied, and a large shadow appears on the candle with bearish order blocks; the price returns to the opening level. The next part of the order blocks leads to a price move down. But buyers have enough liquidity, so the red candle has a shadow down.
Retail buyers are not yet aware of sell orders against them from an institutional seller. The price reaches a comfortable level to buy, where buyers again face bearish order blocks.
Breaker Block
A breaker order block in chart analysis refers to a pattern that emerges following a breakout of a zone that has previously accumulated significant orders from institutional traders. In a standard order block, this zone offers a support or resistance level, where price movement decelerates or reverses. If the price breaks through this zone from above, it indicates a shift in balance, in this case to the sellers’ side. Following the breakout, the price often retraces back to this zone. This retest creates a breaker order block.
The following is a guide on how to identify order blocks in trading.
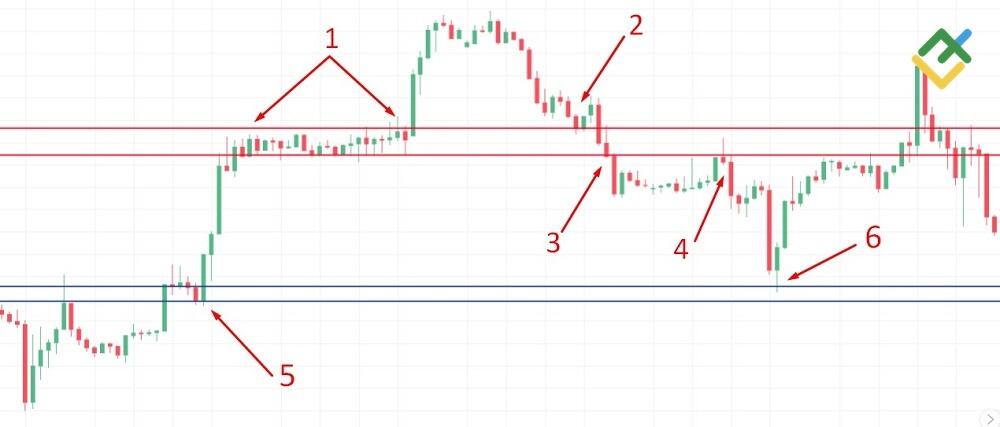
On the chart, the price was trading sideways (1), pointing to the accumulation of orders and an equal balance of market forces. After that, the price increased, reversed, and tested the key level (2). If the price rebounded from that key level, it would suggest that there was a bearish order block. However, the price broke through this area at (3) and then tested it again at point (4). This retest created a breaker order block, and a bearish resistance level was formed. Therefore, the price then declined, reaching the support level (6) of the bearish order block (5).
This pattern can be used to open short positions at point 4 and long positions at point 6. The targets are located in the order blocks acting as support and resistance levels.
Rejection Block
A rejection block is a rare pattern that emerges when the market exhibits no clear trend and faces high volatility. The block is also regarded as a resistance or support zone. The range of the order block is determined by the long shadow. For instance, when the lower shadow indicates that bears have failed to outperform bulls in the market, creating a rejection block. The price reverts to this range after some time. A subsequent upward movement from this range could create a lucrative opportunity to open a trade.
The following example illustrates a rejection block order in trading.
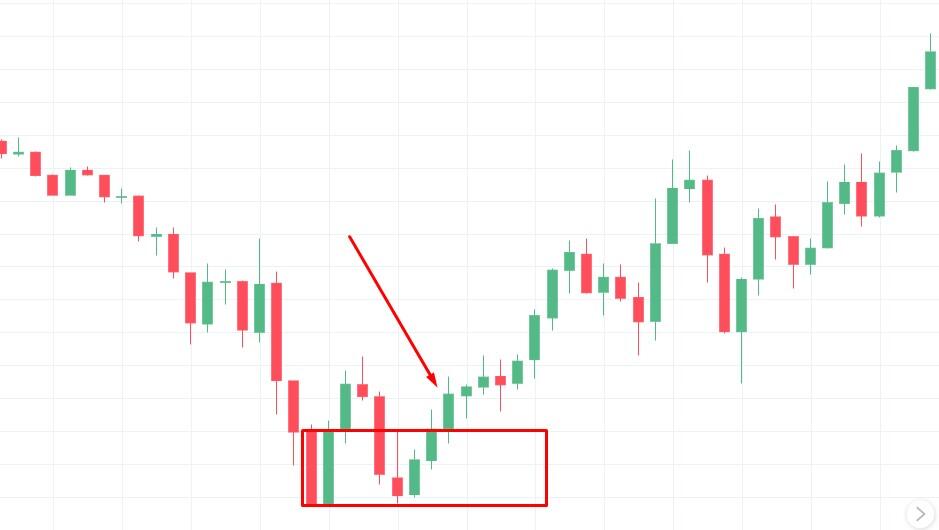
A candlestick with almost no body and a long downward shadow, also known as a Doji candlestick, is formed on the chart. The shadow coincides with the previous narrow price range, outlining the order block’s range. As a result, the price tested this range, rebounding from it several times.
Vacuum Block
A vacuum order block represents a gap, which forms after a sharp impulse triggered by a significant event. During such a rapid price movement, institutional investors can “exhaust” quickly, leaving behind a lack of liquidity.
Features of a vacuum order block:
- Lack of liquidity. Short-term liquidity is lost due to a sharp price movement. There are virtually no trades in this specific price range. As a result, a gap is formed on the chart.
- Formation of a strong level. After the gap emerges, the price tends to return to this range. The “vacuum” is filled, but then the price rebounds from a strong level and continues to trade according to the prevailing trend. This rebound is a signal to open a trade.
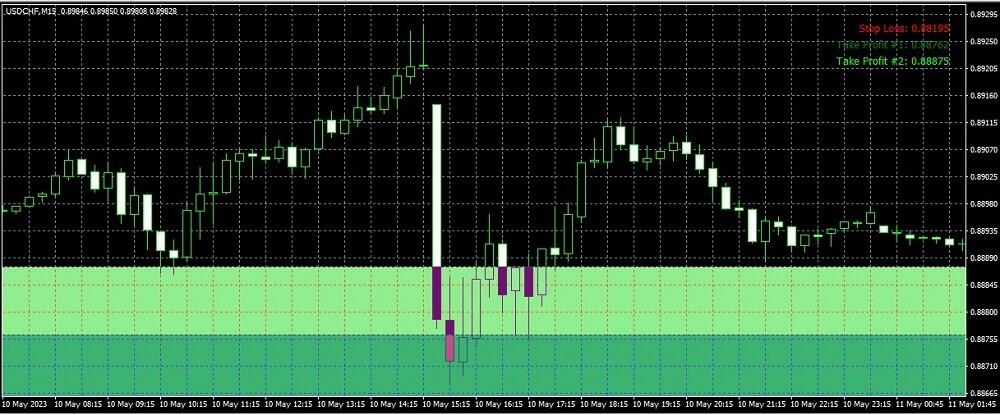
The chart shows a vacuum block.
On the chart, the price formed a support zone and a gap above this zone. The price rose so rapidly that there were no orders in this specific range. As a rule, a gap generates a strong signal that the price will continue to move in the direction of the gap. However, when it comes to a vacuum order block, this is not the case.
The nature of the gap formation is different. It is more random, and liquidity tends to fill it. In our example, the price was trying to touch the zone. If the order block offers a support level, as shown in the screenshot above, you can open long positions once the price rebounds from it.
How Does Order Block Trading Work?
The block order for the price can be interpreted as follows.
1. Support and Resistance Zones
An order block is an area with a significant number of buy or sell orders. This creates strong support or resistance – a channel within which the price moves.
2. Stop Loss Zone
An order block is a zone where traders place stop losses to protect positions from potential losses. When the price reaches this area, many of them can be triggered, leading to a trend reversal.
In shorter timeframes, order blocks look like a consolidation range. This is where a large investor evenly distributes orders that are executed gradually, resulting in a smooth price change. In longer timeframes, an engulfing candle is visible.
How to Identify an Order Block in Forex Trading?
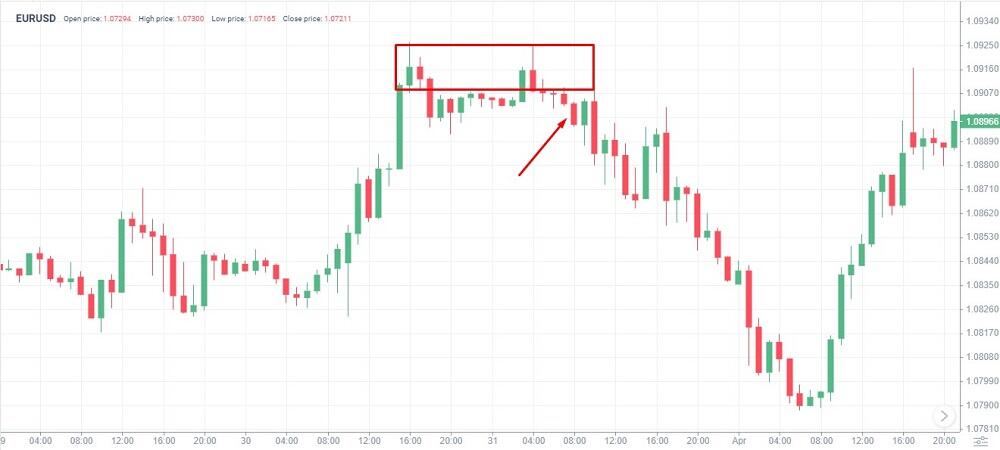
The order block Forex appears before a change in the trend direction, that is, a strong movement up or down. The amount of orders of an institutional trader forms an engulfing candlestick that goes beyond the range of order blocks. Then the correction price returns to the range, and the orders of the institutional trader work out again.
How to Spot Order Blocks?
To identify order blocks, follow three simple steps:
-
Spot an Engulfing pattern;
-
Drag a rectangle to the right from the candlestick preceding the engulfing. This will be the range of order blocks;
-
When the price returns to the range and goes beyond it again, open a position in the direction of the new trend.
The form of order blocks may differ. For example, engulfing could take two candles instead of one. Or when the price returns to the range, it can only touch it.
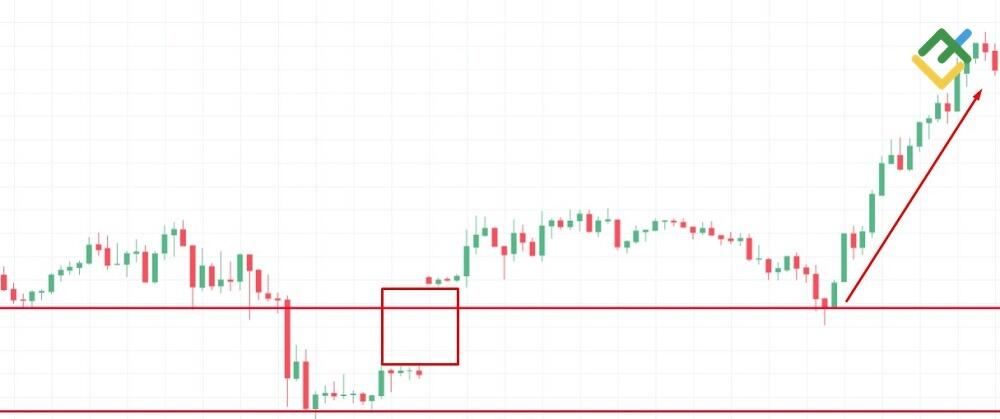
In this example, the green engulfing candle equals the previous red one, but it can be considered a pattern. A rectangle is drawn from the red candle to the right. The price returns to it and touches the support level of the range, but under the pressure of order blocks of a large buyer, it goes up. You can open a position on a candlestick that breaks through the range.
Features of Profitable Order Blocks
There are several criteria to spot order blocks.
Trend
Block orders form in a long-term trend. For example, a large investor watches a depreciating asset for a long time and eventually buys it in parts. The volumes are enough for the price to eventually reverse. But since a large investor enters the market in parts, the market structure shifts slowly, and the trader’s orders are executed at the best price.
Trading Volume
The Forex market should be filled with liquidity due to high trading volumes. The market maker should not show off a large volume so that retail traders do not guess about its presence. If a market maker puts 1/10 of the total buy order amount in the market, but there is no liquidity, then there is simply no one to sell the next 1/10 of the order.
The order block will work if there is a constant flow of counter orders. Sellers must be sure that the price will go down, then the market maker will only have to absorb the sell orders put.
Time Frame
Since the split orders of the market maker are placed sequentially, the formation of an order block is visible only in a longer timeframe, where all order volumes are consolidated into the body of one candlestick.
Block orders have much in common with supply or demand zones. In the chart, they look similar: there is a price stop at a strong support or resistance level, its testing, and subsequent pullback. However, their nature is different.
Why Order Blocks Form?
The price is formed due to the balance between buy and sell orders. For example, a large investor wants to buy 1,000 shares. But in the market, the total volume at the current offer price is only 200 shares. If the buyer-investor puts the entire volume in one order, the sellers will see his interest and immediately raise the price. The value of the shares will go up sharply, and the investor will have to buy the remaining 800 securities at a higher price.
The institutional investor is not interested in the price rise, so they do the following:
-
Split an order of 1000 shares into several parts. For example, for 10 orders of 100 shares each.
-
The first order is filled without causing a large price shift because the market offers 200 shares.
-
New sellers are entering the market. The market is dynamic, so new liquidity will gradually accumulate. The investor puts the next order, which is also executed at the best price without increasing the market volatility.
Order blocks in this example are those very small orders for 100 shares. In the chart, they look like a gradual absorption of sellers’ liquidity, due to which a consolidation zone is formed.
Order Blocks Trading Strategy Examples
The Forex order block trading strategy means one should spot the zone where large investors will set order blocks. The trade is entered when the price goes beyond this supply or demand zone.
Bullish Order Blocks
Bullish order blocks are formed in a downtrend. At some point, institutional investors decide that the asset has already fallen in price enough, and they can start buying it. So that the asset does not rise in price sharply, they put up a number of smaller orders.
The price reverses, rises for a while, then returns to the range of the bullish order block, where market makers start buying the asset again. A trade is entered when the price moves out of the range of order blocks.
Order Block Trading Strategy
The trade is entered according to the following algorithm:
-
Spot a downtrend;
-
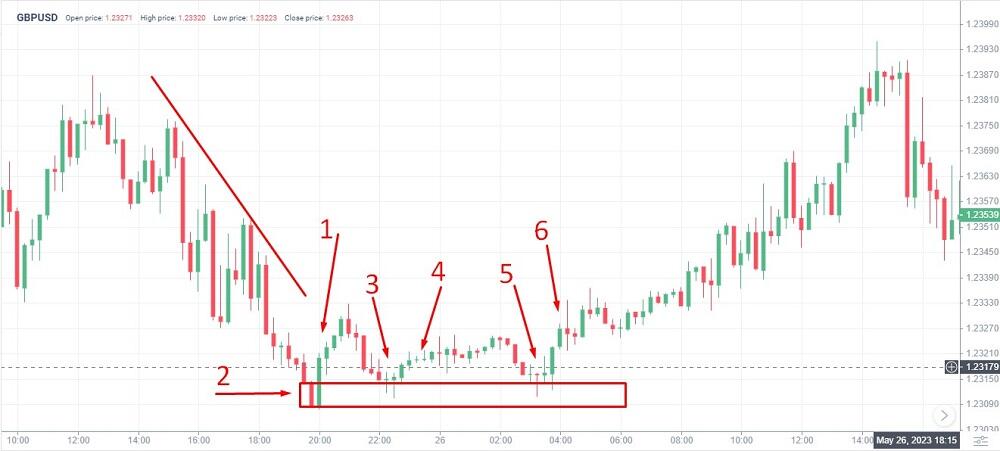
A bullish candlestick appears in a downtrend (1), which absorbs the previous red candle – this is the first sign of the formation of a block order zone;
-
Draw a rectangle to the right from the candlestick (2) – this is the possible order block range;
-
Following candlestick (1), the price moves up a little, but institutional buyers are not willing to buy the asset for the new price. The price returns to the range. This zone contains a cluster of market makers’ orders.
-
The price goes up again under the buying pressure. Again, the large buyers are not willing to buy the asset, rising in price. Section (4) consists of candlesticks with very small bodies. The price returns to the order blocks range again (5);
-
The next breakout of the range up is followed by a candlestick with a large body. The next candlestick (6) is also growing; one can open a position there. Stop loss is just below the candlestick (2).
You should consider a few moments:
-
An order block pattern always means the price should return to the range. But the price should reach the maximum to its middle, or at least, to the level of the previous low. It should not make a new low, as it will indicate that the formed range is a temporary consolidation zone in a downtrend, which is not related to large buyers.
-
The distance between the pivot point and the range return point should be relatively small. Relativity is determined by the timeframe. But if, at this distance, the price changes direction many times, the pattern is considered weak.
-
Not every order block is a signal for a price reversal. But the more times the price returns to the range, the greater the likelihood of a trend reversal. Most often, the price changes direction after one return, but in the example above, you can see that once was not enough.
With a little practice, you will quickly learn to distinguish a consolidation zone followed by a trend continuation from an order block pattern followed by a trend reversal.
Bearish Order Blocks
With a bearish block order, the market behavior is the opposite. Following an uptrend, engulfing is formed in two candlesticks. From the last ascending candlestick, you draw a rectangle to the right that defines the price target price zone. Its width corresponds to the distance between the High and Low prices. Buyers try to hold positions, but their orders are absorbed by the volumes of market makers-sellers. After the price exits the range, you can open a short position.
Best Order Blocks Indicators
Custom indicators of order blocks are technical analysis tools that mark corresponding candlesticks in the chart. They may have an additional information panel, most of which take into account candlestick volumes.
Order Block Indicator
The indicator shows the formation of the last 1-2 order blocks. They are clearly linked to a separate candlestick, on which, according to the indicator, a series of orders from market makers are placed.
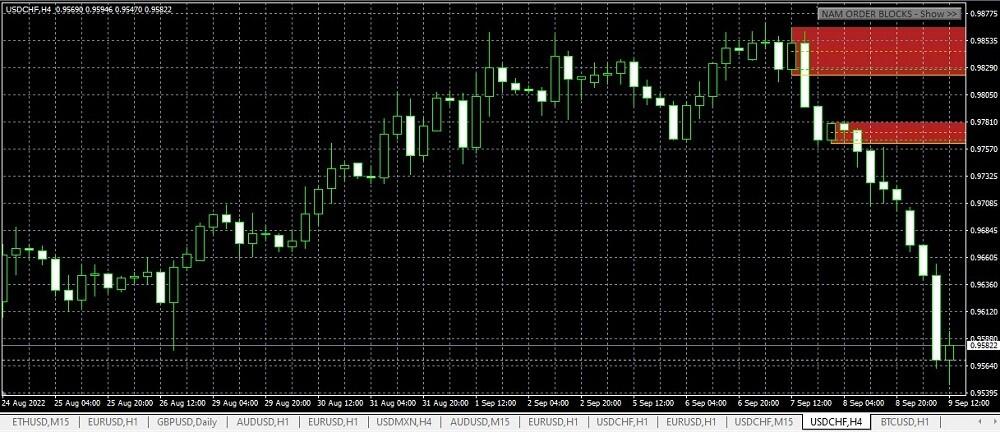
Order Block Indicator has an information panel. In the above screenshot, the panel is hidden so that the order block itself can be seen. In the panel, you can change the display of ranges: add price areas from other timeframes, set zones with specific quotes, and so on.
Order Block Breaker Indicator
This is another variation of the order block indicator, which also shows ranges on the price history. It is not very convenient from a visual point of view, but the transparency of the zones can be specified in the settings. The construction of ranges is rougher without being tied to a key candlestick and a reversal pattern. The Order Block Breaker Indicator can be used to confirm a trend reversal.
Order Block Edge
This indicator for short timeframes shows the formation of potential zones of order blocks from market makers and a trend reversal zone. Order Block Edge is well suited for determining stop levels after a trend reversal.
Accumulation / Distribution
The accumulation/distribution indicator acts as a weighting factor when the price changes. It shows the relationship between changes in trading volumes and prices. If the indicator rises, the market is in the accumulation (purchase) phase; if it falls, the selling pressure increases.
The indicator can be used to spot the zones in which large traders begin to open positions. If there is a divergence between the price direction and the indicator, a price reversal is possible in the near future. This is the basic indicator for trading on the MT4 and MT5 platforms.
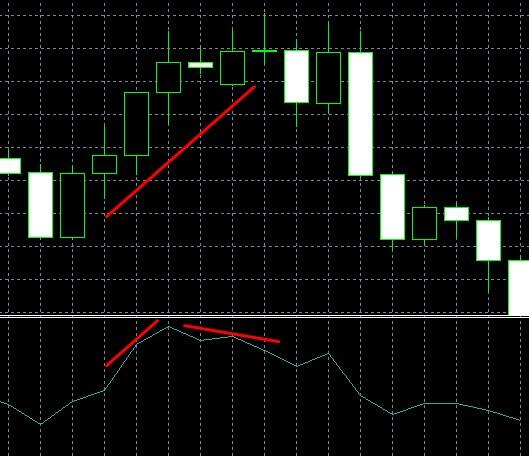
The increase in purchases, confirmed by the indicator, indicates the formation of an accumulation zone. A decrease in the indicator signals large volumes of sell order in the market. Buyers resist for some time, but the price turns down under the sales volumes of market makers.
Pros and Cons of Using Order Blocks in Forex Trading
We can define the following advantages of order block trading:
-
The zones of order blocks help you determine entry and exit points and stop loss levels. You can reap additional profits alongside a trend movement as you enter a trade earlier
-
It is convenient to use pending orders when trading order blocks. An order block may signal a start of a trending movement. You set a pending order on the next 1-2 candlesticks in the direction of the starting trend. A stop loss is set above the local high or beyond the local low.
-
The main trend trading strategies based on order blocks work both intraday and in the medium term;
-
In stock trading, block orders allow you to do without the use of COT reports. These are reports that are published by the Commodity Futures Trading Commission (CFTC) in the United States. They contain information about transactions of all market participants, including transactions of institutional investors.
The main disadvantage of block orders is the difficulty of spotting them. In most sources, examples of block orders are given in drawn charts. In real price charts, the pattern rarely forms clearly, since the influencing fundamental factors are unique for each market situation.
Conclusion
To sum up order block trading, here are a few takeaways:
-
An order block is a specific price area where large market participants, such as institutional traders, have previously placed significant buy or sell orders.
-
Identification algorithm: a reversal pattern Engulfing is formed in the trend price movements. A rectangle is drawn along the width of the previous reversal candlestick. Reversal confirmation is the price return to the range and a subsequent breakout in the direction of a new trend;
- In order blocks forex trading strategies, the pattern is used as a signal confirming a trend reversal. The position is opened in the direction of a new trend at the moment the price exits the range.
The order blocks pattern is a technical analysis tool. It takes into account trading psychology, has a rationale, and therefore works almost always. You should learn to distinguish it visually from false breakouts and other flat or trend continuation patterns.
FAQs order blocks trading
This is the concentration of orders to buy or sell an asset in a certain price range or at a specific price level. An order block appears when an institutional investor cannot place a single large order, as it will trigger a sharp market reaction. Therefore, a successive series of smaller orders is placed.
In the chart, an order block looks like one or several candlesticks of an engulfing pattern that breaks out the order block range. The price should break out the range, return within the range, and rebound, which will mark the beginning of a new trend.
Professionals can use any technical and fundamental analysis tools, including complex mathematical and statistical models, including order blocks.
Each indicator is good in its own way in a particular market situation. You can use any indicators that best suit your forex trading strategy. Order block indicators include Order Block, Order Block Breaker, Order Block Edge, and Accumulation/Distribution.
A block of orders often signals a trend reversal, as the market maker eventually reverses the price in the direction he wants. Therefore, transactions are opened in the direction of the trend on pending orders at the moment the price exits the consolidation zone. Stop loss is set behind the nearest local extremum.

The content of this article reflects the author’s opinion and does not necessarily reflect the official position of LiteFinance broker. The material published on this page is provided for informational purposes only and should not be considered as the provision of investment advice for the purposes of Directive 2014/65/EU.
According to copyright law, this article is considered intellectual property, which includes a prohibition on copying and distributing it without consent.
{{value}} ( {{count}} {{title}} )
This post is originally published on LITEFINANCE.


