This article provides a comprehensive review of the USDZAR currency pair with technical and fundamental analysis, long-term forecasts, expert opinions, as well as market sentiment assessment.
The review will help traders and investors better grasp the pair’s movement, identify potential entry points, and develop an effective trading strategy.
The article covers the following subjects:
Major Takeaways
- The current price of the USDZAR pair is R18.22166 as of 27.03.2025.
- The USDZAR pair reached its all-time high of R19.91 on 01.06.2023. The pair’s all-time low of R1.5715 was recorded on 31.08.2006.
- The USDZAR currency pair represents the ratio of the US dollar to the South African rand.
- The US dollar is the main reserve currency in the world, while the rand is the currency of an emerging economy.
- The USDZAR exchange rate is sensitive to fluctuations in commodity prices, particularly gold and platinum.
- The US Fed’s policy and the South African Reserve Bank’s actions significantly influence the currency pair’s performance.
- The pair’s volatility can increase sharply during economic instability or geopolitical changes.
- The USDZAR pair is a popular asset among short-term traders who rely on news-driven strategies.
- The pair is often used to hedge risks associated with financial operations in African countries.
USDZAR Real-Time Market Status
The USDZAR currency pair is trading at R18.22166 as of 27.03.2025.
When analyzing the USDZAR pair performance, it is essential to monitor key economic and technical indicators such as interest rates, inflation, volatility, and price change over the year. This data allows traders to make more informed decisions and evaluate the risks.
|
Indicator |
Value |
|
South African interest rate |
7.5% |
|
US interest rate |
4.5% |
|
All-time low |
R1.5715 |
|
All-time high |
R19.91 |
|
Price change over the last 12 months |
-4.14% |
USDZAR Price Forecast for 2025 Based on Technical Analysis
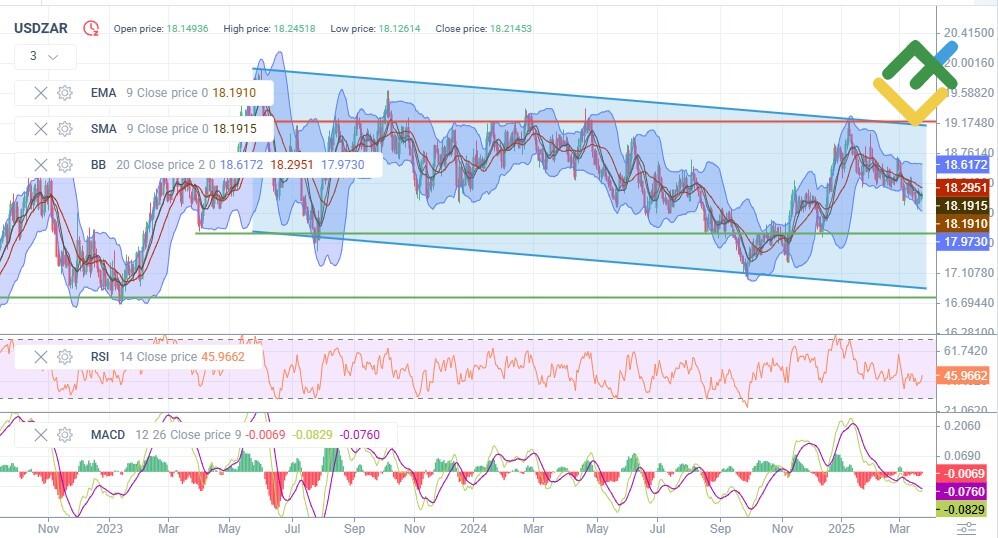
The USDZAR chart shows consolidation within the sideways channel. The EMA and SMA almost coincide, indicating the absence of a pronounced trend. Bollinger bands are narrowing, signaling a decrease in volatility and possible impulse movement in the future. The RSI is at 45.96, showing no clear overbought or oversold condition. The MACD indicator remains in the negative zone, while the histogram is close to zero, suggesting uncertainty in further price movement.
The support level is located at 17.97, and the resistance is around 18.30. The market remains neutral, and the price is trading within a narrow range. The current situation suggests a balance between sellers and buyers.
The table below shows the USDZAR exchange rate projections until the end of 2025.
|
Month |
Minimum, R |
Maximum, R |
|
April |
17.99 |
18.31 |
|
May |
17.81 |
18.41 |
|
June |
17.88 |
18.55 |
|
July |
17.87 |
18.31 |
|
August |
18.02 |
18.4 |
|
September |
18 |
18.62 |
|
October |
18.07 |
18.57 |
|
November |
17.83 |
18.41 |
|
December |
17.93 |
18.59 |
Long-Term Trading Plan for USDZAR for 2025
Based on the technical analysis of the USDZAR pair, a balanced trading plan for 2025 can be formed.
The key support is at 17.75–18.15. If the price returns to these levels and reversal candlestick patterns emerge, one may consider long trades. If the pair breaks through the resistance of 18.43, the asset may climb to 19.00. The RSI is in the neutral zone, signaling a possible consolidation. The MACD line is close to zero, indicating the absence of a strong trend. The EMA and SMA are near the current price, confirming the sideways movement.
Conservative traders should wait for the price to settle above 18.65 to confirm the bullish momentum. A take-profit order can be set at 19.10, and a stop-loss order can be placed below 17.80. Besides, it is advisable to monitor the US and South African macroeconomic indicators.
Analysts’ USDZAR Price Projections for 2025
Forecasting the USDZAR exchange rate for 2025 is of great interest to investors and traders, given the volatility of emerging market currencies. Various analysis platforms offer their own estimates, taking into account macroeconomic indicators, central banks’ policies, and the situation in commodity markets.
LongForecast
Price range: R17.51–R19.44 (as of 23.03.2025).
LongForecast suggests a gradual strengthening of the US dollar towards R19.44 by September. Analysts expect high volatility, especially during summer. Thus, this period can be favorable for short-term trading.
|
Month |
Open, R |
Min–Max, R |
Close, R |
|
April |
18.09 |
17.52–18.58 |
17.97 |
|
May |
17.97 |
17.70–18.24 |
17.97 |
|
June |
17.97 |
17.51–18.05 |
17.78 |
|
July |
17.78 |
17.78–18.58 |
18.31 |
|
August |
18.31 |
18.31–19.08 |
18.8 |
|
September |
18.8 |
18.80–19.44 |
19.15 |
|
October |
19.15 |
18.30–19.15 |
18.58 |
|
November |
18.58 |
17.93–18.58 |
18.2 |
|
December |
18.2 |
18.09–18.65 |
18.37 |
Gov.Capital
Price range: R14.13539–R20.35272 (as of 23.03.2025).
Gov.Capital predicts a smooth decline in the USDZAR exchange rate in 2025. However, short-term corrections are possible. The average price may reach R15.70–R16.00 by the end of the year.
|
Month |
Average, R |
Best Possible Price, R |
Least Possible Price, R |
|
April |
18.50247 |
20.35272 |
16.65222 |
|
May |
18.11215 |
19.92336 |
16.30093 |
|
June |
17.74464 |
19.5191 |
15.97018 |
|
July |
17.67208 |
19.43929 |
15.90487 |
|
August |
17.1545 |
18.87 |
15.43909 |
|
September |
16.48402 |
18.13243 |
14.83562 |
|
October |
16.3108 |
17.94188 |
14.67972 |
|
November |
15.956 |
17.55159 |
14.3604 |
|
December |
15.70599 |
17.27659 |
14.13539 |
Coincodex
Price range: R17.31–R19.11 (as of 23.03.2025).
CoinCodex provides a slightly positive outlook for the USDZAR pair, with the price reaching R19.11. The average price is expected to hit R18.45 in December. The forecast takes into account global economic risks.
|
Month |
Minimum, R |
Average, R |
Maximum, R |
|
April |
17.88 |
18.16 |
18.6 |
|
May |
17.85 |
18.01 |
18.05 |
|
June |
17.58 |
17.86 |
18.25 |
|
July |
17.77 |
18.14 |
18.55 |
|
August |
17.74 |
17.9 |
18.39 |
|
September |
17.31 |
17.64 |
18.1 |
|
October |
17.51 |
17.78 |
18.02 |
|
November |
17.53 |
18.15 |
18.52 |
|
December |
17.88 |
18.45 |
19.11 |
Analysts’ USDZAR Price Projections for 2026
Analysts’ forecasts for the USDZAR exchange rate in 2026 are divided. Some experts project a decrease, while others predict rapid appreciation.
LongForecast
Price range: R17.43–R18.57 (as of 23.03.2025).
LongForecast anticipates significant fluctuations in the USDZAR exchange rate in 2026. By the end of the year, the price is expected to drop to R17.70.
|
Month |
Open, R |
Min–Max, R |
Close, R |
|
January |
18.37 |
17.55–18.37 |
17.82 |
|
June |
17.91 |
17.91–18.57 |
18.03 |
|
December |
18.25 |
17.43–18.25 |
17.7 |
Gov.Capital
Price range: R13.75471–R17.1712 (as of 23.03.2025).
Gov.Capital‘s analysts assume that the USDZAR pair will continue to slide. The average price may reach R15.54 by the end of the year. The strengthening of the rand may be prompted by improving domestic macroeconomics.
|
Month |
Average, R |
Best Possible Price, R |
Least Possible Price, R |
|
January |
15.28301 |
16.81131 |
13.75471 |
|
June |
16.61018 |
17.1712 |
14.04917 |
|
December |
15.54974 |
17.10471 |
13.99476 |
Coincodex
Price range: R18.23–R23.94 (as of 23.03.2025).
CoinCodex expects a progressive appreciation of the US dollar. The price may reach the R23.94 mark.
|
Month |
Minimum, R |
Average, R |
Maximum, R |
|
January |
18.59 |
18.96 |
19.41 |
|
June |
18.23 |
18,55 |
18.99 |
|
December |
21.61 |
22.66 |
23.94 |
Analysts’ USDZAR Price Projections for 2027
Analysts predict that the USDZAR exchange rate will fluctuate within a broad range throughout 2027. However, the projections differ, with some experts suggesting a moderate increase and others foreseeing potential depreciation.
LongForecast
Price range: R16.91–R19.76 (as of 23.03.2025).
LongForecast predicts a steady recovery of the USDZAR pair in 2027. The price will open at R17.70, climbing to R19.47 by December. High volatility is expected. Swings in the exchange rate are related to changes in US Fed interest rates and demand for commodities.
|
Month |
Open, R |
Min–Max, R |
Close, R |
|
January |
17.7 |
16.91–17.70 |
17.17 |
|
June |
18.17 |
18.17–18.87 |
18.59 |
|
December |
19.1 |
19.10–19.76 |
19.47 |
Gov.Capital
Price range: R14.49724–R18.89065 (as of 23.03.2025).
Gov.Capital forecasts that the USDZAR pair will edge up moderately in 2027, reaching the high of R18.89.
|
Month |
Average, R |
Best Possible Price, R |
Least Possible Price, R |
|
January |
16.10805 |
17.71885 |
14.49724 |
|
June |
17.17332 |
18.89065 |
15.45599 |
|
December |
16.92508 |
18.61759 |
15.23257 |
Coincodex
Price range: R20.32–R25.41 (as of 23.03.2025).
CoinCodex offers the most optimistic scenario. The pair’s exchange rate will reach R25.41 in January, R23.82 in June, and R21.31 in December. The forecast indicates a possible devaluation of the rand amid inflationary risks and geopolitical factors.
|
Month |
Minimum, R |
Average, R |
Maximum, R |
|
January |
23.31 |
24.55 |
25.41 |
|
June |
21.75 |
22.78 |
23.82 |
|
December |
20.32 |
20.91 |
21.31 |
Analysts’ USDZAR Price Projections for 2028
Experts anticipate a moderate increase in the volatility of the USDZAR currency pair in 2028, driven by both global macroeconomic shifts and domestic policies in South Africa and the US. Forecasts indicate a gradual strengthening of the US dollar during this period.
LongForecast
Price range: R18.85–R20.80 (as of 23.03.2025).
According to LongForecast, the pair will open the year at R19.47 and close at R20.49. The outlook points to a sustained firming of the US dollar throughout the year amid a potential slowdown in South Africa’s GDP and volatility in the commodity sector.
|
Month |
Open, R |
Min–Max, R |
Close, R |
|
January |
19.47 |
19.47–20.35 |
20.05 |
|
June |
19.73 |
18.85–19.73 |
19.14 |
|
December |
20.01 |
20.01–20.80 |
20.49 |
Gov.Capital
Price range: R13.45944–R18.45959 (as of 23.03.2025).
Gov.Capital forecasts strong volatility for the USDZAR pair in 2028. The asset is expected to slide steadily. The exchange rate may be influenced by global demand for commodities and central banks’ decisions.
|
Month |
Average, R |
Best Possible Price, R |
Least Possible Price, R |
|
January |
16.78144 |
18.45959 |
15.1033 |
|
June |
15.86315 |
17.44947 |
14.27684 |
|
December |
14.95494 |
16.45043 |
13.45944 |
Coincodex
Price range: R18.49–R20.83 (as of 23.03.2025).
CoinCodex anticipates that the average price will hit R20.47 in January and R19.75 in December. The forecast is neutral, suggesting minor price fluctuations.
|
Month |
Minimum, R |
Average, R |
Maximum, R |
|
January |
19.96 |
20.47 |
20.83 |
|
June |
19.03 |
19.43 |
19.73 |
|
December |
18.49 |
19.75 |
20.76 |
Analysts’ USDZAR Price Projections for 2029
Forecasts for 2029 are mixed, with some analysts expecting a significant weakening of the rand and others predicting moderate stability. Macroeconomic uncertainty and South Africa’s dependence on commodity markets continue to shape diverse expectations for the USDZAR exchange rate.
Gov.Capital
Price range: R11.67422–R15.91446 (as of 23.03.2025).
Gov.Capital‘s forecast for 2029 indicates a downward movement of the exchange rate. The price may plummet to R11.67 by June, slightly recovering by December. The slump is attributed to increasing interest in emerging markets.
|
Month |
Average, R |
Best Possible Price, R |
Least Possible Price, R |
|
January |
14.46769 |
15.91446 |
13.02092 |
|
June |
12.97136 |
14.26849 |
11.67422 |
|
December |
12.99392 |
14.29332 |
11.69453 |
Coincodex
Price range: R17.87–R22.04 (as of 23.03.2025).
CoinCodex expects the asset to soar. The average price may reach R18.38 in early 2029, rising to R21.51 by December. The forecast reflects the potential volatility associated with the US Fed policy and commodity prices.
|
Month |
Minimum, R |
Average, R |
Maximum, R |
|
January |
17.87 |
18.38 |
18.79 |
|
June |
18.94 |
20.02 |
20.92 |
|
December |
20.52 |
21.51 |
22.04 |
Analysts’ USDZAR Price Projections for 2030
Analysts generally hold a cautiously optimistic stance toward the US dollar’s prospects for 2030. The USDZAR exchange rate is expected to experience significant fluctuations influenced by various global economic factors.
Gov.Capital
Price range: R11.62273–R14.4248 (as of 23.03.2025).
Gov.Capital expects further depreciation of the USDZAR price. The pair may stabilize near R12–R13.
|
Month |
Average, R |
Best Possible Price, R |
Least Possible Price, R |
|
January |
12.91414 |
14.20556 |
11.62273 |
|
March |
13.11346 |
14.4248 |
11.80211 |
Coincodex
Price range: R20.01–R22.73 (as of 23.03.2025).
CoinCodex predicts moderate gains throughout the year, with the highest price of R22.73. The US dollar is forecast to strengthen steadily amid stable interest rates in the US and a waning appetite for risky assets.
|
Month |
Minimum, R |
Average, R |
Maximum, R |
|
January |
20.01 |
20.86 |
21.91 |
|
June |
21.2 |
21.96 |
22.73 |
|
December |
21.12 |
21.71 |
22.33 |
Analysts’ USDZAR Price Projections until 2050
Forecasting the USDZAR exchange rate for 2050 involves a high degree of uncertainty. Such long-term estimates require taking into account a variety of macroeconomic, political, and financial factors. Even minor changes can seriously alter the pair’s movement.
Most analytical platforms tend to avoid making such long-term forecasts since it is difficult to factor in all the aspects. However, given the current trends and suggested volatility, it can be assumed that the USDZAR pair will trade in a wide range. This is connected to the sensitivity of the South African currency to external economic turbulence and unstable demand for commodities.
Market Sentiment for USDZAR on Social Media
Social media plays a key role in shaping market expectations. Traders’ posts often reflect short-term sentiment and can influence the opinions of other market participants.
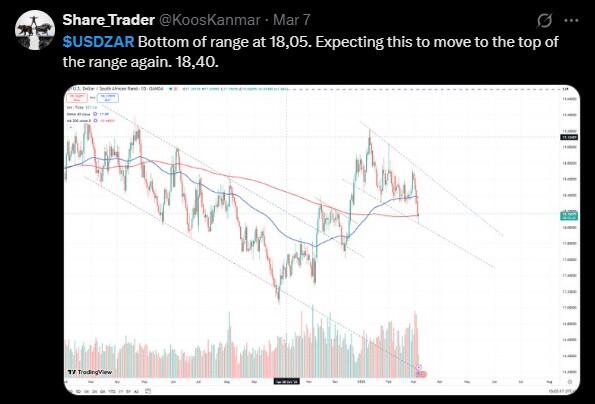
For example, @KoosKanmar suggests the USDZAR pair will climb from the support of R18.05 to R18.40. The user expects it to continue trading in a narrow range in the near term.
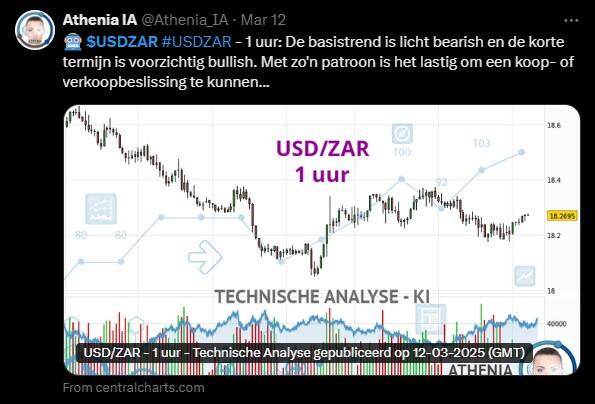
Analyst @Athenia_IA points to a downtrend but does not rule out gains in the short term.
Overall, the sentiment among market participants is cautiously optimistic. The price is expected to move within a trading channel. Such assessments confirm technical signals pointing to the potential moderate growth.
USDZAR Price History
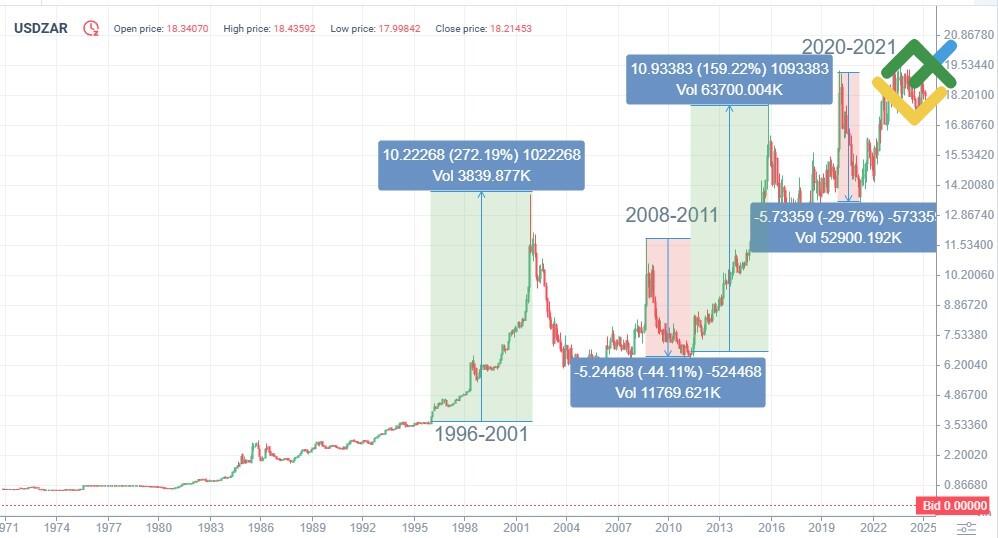
The USDZAR pair reached its all-time high of 19.91 ZAR on 01.06.2023.
The all-time low of the USDZAR pair was recorded on 31.08.2006 when the price declined to 1.5715 ZAR.
The chart below shows the USDZAR pair performance over the last ten years.
It is crucial to evaluate historical data to make predictions as accurate as possible.
The USDZAR pair, representing the exchange rate between the US dollar and the South African rand, has a long trading history characterized by significant price fluctuations.
The exchange rate remained relatively stable in the 1980s. However, starting in the early 2000s, the rand began to weaken amid political instability and economic challenges in South Africa. By 2008, the global financial crisis triggered a sharp rise in the USDZAR pair, pushing it above the R11 mark.
Since 2015, the pair has exhibited increased volatility since it is highly vulnerable to changes in commodity prices, US Fed decisions, and political events in South Africa. In 2020, the rate exceeded R19 amid the COVID-19 pandemic. Since then, the pair has been trading in a wide range.
USDZAR Price Fundamental Analysis
Fundamental analysis is crucial for understanding the economic and political factors influencing the USDZAR currency pair. It aids in assessing risks, identifying market trends, and making informed trading decisions for short-term and long-term trading.
What Factors Affect the USDZAR Pair?
The USDZAR exchange rate is determined by a range of internal and external economic factors.
- Interest rates. The difference between the US Fed and the central bank of South Africa’s rates affects capital flows and asset appeal.
- Commodity prices. South Africa depends on exports of platinum, gold, and other resources. Rising prices strengthen the rand while falling prices weaken it.
- Inflation. High inflation in South Africa undermines confidence in the currency and reduces its purchasing power.
- US economic data. Labor market, inflation, and GDP reports directly affect the value of the US dollar.
- Political stability. Internal problems in South Africa reduce investor interest in the rand.
- Investor’s risk appetite. During global instability, the US dollar strengthens as a safe asset.
- Geopolitics and sanctions affect trade, investment, and capital inflows into South Africa.
More Facts About USDZAR
The USDZAR currency pair indicates the exchange rate between the US dollar and the South African rand, a currency introduced in 1961 when South Africa became a republic. This pair is actively traded on Forex and is known for its volatility. Its popularity is rooted in the rand’s attractiveness as a commodity currency since the South African economy depends on the export of gold, platinum, and other resources.
Traders and investors utilize the USDZAR pair for speculation, hedging, and diversifying their portfolios. This currency pair is particularly responsive to global economic and political developments. Additionally, it often serves as an indicator of sentiment in emerging markets.
Advantages and Disadvantages of Investing in USDZAR
The USDZAR currency pair can become an attractive asset for both short-term traders and long-term investors. However, it is crucial to take into account its specific features.
Advantages
- High volatility allows traders to profit from short-term rate fluctuations.
- Macroeconomic data from South Africa and the US are published frequently, which simplifies making forecasts.
- Technical and fundamental analysis. The pair can be easily analyzed.
- Suitable for various strategies. It is used in speculation, hedging, and portfolio diversification.
- Dependence on commodity prices. The increase in gold and platinum prices strengthens the South African rand.
- Availability. Most Forex brokers provide access to trading this pair.
- Variety of trading sessions. The pair is actively traded during Asian, European, and US trading sessions.
- Risk indicator for emerging markets. The pair helps estimate investment sentiment in South Africa and other developing countries.
Disadvantages
- Increased risks. High volatility can lead to significant losses.
- Political instability in South Africa frequently triggers abrupt fluctuations in the exchange rate.
- Dependence on commodities. Falling metal prices are reflected in the value of the rand.
- Limited liquidity. Slippages can occur when trading volumes are low.
- Risks of currency regulation. Unexpected interventions of the South African Reserve Bank or the US Fed are possible.
- High inflation in South Africa may lead to a devaluation of the rand.
- The lack of analysis data. Expert forecasts regarding the South African economy are rarely published.
How We Make Forecasts
We use a comprehensive approach combining technical and fundamental analysis to predict the USDZAR pair’s movement.
Short-term forecasts (up to 1 month) are based on technical indicators such as the RSI, MACD, and moving averages, as well as news releases and price patterns.
Medium-term forecasts (1–6 months) take into account macroeconomic data such as interest rates, inflation, GDP data, the trade balance, and political risks.
Long-term forecasts (6 months and more) focus on geopolitical stability, commodity market trends, central banks’ forecasts, and global economic scenarios. Moreover, we analyze expert opinions, media sentiment, and historical volatility and use forecasting models from credible sources.
Conclusion: Is USDZAR a Good Investment?
The USDZAR pair can be an appealing option for short-term traders and investors aiming to diversify their portfolios. Besides, high volatility provides potential profits, especially in the short and medium term.
However, investors should be mindful of macroeconomic risks, political instability, and the dependence of the USDZAR exchange rate on the commodity sector. A thorough analysis and study of expert forecasts will help effectively utilize the opportunities of the USDZAR pair amid global economic changes.
USDZAR Price Prediction FAQ’s
The current price of the USDZAR pair is R18.22166 as of 27.03.2025.
The rand exchange rate is expected to remain volatile amid global uncertainty. Experts forecast it will fluctuate between R17 and R19.5 in the short term. However, it may strengthen due to falling commodity prices and the growing US dollar.
Analysts suggest that the USDZAR exchange rate may vary between R17 and R19.5 in 2025. The movement will be influenced by the Fed’s decisions, South Africa’s economic policy, the demand for commodities, and the inflation rate in both countries.
The rand is forecast to slide gradually in 2026. Analysts expect the pair to climb to R18–R24, bolstered by global economic trends, the growth rate of South Africa, and the international investment climate in developing countries.
Forecasts for 2030 tend to be less precise. The pair is expected to trade in the range of R21–R25. The actual rate will depend on the global economic situation, reforms in South Africa, technological progress, and regulators’ policy shifts.
The main reasons for the decline are inflation, sluggish GDP growth, political risks, budget deficit, and dependence on commodity exports. The rand is vulnerable to global volatility. Thus, when the global economy deteriorates, investors shift capital to more stable currencies.
The weakness of the South African rand is attributed to economic instability in South Africa, high government spending, low investor confidence, and the country’s dependence on commodities. Therefore, any turmoil in the global market quickly affects the rand.
The rand may strengthen if the South African economy recovers, exports increase, and investor confidence improves. However, for long-term appreciation, the country will need a stable political and economic landscape, along with a reduced reliance on commodity price fluctuations.
The USDZAR pair is highly volatile and sensitive to economic and geopolitical events. Thus, the price swings provide opportunities for speculative trading. Additionally, the pairs’ performance helps assess investment risks in developing countries.
The outlook is influenced by interest rates, economic reports, gold and platinum prices, and the US Fed and the South African Reserve Bank policies. Moreover, geopolitics, trade wars, commodity demand, and foreign capital inflows/outflows are crucial.
Yes, macroeconomic data releases, political elections, central bank decisions, and global crises can dramatically affect the exchange rate. Investors take these events into account when making forecasts, which impacts the liquidity and short-term volatility of the USDZAR pair.
Price chart of USDZAR in real time mode

The content of this article reflects the author’s opinion and does not necessarily reflect the official position of LiteFinance broker. The material published on this page is provided for informational purposes only and should not be considered as the provision of investment advice for the purposes of Directive 2014/65/EU.
According to copyright law, this article is considered intellectual property, which includes a prohibition on copying and distributing it without consent.
{{value}} ( {{count}} {{title}} )
This post is originally published on LITEFINANCE.