The USD to CAD exchange rate fluctuates constantly, leaving investors to wonder whether prices will rise or fall in the coming years. Forecasting the dollar-to-Canadian dollar rate is complex, with factors like interest rates, economic growth, commodity prices, and political events all impacting. By examining historical trends, relative economic performance, and monetary policy differences between the US and Canada, our forecast aims to help investors and traders make informed judgments.
To build our model, we will analyze events like interest rate decisions, oil prices, and GDP projections. Whether you are planning transactions, hedging exposure, or looking to trade the Canadian dollar, our long-term USD to CAD outlook can guide your strategy. Stay ahead of market movements by reading our detailed forecast covering the next several years.
The article covers the following subjects:
Highlights and Key Points: USD CAD Forecast 2024–2029
-
Today, 02.10.2024, the USDCAD exchange rate is 1.34732 CAD per 1 USD.
-
Analyst opinions concerning the USDCAD’s rate up to the end of 2024 vary significantly.
-
Some experts expect the price to continue dropping to 1.3145-1.3350, while others anticipate growth to 1.3600-1.3810.
-
Mixed trends are projected in 2025, with the USDCAD rate ranging from 1.2000 to 1.8400. Some analysts presume the pair may climb to 1.3680-1.4522 by the end of 2025, while others believe the USDCAD price will settle at 1.2500-1.2878.
-
Many experts estimate that the pair’s price will range from 1.3000 to 1.4040 in 2026. The most optimistic forecasts suggest the rate may grow to 1.4680-2.0000, whereas pessimists expect the USDCAD price to fall to 1.1400.
-
Long-term forecasts for 2027-2030 are controversial as many fundamental factors can affect the pair. Thus, the USDCAD rate may rise to 1.5660 – 1.5907 by 2030. A more conservative outlook suggests the pair will trade from 1.3040 to 1.4000.
USD CAD Price Today Coming Days and Week
When predicting the USDCAD exchange rate in the short term, closely monitor economic indicators from both the United States and Canada, such as GDP growth, employment data, and inflation rates. Interest rate decisions and monetary policy updates from the Federal Reserve and the Bank of Canada are particularly influential. Additionally, consider geopolitical events and commodity price fluctuations, especially oil prices, as Canada is a major oil exporter and such changes can impact the Canadian dollar. Technical analysis, focusing on trends and volume, can also provide insights into potential currency movements. Understanding these dynamics is crucial for forecasting USDCAD movements effectively.
Analysts’ USD CAD Projections for 2024
Let’s take a look at USDCAD’s expert forecasts for 2024.
Trading Economics
Price range for 2024: 1.3500 – 1.3600 (estimated as of 26.09.2024).
Based on Trading Economics‘s macro models and analysts’ expectations, USDCAD will trade at 1.3500 by the end of the current quarter. By the end of 2024, experts expect growth to 1.3600.
ExchangeRates
Price range for 2024: 1.2800 – 1.4000 (estimated as of 26.09.2024).
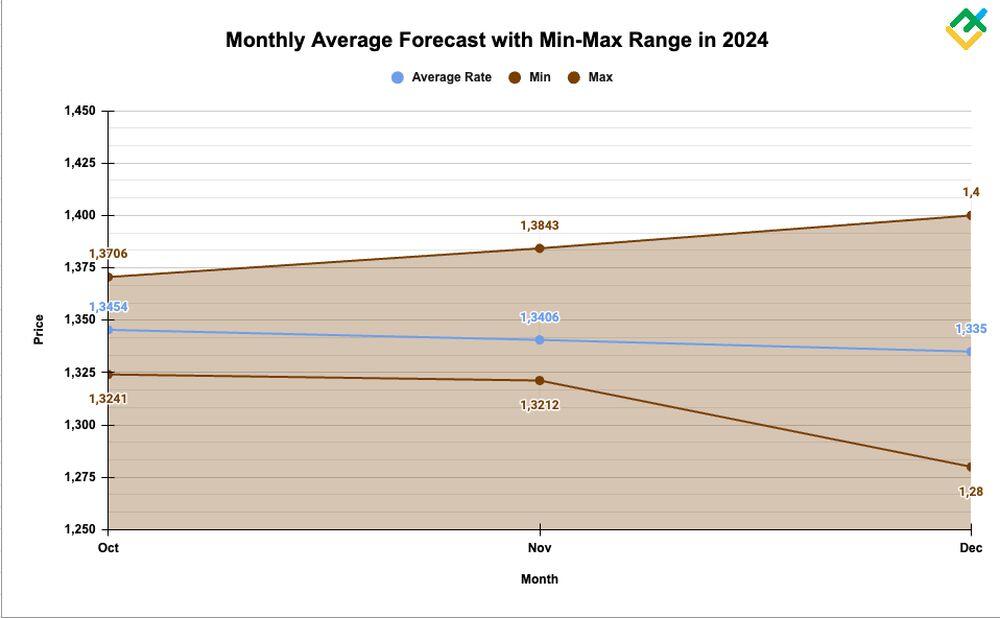
According to ExchangeRates‘s data, the USDCAD average price will hit 1.3508 at the beginning of October. Then, a decline to 1.3350 is expected by year-end.
The minimum and the maximum prices for the same period will equal 1.2800 and 1.4000.
|
Date |
Average price, CA$ |
Minimum, CA$ |
Maximum, CA$ |
|
October |
1.3508 |
1.3469 |
1.3554 |
|
1.3454 |
1.3241 |
1.3706 |
|
|
November |
1.3447 |
1.3212 |
1.3726 |
|
1.3406 |
1.3035 |
1.3843 |
|
|
December |
1.3399 |
1.3006 |
1.3863 |
|
1.3350 |
1.2800 |
1.4000 |
Predict-Price
Price range for 2024: 1.2600 – 1.6900 (estimated as of 26.09.2024).
The Predict-Price portal estimates the likelihood of the USDCAD’s further decline by the end of 2024 at 20.43%, with the lowest and highest price potentially reaching 1.2600 and 1.6900.
Panda Forecast
Price range for 2024: 1.3400 – 1.4719 (estimated as of 26.09.2024).
Analysts at Panda Forecast predict that the currency pair’s quotes will vary between 1.3400 and 1.4719 by the end of 2024. The USDCAD average price may reach 1.4245 by year-end, developing in an upward range.
|
Month |
Average price, CA$ |
Minimum, CA$ |
Maximum, CA$ |
|
2024 |
|||
|
October |
1.3740 |
1.3400 |
1.4204 |
|
November |
1.4093 |
1.3643 |
1.4410 |
|
December |
1.4245 |
1.4085 |
1.4719 |
Longforecast
Price range for 2024: 1.2930 – 1.3850 (estimated as of 26.09.2024).
Conversely, experts at Longforecast anticipate a continued downtrend, with the price hitting 1.3260 by the end of 2024. The USDCAD pair is expected to trade between 1.2930 and 1.3460.
|
Month |
Opening price, CA$ |
Low/ High, CA$ |
Closing price, CA$ |
Change |
|
2024 |
||||
|
October |
1.3490 |
1.3240-1.3850 |
1.3440 |
-0.4% |
|
November |
1.3440 |
1.2930-1.3440 |
1.3130 |
-2.7% |
|
December |
1.3130 |
1.3060-1.3460 |
1.3260 |
-1.7% |
Walletinvestor
Price range for 2024: 1.3620 – 1.3840 (estimated as of 26.09.2024).
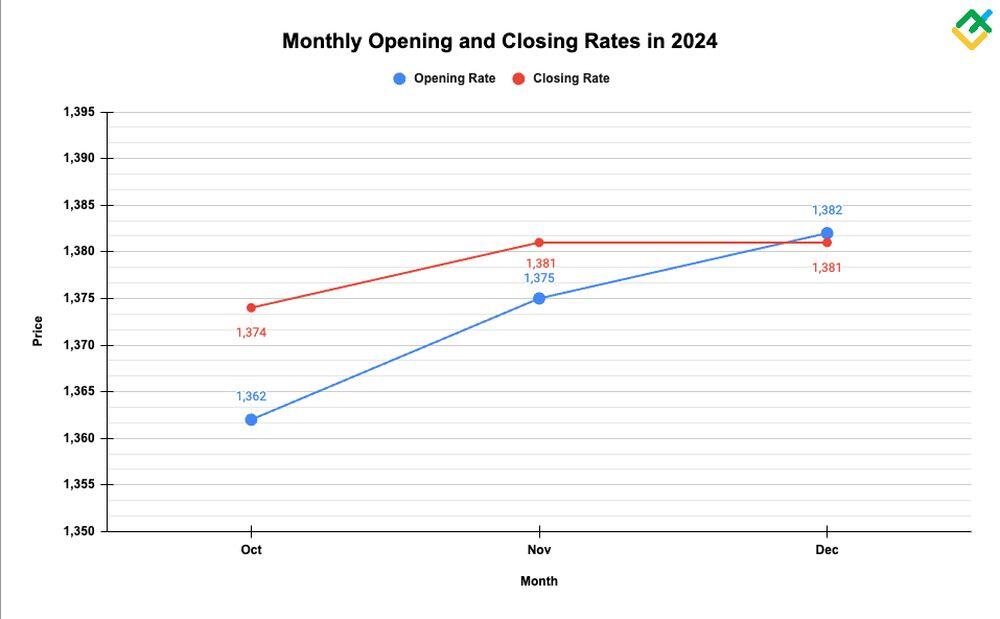
Based on Walletinvestor‘s estimates, the price will vary from 1.3620 to 1.3840 in the next three months, reaching 1.3810 by year-end.
|
Date |
Opening price, CA$ |
Closing price, CA$ |
Minimum price, CA$ |
Maximum price, CA$ |
Tod/End |
|
2024 |
|||||
|
October |
1.3620 |
1.3740 |
1.3620 |
1.3740 |
0.84 % ▲ |
|
November |
1.3750 |
1.3810 |
1.3750 |
1.3810 |
0.49 % ▲ |
|
December |
1.3820 |
1.3810 |
1.3810 |
1.3840 |
-0.04%▼ |
Gov Capital
Price range for 2024: 1.3000 – 1.4000 (estimated as of 26.09.2024).
Experts at Gov Capital anticipate the USDCAD to hit 1.3600 by the end of 2024. The lowest possible price will likely equal 1.3000 and the maximum value – 1.4000
|
Date |
Average price, CA$ |
Lowest possible price, CA$ |
Highest possible price, CA$ |
|
01.10.2024 |
1.3500 |
1.3100 |
1.3900 |
|
31.10.2024 |
1.3600 |
1.3200 |
1.4000 |
|
01.11.2024 |
1.3600 |
1.3200 |
1.4000 |
|
30.11.2024 |
1.3400 |
1.3000 |
1.3800 |
|
01.12.2024 |
1.3400 |
1.3000 |
1.3800 |
|
31.12.2024 |
1.3600 |
1.3200 |
1.4000 |
Coincodex
Price range for 2024: 1.2979 – 1.3492 (estimated as of 26.09.2024).
Analysts at Coincodex project quotes to decline to 1.3145 in the next three months.
|
Year |
Average price, CA$ |
Change |
|
2024 |
1.3145 |
-2.38% |
USDCAD Technical Analysis
To make a forecast for the USDCAD currency pair for the rest of 2024 and beyond, we will analyze the price chart on H4, D1, W1, and MN time frames. For a more detailed analysis, using indicators such as MACD, RSI, OBV, MA Cross, and tick volumes is recommended. Combining these tools will allow us to determine liquid buying and selling zones, the strength and nature of the market trend, overbought and oversold zones, and potential reversal points.
Using candlestick and chart analysis is also recommended. The different structures of candlesticks and graphical patterns will allow us to determine the market state and profitable entry points and anticipate possible changes.
The most popular candlestick analysis patterns include Marubozu, Star pattern varieties (Morning Star, Evening Star, Shooting Star), Triangles, Bull/Bear flags, and others.
We will first look at the monthly chart to determine the current market situation and market participants’ general sentiment.
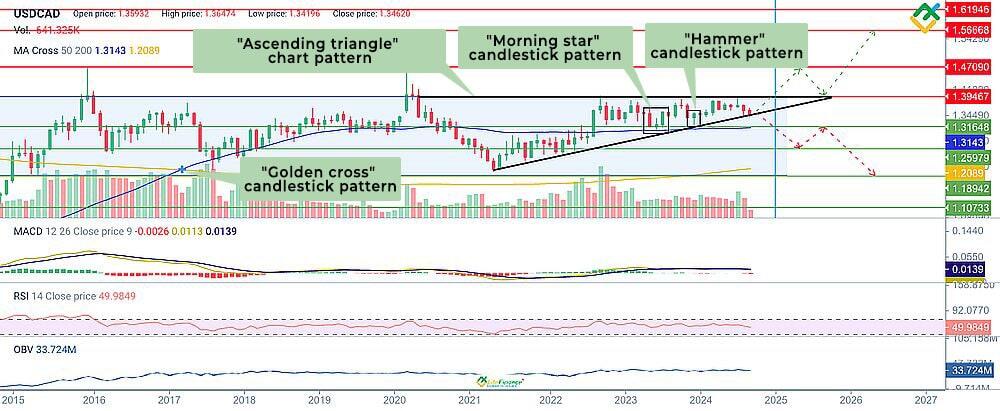
The USDCAD pair has been in the consolidation zone of 1.1894-1.3946 for nine years since January 2015. A large chart pattern Ascending triangle, which has been forming since March 2020, is expected to be broken to the upside, with a potential target at 1.5666.
The characteristic feature of this pattern is rising lows and horizontal highs at the same resistance level, in our case, at 1.3946.
The price has formed bullish reversal patterns Morning Star and Hammer at the key support of 1.3164, which signals the low price area has been reached. Quotes could now reverse up.
In July 2024, a sharp surge in tick volumes was recorded — the bulls tried to break through the resistance of 1.3946. However, the attempt failed, and the price returned to the level of 1.3717.
According to the OBV indicator, trading volumes are neutral. Based on the MA Cross indicator, a golden cross formed in March 2017, signaling upcoming growth. The USDCAD market price is above the moving averages MA-50 and MA-200, located at 1.3144 and 1.2089, respectively. These levels currently act as dynamic support.
The MACD values have been near the zero border since June 2023, and there are no clear signals to buy or sell — the market is in the accumulation phase. RSI began to gradually decline and reached the value of 50 after a long sideways movement. This indicates neutral dynamics for the trading instrument.
This preliminary analysis indicates a neutral trajectory with predominantly pronounced bullish signals. There is no particular trading activity, which is typical of the “ascending triangle” pattern during its formation stage.
The pair will most likely trade in a neutral range of 1.3164-1.3946 until the end of 2024, with a breakout of the upper border of the “ascending triangle” pattern in the first half of 2025.
Get access to a demo account on an easy-to-use Forex platform without registration
USDCAD Forecast For Next Three Months
To determine the dynamics of the #USDCAD stock price for the next three months, we will analyze the H4 and D1 charts.
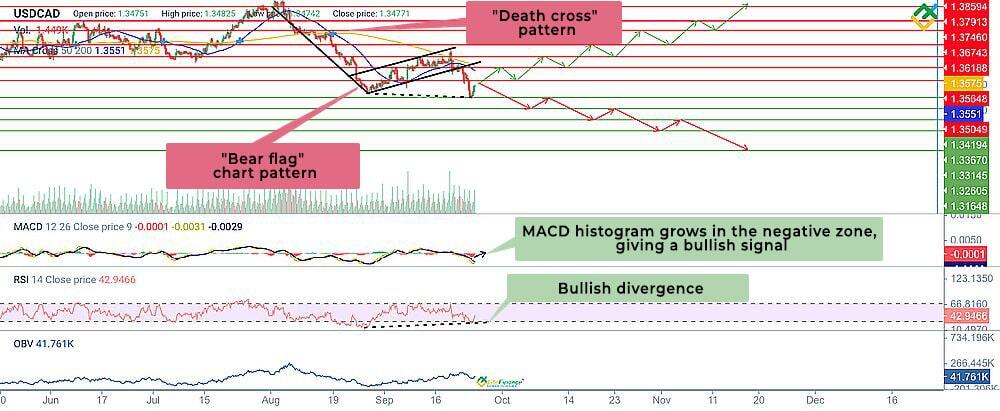
Chart patterns and technical indicators have produced mixed signals. A large bearish flag pattern is currently developing, from which the price exited to the downside at 1.3564.
The MA Cross indicator shows a Death Cross pattern. Meanwhile, the price has broken through the dynamic levels of MA-50 and MA-200, signaling a further decline.
Still, the MACD indicator values are growing in the negative zone, approaching the zero boundary. The RSI indicator shows a bullish divergence, while the values have pulled back from the lower border and continue growing, signaling that long positions could be opened.
The OBV indicator shows that trading volumes are growing smoothly, meaning the demand is recovering.
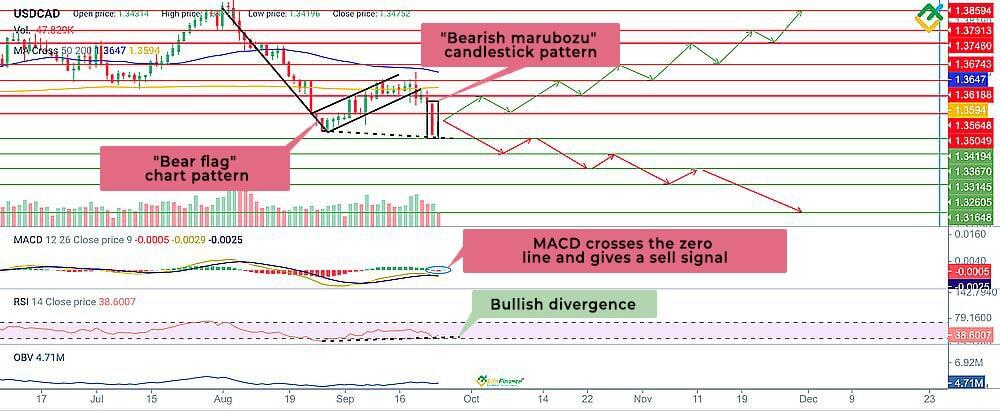
The bear flag pattern with an exit at 1.3564 and a potential target around 1.3164 can be identified on the USDCAD pair’s daily chart. There’s also a bearish marubozu forming — a signal of strong selling pressure.
Tick volumes are decreasing, demonstrating traders’ weak interest in the asset. OBV trading volumes are moving horizontally, with no signals to open positions. The MACD values have crossed the zero border downwards and continue to decline in the negative zone, a signal to open short positions.
The RSI shows a bullish divergence, warning traders that the asset is oversold and quotes may reverse up.
In the current situation, an upward correction to 1.3504-1.3564 will most likely occur, followed by a downward reversal with targets at 1.3419-1.3164 in the next three months.
If the price consolidates above 1.3564, the bear flag pattern may be canceled, and quotes may rise to 1.3618-1.3859.
Long-Term USDCAD Analysis for 2024
We will analyze the weekly chart to determine the USDCAD’s trajectory until the end of 2024 and beyond.
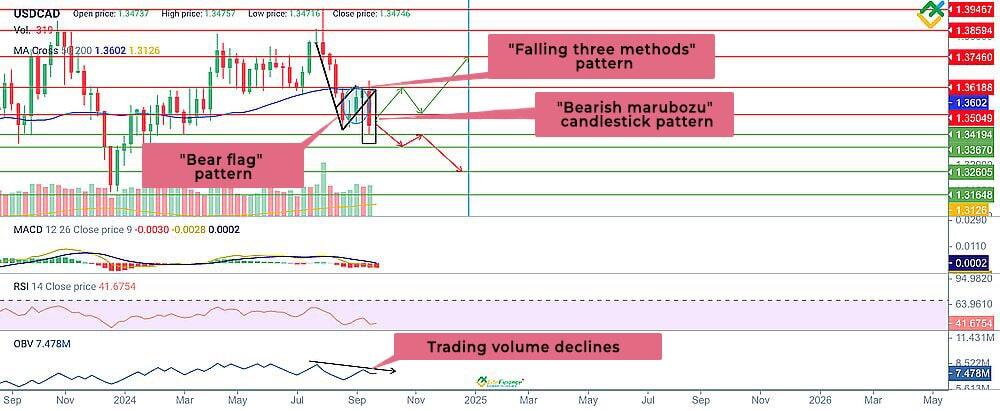
We see the bearish flag pattern broken to the downside in an impulse move. We can also see three bearish stair steps and a bearish marubozu at 1.3504, which indicates a continued downtrend.
The values of the MACD indicator are in the negative zone and show negative dynamics. The RSI values are below 50, indicating a bearish trend development.
Trading volumes are also decreasing — that’s a signal to open short positions with targets at around 1.3419-1.3164.
In the long term, prioritize short positions. A breakout and consolidation below the key support of 1.3419 will allow the price to decline to 1.3164 by the end of 2024.
|
Month |
USDCAD projected values |
|
|
Minimum, CA$ |
Maximum, CA$ |
|
|
October 2024 |
1.3371 |
1.3483 |
|
November 2024 |
1.3334 |
1.3421 |
|
December 2024 |
1.3269 |
1.3354 |
USDCAD Long-Term Trading Plan
The technical analysis of the USDCAD pair is indicative of a continued downtrend in the coming months.
Trading Strategy for the next three months
-
A bearish flag pattern is forming on the H4 and daily charts, with a breakout at 1.3564. The potential target is at 1.3164.
-
Additionally, a bearish marubozu pattern is developing, signaling the continuation of the downtrend.
-
Technical indicators predominantly suggest opening short positions. However, the RSI indicator shows a bullish divergence, warning of a potential upward price reversal.
-
A breakout and consolidation below the key support level of 1.3419 will confirm the bearish flag. Short positions can be opened with targets at around 1.3367–1.3164 in this case.
-
A recovery above 1.3564 will cancel the bearish flag pattern and pave the way for an upward move to 1.3618–1.3859.
-
The key support levels are 1.3419, 1.3367, 1.3314, 1.3260, and 1.3164.
-
The key resistance levels are 1.3504, 1.3564, 1.3594, 1.3618, 1.3647, 1.3674, 1.3746, 1.3791, and 1.3859.
One-year trading plan:
-
The USDCAD weekly chart also shows a bearish flag, three bearish steps, and a bearish marubozu pattern. They signal bearish predominance in the market.
-
So, the price will likely continue declining to support at 1.3419. If quotes drop lower, this could drive sales down to 1.3164.
-
The key support levels are 1.3419, 1.3367, 1.3260, and 1.3164.
-
The key resistance levels are 1.3504, 1.3602, 1.3618, 1.3746, 1.3859, and 1.3946.
USD CAD Forecast for 2025
Let’s take a look at USDCAD’s expert forecasts for 2025.
ExchangeRates
Price range for 2025: 1.2500 – 1.4400 (estimated as of 26.09.2024).
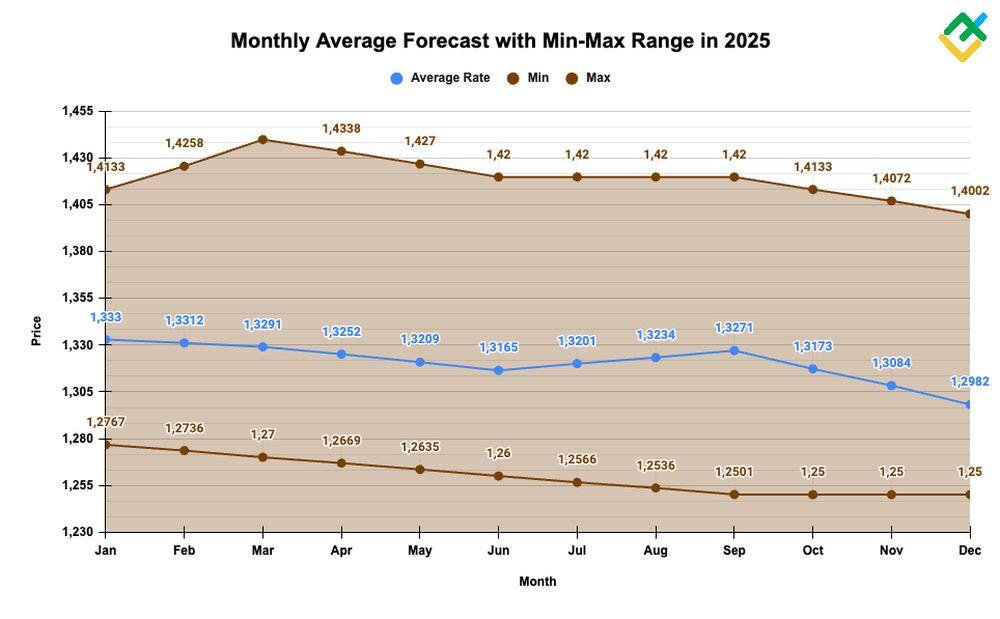
Based on ExchangeRates’ outlook, the USDCAD rate will vary widely in the first six months of 2025, between 1.2600 and 1.4400. The average price may equal 1.3165 by the end of the year.
The trend will remain downward in the year’s second half — the pair will trade between 1.2500 and 1.4200 and reach 1.2982 by the end of December.
|
Date |
Average price, CA$ |
Minimum, CA$ |
Maximum, CA$ |
|
January |
1.3349 |
1.2798 |
1.4009 |
|
1.3330 |
1.2767 |
1.4133 |
|
|
February |
1.3328 |
1.2762 |
1.4151 |
|
1.3312 |
1.2736 |
1.4258 |
|
|
March |
1.3309 |
1.2731 |
1.4276 |
|
1.3291 |
1.2700 |
1.4400 |
|
|
April |
1.3287 |
1.2697 |
1.4393 |
|
1.3252 |
1.2669 |
1.4338 |
|
|
May |
1.3248 |
1.2666 |
1.4332 |
|
1.3209 |
1.2635 |
1.4270 |
|
|
June |
1.3204 |
1.2631 |
1.4262 |
|
1.3165 |
1.2600 |
1.4200 |
|
|
July |
1.3168 |
1.2597 |
1.4200 |
|
1.3201 |
1.2566 |
1.4200 |
|
|
August |
1.3206 |
1.2562 |
1.4200 |
|
1.3234 |
1.2536 |
1.4200 |
|
|
September |
1.3238 |
1.2532 |
1.4200 |
|
1.3271 |
1.2501 |
1.4200 |
|
|
October |
1.3266 |
1.2500 |
1.4196 |
|
1.3173 |
1.2500 |
1.4133 |
|
|
November |
1.3161 |
1.2500 |
1.4124 |
|
1.3084 |
1.2500 |
1.4072 |
|
|
December |
1.3071 |
1.2500 |
1.4063 |
|
1.2982 |
1.2500 |
1.4002 |
Panda Forecast
Price range for 2025: 1.3144 – 1.5103 (estimated as of 26.09.2024).
Based on Panda Forecast‘s estimates, the USDCAD’s rate will vary from 1.3144 to 1.5103. In the first six months, the price will reach 1.3788, with the maximum value hitting 1.4261.
In the year’s second half, the USDCAD’s average price will surge, reaching 1.4522 by the end of December.
|
Month |
Average price, CA$ |
Minimum, CA$ |
Maximum, CA$ |
|
2025 |
|||
|
January |
1.3976 |
1.3775 |
1.4114 |
|
February |
1.3737 |
1.3558 |
1.3929 |
|
March |
1.3446 |
1.3144 |
1.3579 |
|
April |
1.4015 |
1.3845 |
1.4261 |
|
May |
1.4028 |
1.3592 |
1.4211 |
|
June |
1.3788 |
1.3440 |
1.3912 |
|
July |
1.4216 |
1.3883 |
1.4625 |
|
August |
1.4363 |
1.3969 |
1.4576 |
|
September |
1.4421 |
1.4246 |
1.4850 |
|
October |
1.4895 |
1.4500 |
1.5103 |
|
November |
1.4774 |
1.4402 |
1.5014 |
|
December |
1.4522 |
1.4130 |
1.4731 |
Coincodex
Price range for 2025: 1.2878 – 1.3590 (estimated as of 26.09.2024).
Analysts at Coincodex estimate that the average price in 2025 will hit 1.3384.| The annual minimum and maximum are projected to be 1.2878 and 1.3590.
|
Year |
Annual low, CA$ |
Annual high, CA$ |
|
2025 |
1.2878 |
1.3590 |
Predict-Price
Price range for 2025: 1.2000 – 1.8400 (estimated as of 26.09.2024).
Based on the AI-powered expectations of the Predict-Price analytical portal, the USDCAD pair is more than 55% likely to trend up. If these expectations are met, the USDCAD rate may reach 1.8400. If a significant fall takes place, the price may drop to 1.2000.
Gov Capital
Price range for 2025: 1.2100 – 1.4900 (estimated as of 26.09.2024).
Experts at Gov Capital predict that the USDCAD price will amount to 1.4500 in the first quarter. Then, the price is expected to decline, presumably hitting 1.2500 by year-end.
|
Date |
Average price, CA$ |
Lowest possible price, CA$ |
Highest possible price, CA$ |
|
01.01.2025 |
1.3600 |
1.3200 |
1.4100 |
|
31.01.2025 |
1.4500 |
1.4100 |
1.4900 |
|
01.02.2025 |
1.4400 |
1.4000 |
1.4800 |
|
28.02.2025 |
1.4400 |
1.4000 |
1.4900 |
|
01.03.2025 |
1.4500 |
1.4100 |
1.4900 |
|
31.03.2025 |
1.4100 |
1.3700 |
1.4500 |
|
01.04.2025 |
1.4100 |
1.3600 |
1.4500 |
|
30.04.2025 |
1.3800 |
1.3400 |
1.4200 |
|
01.05.2025 |
1.3800 |
1.3300 |
1.4200 |
|
31.05.2025 |
1.3700 |
1.3300 |
1.4100 |
|
01.06.2025 |
1.3700 |
1.3300 |
1.4100 |
|
30.06.2025 |
1.3600 |
1.3200 |
1.4100 |
|
01.07.2025 |
1.3500 |
1.3100 |
1.3900 |
|
31.07.2025 |
1.3100 |
1.2700 |
1.3500 |
|
01.08.2025 |
1.3200 |
1.2800 |
1.3600 |
|
31.08.2025 |
1.3300 |
1.2900 |
1.3600 |
|
01.09.2025 |
1.3300 |
1.2900 |
1.3700 |
|
30.09.2025 |
1.3100 |
1.2700 |
1.3500 |
|
01.10.2025 |
1.3000 |
1.2600 |
1.3400 |
|
31.10.2025 |
1.2900 |
1.2600 |
1.3300 |
|
01.11.2025 |
1.2900 |
1.2500 |
1.3300 |
|
30.11.2025 |
1.2600 |
1.2200 |
1.2900 |
|
01.12.2025 |
1.2500 |
1.2100 |
1.2900 |
|
31.12.2025 |
1.3100 |
1.2700 |
1.3500 |
Longforecast
Price range for 2025: 1.2860 – 1.3950 (estimated as of 26.09.2024).
Analysts at Longforecast predict a range of 1.2960-1.3890 in the first six months, with USDCAD quotes reaching 1.3680 through June 2025.
The price is projected to drop to 1.3060 from July to September and resume growth by the end of September, climbing to 1.3740 by December.
|
Month |
Opening price, CA$ |
Low/ High, CA$ |
Closing price, CA$ |
|
2025 |
|||
|
January |
1.3260 |
1.3100-1.3500 |
1.3300 |
|
February |
1.3300 |
1.2960-1.3360 |
1.3160 |
|
March |
1.3160 |
1.3160-1.3600 |
1.3400 |
|
April |
1.3400 |
1.3150-1.3550 |
1.3350 |
|
May |
1.3350 |
1.3290-1.3690 |
1.3490 |
|
June |
1.3490 |
1.3470-1.3890 |
1.3680 |
|
July |
1.3680 |
1.3160-1.3680 |
1.3360 |
|
August |
1.3360 |
1.2860-1.3360 |
1.3060 |
|
September |
1.3060 |
1.3060-1.3540 |
1.3340 |
|
October |
1.3340 |
1.3210-1.3610 |
1.3410 |
|
November |
1.3410 |
1.3410-1.3950 |
1.3740 |
|
December |
1.3740 |
1.3470-1.3890 |
1.3680 |
Walletinvestor
Price range for 2025: 1.3810 – 1.4260 (estimated as of 26.09.2024).
Experts at Walletinvestor anticipate an uptrend for the USDCAD pair. The price may range from 1.3810 to 1.4260 throughout the year and reach 1.4230 through late December.
|
Date |
Opening price, CA$ |
Closing price, CA$ |
Minimum price, CA$ |
Maximum price, CA$ |
|
2025 |
||||
|
January |
1.3810 |
1.3910 |
1.3810 |
1.3910 |
|
February |
1.3910 |
1.3940 |
1.3890 |
1.3940 |
|
March |
1.3950 |
1.3950 |
1.3950 |
1.4010 |
|
April |
1.3950 |
1.3900 |
1.3890 |
1.3950 |
|
May |
1.3890 |
1.3910 |
1.3890 |
1.3920 |
|
June |
1.3910 |
1.3930 |
1.3890 |
1.3930 |
|
July |
1.3940 |
1.3880 |
1.3870 |
1.3940 |
|
August |
1.3890 |
1.3940 |
1.3890 |
1.3970 |
|
September |
1.3940 |
1.4030 |
1.3930 |
1.4030 |
|
October |
1.4030 |
1.4160 |
1.4030 |
1.4160 |
|
November |
1.4160 |
1.4230 |
1.4160 |
1.4230 |
|
December |
1.4230 |
1.4230 |
1.4230 |
1.4260 |
Long-Term USD CAD Forecast for 2026
Let’s take a look at USDCAD’s expert forecasts for 2026.
Coincodex
Price range for 2026: 1.3543 – 1.6291 (estimated as of 26.09.2024).
Based on Coincodex‘s estimates, the USDCAD’s rate will vary from 1.3543 to 1.6291.
|
Year |
Annual low, CA$ |
Annual high, CA$ |
|
2026 |
1.3543 |
1.6291 |
Gov Capital
Price range for 2026: 1.3000 – 1.4700 (estimated as of 26.09.2024).
Analysts at Gov Capital expect the USDCAD average price to equal 1.3200 and reach 1.4300 by year-end. The lowest possible price may hit 1.2600, and the maximum value – 1.4700.
|
Date |
Average price, CA$ |
Lowest possible price, CA$ |
Highest possible price, CA$ |
|
01.01.2026 |
1.3200 |
1.2800 |
1.3600 |
|
31.01.2026 |
1.3100 |
1.2700 |
1.3500 |
|
01.02.2026 |
1.3100 |
1.2700 |
1.3500 |
|
28.02.2026 |
1.3000 |
1.2600 |
1.3400 |
|
01.03.2026 |
1.3000 |
1.2600 |
1.3400 |
|
31.03.2026 |
1.3200 |
1.2800 |
1.3600 |
|
01.04.2026 |
1.3200 |
1.2800 |
1.3600 |
|
30.04.2026 |
1.3200 |
1.2800 |
1.3600 |
|
01.05.2026 |
1.3300 |
1.2900 |
1.3700 |
|
31.05.2026 |
1.3300 |
1.2900 |
1.3700 |
|
01.06.2026 |
1.3300 |
1.2900 |
1.3700 |
|
30.06.2026 |
1.3100 |
1.2700 |
1.3400 |
|
01.07.2026 |
1.3000 |
1.2600 |
1.3400 |
|
31.07.2026 |
1.3600 |
1.3200 |
1.4000 |
|
01.08.2026 |
1.3600 |
1.3200 |
1.4000 |
|
31.08.2026 |
1.3500 |
1.3100 |
1.3900 |
|
01.09.2026 |
1.3600 |
1.3200 |
1.4000 |
|
30.09.2026 |
1.3400 |
1.3000 |
1.3800 |
|
01.10.2026 |
1.3500 |
1.3100 |
1.3900 |
|
31.10.2026 |
1.3900 |
1.3400 |
1.4300 |
|
01.11.2026 |
1.3900 |
1.3500 |
1.4300 |
|
30.11.2026 |
1.4200 |
1.3800 |
1.4600 |
|
01.12.2026 |
1.4300 |
1.3800 |
1.4700 |
|
31.12.2026 |
1.4300 |
1.3900 |
1.4700 |
Walletinvestor
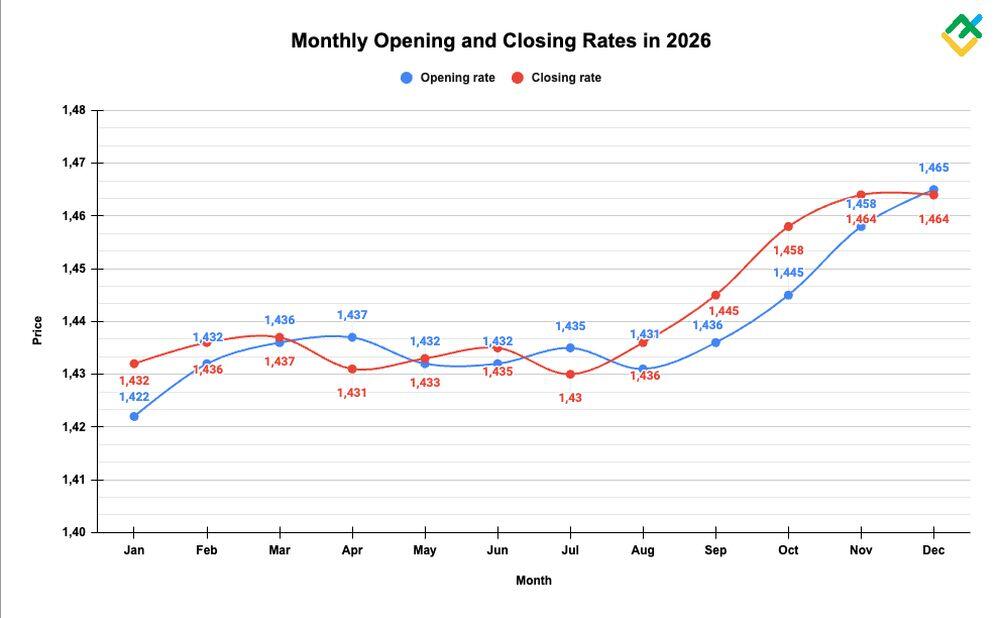
Price range for 2026: 1.4220 – 1.4680 (estimated as of 26.09.2024).
Based on Walletinvestor‘s forecast, the USDCAD rate will fluctuate between 1.4220 and 1.4680 throughout the year.
At the beginning of the year, the price may hit 1.4220 and then grow to 1.4350 through the first six months.
The value of 1.4640 is expected by year-end.
|
Date |
Opening price, CA$ |
Closing price, CA$ |
Minimum price, CA$ |
Maximum price, CA$ |
|
2026 |
||||
|
January |
1.4220 |
1.4320 |
1.4220 |
1.4320 |
|
February |
1.4320 |
1.4360 |
1.4310 |
1.4360 |
|
March |
1.4360 |
1.4370 |
1.4360 |
1.4420 |
|
April |
1.4370 |
1.4310 |
1.4310 |
1.4370 |
|
May |
1.4320 |
1.4330 |
1.4320 |
1.4340 |
|
June |
1.4320 |
1.4350 |
1.4300 |
1.4350 |
|
July |
1.4350 |
1.4300 |
1.4290 |
1.4360 |
|
August |
1.4310 |
1.4360 |
1.4310 |
1.4380 |
|
September |
1.4360 |
1.4450 |
1.4350 |
1.4450 |
|
October |
1.4450 |
1.4580 |
1.4450 |
1.4580 |
|
November |
1.4580 |
1.4640 |
1.4580 |
1.4640 |
|
December |
1.4650 |
1.4640 |
1.4640 |
1.4680 |
Longforecast
Price range for 2026: 1.2890 – 1.4040 (estimated as of 26.09.2024).
Analysts at Longforecast expect the quotes to decline in the first half of the year, reaching 1.3270 by the end of April, and then reverse up, trading at 1.3610 at the beginning of June.
In the year’s second half, quotes are projected to vary from 1.2890 to 1.4040, potentially reaching 1.3750 by December.
|
Month |
Opening price, CA$ |
Low/ High, CA$ |
Closing price, CA$ |
|
2026 |
|||
|
January |
1.3680 |
1.3150-1.3680 |
1.3350 |
|
February |
1.3350 |
1.3170-1.3570 |
1.3370 |
|
March |
1.3370 |
1.3200-1.3600 |
1.3400 |
|
April |
1.3400 |
1.3070-1.3470 |
1.3270 |
|
May |
1.3270 |
1.3270-1.3810 |
1.3610 |
|
June |
1.3610 |
1.3170-1.3610 |
1.3370 |
|
July |
1.3370 |
1.3290-1.3690 |
1.3490 |
|
August |
1.3490 |
1.3090-1.3490 |
1.3290 |
|
September |
1.3290 |
1.2890-1.3290 |
1.3090 |
|
October |
1.3090 |
1.3090-1.3680 |
1.3480 |
|
November |
1.3480 |
1.3480-1.4040 |
1.3830 |
|
December |
1.3830 |
1.3540-1.3960 |
1.3750 |
Predict-Price
Price range for 2026: 1.1400 – 2.0000 (estimated as of 26.09.2024).
The Predict-Price analytical portal anticipates further growth with a 34.68% likelihood. Thus, the price may climb to 2.0000. Still, a fall to 1.1400 cannot be excluded.
Recent Price History of the USD CAD Pair
Over 2021-2023, the USD/CAD exchange rate experienced significant volatility stemming from shifts in global growth, monetary policies, commodity markets, and risk appetite. Relative US/Canada economic performance and oil price fluctuations saw USD/CAD reach recent highs of 1.37 CAD in October 2023 and sub-1.311 lows back in July 2023 – representing a 5%+ peak-to-trough range amid a three-year average of 1.3502 CAD. With inflation pressures, interest rate adjustments, and unpredictable geopolitics impacting major exporters like Canada, USD/CAD was left to oscillate unpredictably between bullish and bearish forces. This underscores the complex drivers at play for globally exposed currencies – where external shocks can trigger significant pricing swings even in a matter of months.
In early August 2024, the Canadian currency strengthened rapidly amid a trade surplus of CA$638 million in June.
Moreover, the bearish reversal was driven by positive data on the Canadian services business activity index: the indicator rose from 47.1 in June to 47.3 in July. According to the September report, the indicator rose again to 47.8.
Besides, the Canadian dollar is supported by rising oil prices amid geopolitical tensions in the Middle East.
It should be noted that the US Federal Reserve cut the key interest rate to 5% on September 18, 2024, which also supported the Canadian currency.
Long-Term USD CAD Forecast for 2027-2028
Reputable analytical agencies provide mixed forecasts regarding the long-term outlook for the USDCAD. This is due to the fact that a variety of factors influence the pair’s quotes.
Gov Capital
Analysts at Gov Capital project that the USDCAD average price will reach 1.4300 at the beginning of 2027 and hit 1.4500 by year-end.
Neutral dynamics are expected throughout 2028, with the exchange rate fluctuating around 1.4500.
In 2029, analysts predict a downward trend, from 1.4400 at the beginning of the year to 1.4000 by September.
|
Date |
Average price, CA$ |
Lowest possible price, CA$ |
Highest possible price, CA$ |
|
01.01.2027 |
1.4300 |
1.3900 |
1.4700 |
|
31.12.2027 |
1.4500 |
1.4100 |
1.4900 |
|
01.01.2028 |
1.4500 |
1.4000 |
1.4900 |
|
31.12.2028 |
1.4500 |
1.4000 |
1.4900 |
|
01.01.2029 |
1.4400 |
1.4000 |
1.4800 |
|
12.09.2029 |
1.4000 |
1.3600 |
1.4400 |
Coincodex
During 2027-2028, Coincodex‘s analysts forecast a steady downward trend, with the price fluctuating between 1.4105 and 1.7081.
In 2029-2030, experts expect the US dollar to strengthen. In 2029, the pair is projected to trade between 1.4314 and 1.5912. In 2030, the exchange rate is expected to fluctuate between 1.5141 and 1.5907.
|
Year |
Annual low, CA$ |
Annual high, CA$ |
|
2027 |
1.4583 |
1.7081 |
|
2028 |
1.4105 |
1.6069 |
|
2029 |
1.4314 |
1.5912 |
|
2030 |
1.5141 |
1.5907 |
Walletinvestor
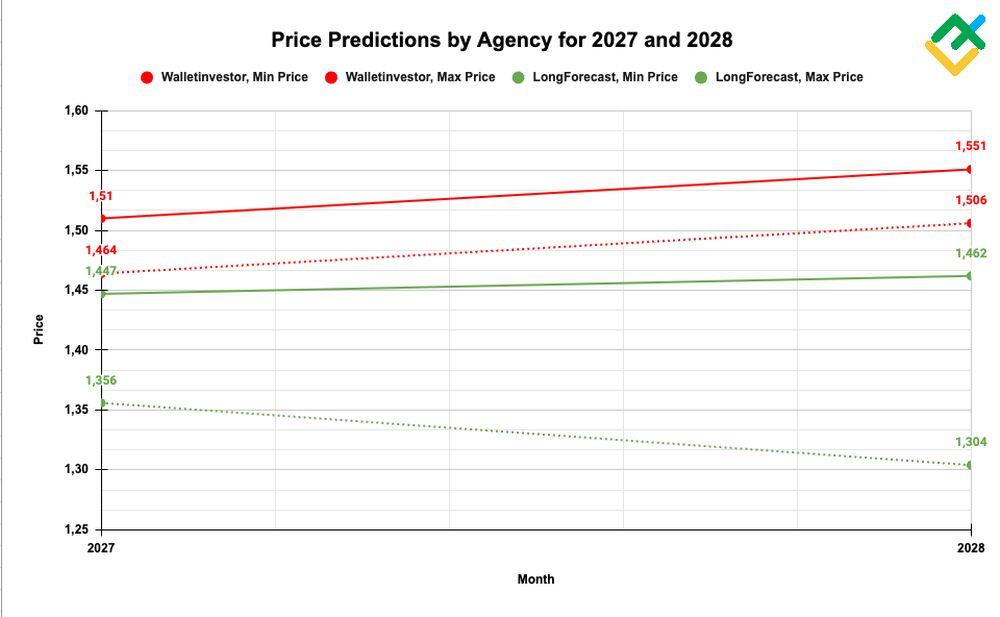
According to Walletinvestor‘s analysts, the USDCAD pair will trade between 1.4640-1.5100 in 2027, closing the year at 1.5070.
In 2028, experts expect a moderate continuation of the upward trend, up to 1.5480 by the end of December.
Then, the USDCAD rate may hit 1.5660 by late September 2029.
|
Date |
Opening price, CA$ |
Closing price, CA$ |
Minimum price, CA$ |
Maximum price, CA$ |
|
2027 |
||||
|
January |
1.4650 |
1.4740 |
1.4640 |
1.4740 |
|
February |
1.4740 |
1.4780 |
1.4730 |
1.4780 |
|
March |
1.4780 |
1.4790 |
1.4780 |
1.4840 |
|
April |
1.4780 |
1.4740 |
1.4730 |
1.4790 |
|
May |
1.4740 |
1.4740 |
1.4730 |
1.4760 |
|
June |
1.4740 |
1.4770 |
1.4720 |
1.4770 |
|
July |
1.4770 |
1.4720 |
1.4710 |
1.4770 |
|
August |
1.4720 |
1.4780 |
1.4720 |
1.4800 |
|
September |
1.4780 |
1.4860 |
1.4770 |
1.4860 |
|
October |
1.4870 |
1.4990 |
1.4870 |
1.4990 |
|
November |
1.4990 |
1.5060 |
1.4990 |
1.5060 |
|
December |
1.5060 |
1.5070 |
1.5060 |
1.5100 |
|
2028 |
||||
|
January |
1.5070 |
1.5160 |
1.5060 |
1.5160 |
|
February |
1.5160 |
1.5200 |
1.5150 |
1.5200 |
|
March |
1.5200 |
1.5210 |
1.5200 |
1.5260 |
|
April |
1.5210 |
1.5150 |
1.5150 |
1.5210 |
|
May |
1.5150 |
1.5160 |
1.5150 |
1.5180 |
|
June |
1.5150 |
1.5190 |
1.5140 |
1.5190 |
|
July |
1.5190 |
1.5140 |
1.5120 |
1.5190 |
|
August |
1.5140 |
1.5190 |
1.5140 |
1.5220 |
|
September |
1.5200 |
1.5290 |
1.5180 |
1.5290 |
|
October |
1.5290 |
1.5410 |
1.5290 |
1.5410 |
|
November |
1.5410 |
1.5480 |
1.5410 |
1.5480 |
|
December |
1.5490 |
1.5480 |
1.5480 |
1.5510 |
|
2029 |
||||
|
January |
1.5480 |
1.5570 |
1.5480 |
1.5570 |
|
February |
1.5570 |
1.5610 |
1.5560 |
1.5610 |
|
March |
1.5610 |
1.5630 |
1.5610 |
1.5680 |
|
April |
1.5620 |
1.5570 |
1.5560 |
1.5620 |
|
May |
1.5570 |
1.5580 |
1.5570 |
1.5590 |
|
June |
1.5580 |
1.5610 |
1.5560 |
1.5610 |
|
July |
1.5610 |
1.5560 |
1.5540 |
1.5610 |
|
August |
1.5560 |
1.5620 |
1.5560 |
1.5640 |
|
September |
1.5610 |
1.5660 |
1.5600 |
1.5660 |
Longforecast
According to Longforecast, the price will fluctuate between 1.3560 and 1.4470 throughout 2027, hitting 1.4220 in December.
The upward trend is expected to continue at the beginning of the first quarter of 2029, with quotes potentially reaching 1.4620 by the end of January. However, the price will decline, dropping to 1.3530 by the end of October, with the lowest price anticipated in August at around 1.3040.
|
Month |
Opening price, CA$ |
Low/ High, CA$ |
Closing price, CA$ |
|
2027 |
|||
|
January |
1.3750 |
1.3700-1.4120 |
1.3910 |
|
February |
1.3910 |
1.3560-1.3980 |
1.3770 |
|
March |
1.3770 |
1.3770-1.4370 |
1.4160 |
|
April |
1.4160 |
1.3760-1.4180 |
1.3970 |
|
May |
1.3970 |
1.3720-1.4140 |
1.3930 |
|
June |
1.3930 |
1.3800-1.4220 |
1.4010 |
|
July |
1.4010 |
1.3630-1.4050 |
1.3840 |
|
August |
1.3840 |
1.3840-1.4470 |
1.4260 |
|
September |
1.4260 |
1.3710-1.4260 |
1.3920 |
|
October |
1.3920 |
1.3770-1.4190 |
1.3980 |
|
November |
1.3980 |
1.3940-1.4360 |
1.4150 |
|
December |
1.4150 |
1.4010-1.4430 |
1.4220 |
|
2028 |
|||
|
January |
1.4220 |
1.4010-1.4430 |
1.4620 |
|
February |
1.4620 |
1.4140-1.4620 |
1.4360 |
|
March |
1.4360 |
1.3830-1.4360 |
1.4040 |
|
April |
1.4040 |
1.3640-1.4060 |
1.3850 |
|
May |
1.3850 |
1.3580-1.4000 |
1.3790 |
|
June |
1.3790 |
1.3650-1.4070 |
1.3860 |
|
July |
1.3860 |
1.3370-1.3860 |
1.3570 |
|
August |
1.3570 |
1.3040-1.3570 |
1.3240 |
|
September |
1.3240 |
1.3050-1.3450 |
1.3250 |
|
October |
1.3250 |
1.3250-1.3730 |
1.3530 |
Which Factors Impact USD CAD Forecast?
Several factors influence the exchange rate between two dollars, among which are:
-
Interest Rates: Higher interest rates offer lenders in an economy a higher return than other countries, attracting foreign capital and causing the exchange rate to rise.
-
Economic Indicators: Gross Domestic Product (GDP) growth rates, unemployment rates, and other significant economic reports that impact the economic outlook and, consequently, currency strength.
-
Commodity Prices: Given Canada’s significant export of commodities like oil, potash, and zinc, these prices can significantly affect the CAD’s value of the CAD.
-
Political Stability and Economic Performance: Political events, stability, and performance in both countries can affect investor confidence and influence currency strength.
-
Inflation Rates: Generally, a country with a consistently lower inflation rate exhibits a rising currency value as its purchasing power increases relative to other currencies.
-
Public Debt: Countries with large public debts are less attractive to foreign investors due to inflation and default risk. This can lead to a decrease in currency value.
Is USD/CAD Still a Good Investment?
The answer will depend on your risk appetite, ability to track global trends, and investment and trading goals.
Leading financial analysts disagree on a forecast for the USDCAD’s future as the exchange rate is highly dependent on various economic, geopolitical, and domestic factors in the United States and Canada.
Investments always pose a risk. Therefore, making trading decisions for USDCAD requires flexibility and a deep analysis of all factors that can directly or indirectly affect the pair’s exchange rate. In addition, it is important to conduct technical analysis as it can help you better understand the psychology of the market, make a more accurate forecast, and, accordingly, open a more profitable position.
In this regard, diversifying your investment portfolio and tracking all economic trends worldwide is a valuable strategy if you plan to trade the USDCAD pair.
USD CAD Forecast FAQ
The current price that Canadian Dollar is trading at is around 1.34732 per US Dollar as of today 02.10.2024.
The forecasts for the future USDCAD exchange rate are mixed. Some experts expect the pair to decline to 1.3145-1.3350, while others predict a rise to 1.3600-1.3810.
This decision largely depends on fundamental factors. The bearish sentiment prevails in the market, with many experts recommending selling the pair. The technical outlook also suggests a continued downtrend over the next few months.
We can’t exclude this chance. Currently, market sentiment is bearish, and most technical indicators and candlestick patterns point to a decline in the USDCAD rate through the end of 2024, potentially to 1.3145-1.3350.
The USDCAD currency pair is most sensitive to commodity prices, interest rate changes, geopolitical factors, and economic data from the US and Canada.
Currently, inflation in the US is decreasing, leading the Federal Reserve to cut the interest rate by 50 basis points at its latest meeting. This decision directly impacts USDCAD movements. GDP data and oil price fluctuations could also influence the pair’s value.
The USDCAD pair’s decline is due to the Federal Reserve’s decision to lower the interest rate by 50 basis points. This has allowed the Canadian dollar to strengthen against the US dollar. Moreover, the currency is sensitive to various macroeconomic indicators, changes in commodity prices, and shifting market sentiment.
Price chart of USDCAD in real time mode

The content of this article reflects the author’s opinion and does not necessarily reflect the official position of LiteFinance. The material published on this page is provided for informational purposes only and should not be considered as the provision of investment advice for the purposes of Directive 2004/39/EC.
{{value}} ( {{count}} {{title}} )
This post is originally published on LITEFINANCE.


