
The article covers the following subjects:
Key takeaways
- Main scenario: consider short positions from a correction below the level of 2370.00 with a target of 2218.46 – 2161.56. A sell signal: after the level of 2370.00 is broken. Stop Loss: 2450.00, Take Profit: 2161.56.
- Alternative scenario: breakout and consolidation above the level of 2370.00 will allow the pair to continue rising to the levels of 2500.00 – 2560.00. A buy signal: after the level of 2370.00 is broken. Stop Loss: 2300.00, Take Profit: 2560.00.
Main scenario
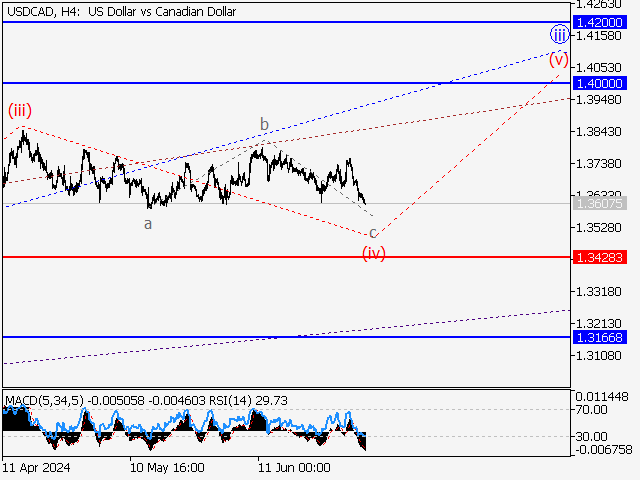
Consider long positions above the level of 1.3428 with a target of 1.4000 – 1.4200 once a correction is formed.
Alternative scenario
Breakout and consolidation below the level of 1.3428 will allow the pair to continue declining to the levels of 1.3166 – 1.2735.
Analysis
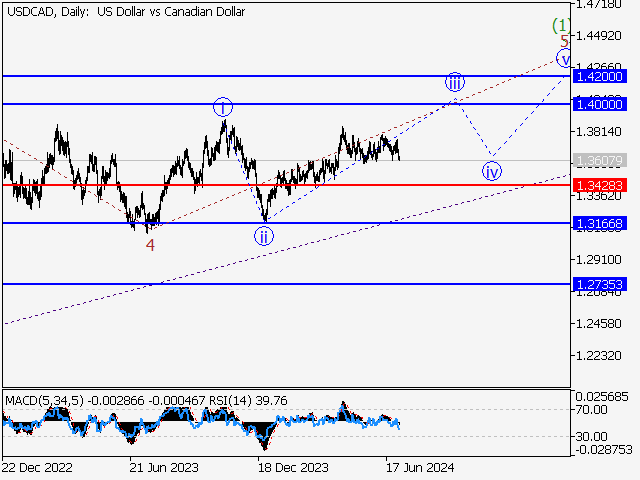
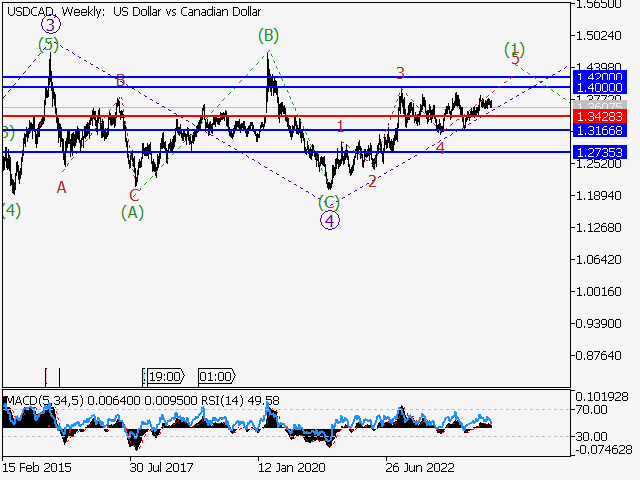
The fifth wave of larger degree 5 presumably continues developing on the weekly chart, with wave (1) of 5 forming as its part. On the daily chart, wave 5 of (1) is developing, with wave iii of 5 forming inside. A local correction appears to be unfolding on the H4 time frame as the fourth wave of smaller degree (iv) of iii. If the presumption is correct, the USD/CAD pair will continue to rise to the levels of 1.4000 – 1.4200 after the correction ends. The level of 1.3428 is critical in this scenario as its breakout will allow the pair to continue declining to the levels of 1.3166 – 1.2735.
Price chart of USDCAD in real time mode

The content of this article reflects the author’s opinion and does not necessarily reflect the official position of LiteFinance. The material published on this page is provided for informational purposes only and should not be considered as the provision of investment advice for the purposes of Directive 2004/39/EC.
{{value}} ( {{count}} {{title}} )
This post is originally published on LITEFINANCE.