The article covers the following subjects:
Highlights and key points
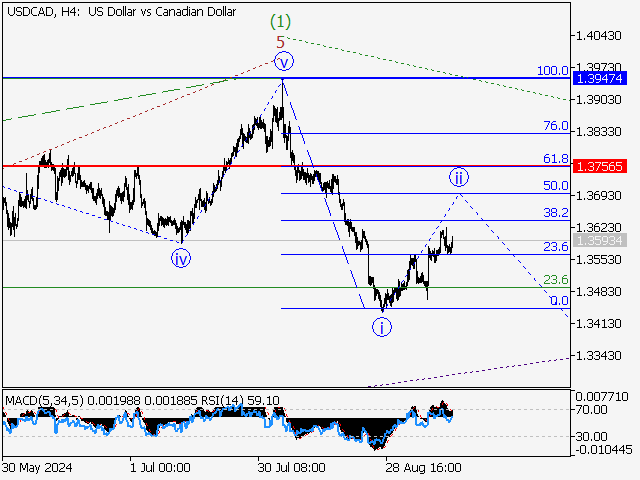
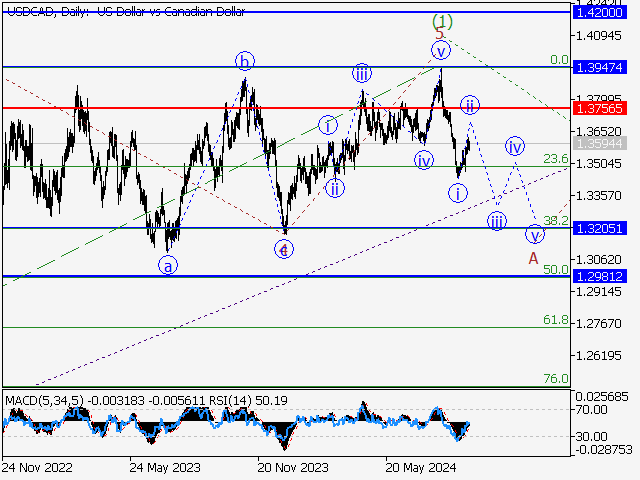
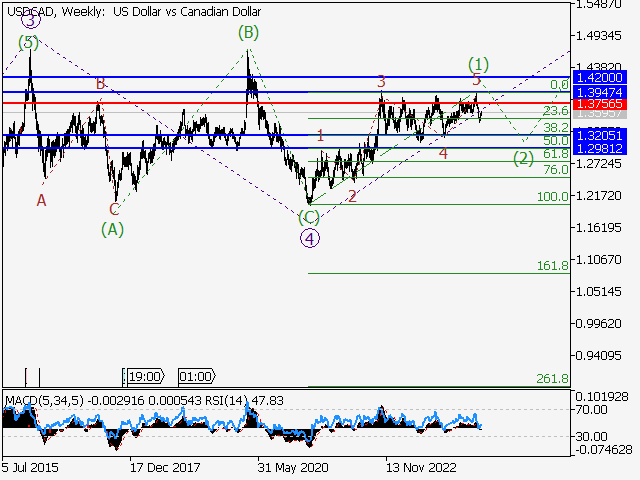
- Main scenario: once a correction forms, consider short positions below the level of 1.3756 with a bearish target of 1.3205 – 1.2981. A sell signal: if the price holds below 1.3756. Stop Loss: above 1.3840, Take Profit: 1.3205 – 1.2981.
- Alternative scenario: breakout and consolidation above the level of 1.3756 will allow the pair to continue rising to the levels of 1.3947 – 1.4200. A buy signal: once the level of 1.3756 is broken to the upside. Stop Loss: below 1.3700, Take Profit: 1.3947 – 1.4200.
Main scenario
Consider short positions below the level of 1.3756 with a target of 1.3205 – 1.2981 once the correction is completed.
Alternative scenario
Breakout and consolidation above the level of 1.3756 will allow the pair to continue rising to the levels of 1.3947 – 1.4200.
Analysis
The fifth wave of larger degree 5 presumably continues developing on the weekly chart, with wave (1) of 5 formed as its part. The fifth wave of smaller degree 5 of (1) is completed on the daily time frame, and a bearish correction is developing as the second wave (2) of 5. Wave А of (2) appears to continue forming on the H4 time frame, with wave i of A formed and a local corrective wave ii of A unfolding as its parts. If this assumption is correct, the USDCAD pair will continue to fall to 1.3205 – 1.2981 after the local correction comes to an end. The level of 1.3756 is critical in this scenario as a breakout will enable the pair to continue rising to the levels of 1.3947 – 1.4200.
Price chart of USDCAD in real time mode
The content of this article reflects the author’s opinion and does not necessarily reflect the official position of LiteFinance. The material published on this page is provided for informational purposes only and should not be considered as the provision of investment advice for the purposes of Directive 2004/39/EC.
{{value}} ( {{count}} {{title}} )
This post is originally published on LITEFINANCE.


