
In recent years, the US stock indices have dominated, but in 2025, it is Europe’s turn to shine, as capital is flowing from the US to the EU. Let’s discuss this topic and make a trading plan for the S&P 500 index.
The article covers the following subjects:
Major Takeaways
- Donald Trump believes that tariffs are favorable for the S&P 500 index.
- The US share of the global stock market is shrinking.
- Greed is driving the stock market.
- Short positions can be considered if the S&P 500 index drops below $6,205.
Weekly Fundamental Forecast for S&P 500
The US economy will unlikely strengthen. Corporate profits in the second quarter are expected to grow at their slowest pace since mid-2023. The Fed may not reduce the federal funds rate in 2025. These factors can be regarded as a headwind for the S&P 500 index. However, the broad stock index has surged by 29% from its April low, setting new records and surpassing 6,300 for the first time in history. Notably, the market is exhibiting a high degree of unusual activity in 2025. For instance, the pharmaceutical index surged in response to President Trump’s threat to impose 200% tariffs on imported drugs.
S&P 500 Companies’ EPS YoY

Source: Bloomberg.
The US administration’s position on tariffs may have merit: Does the market truly favor tariffs? Despite the absence of the promised 90 trade deals during the 90-day delay, the US Treasury collected $27 billion in customs revenues in June alone, notching a $20 billion increase compared to the previous year. In the past, a 10% tariff appeared quite substantial. However, it is now a target that most countries aspire to achieve. Access to the US economy, as Donald Trump refers to it, requires paying for it. However, as the saying goes, “He who pays the piper calls the tune.”
Over the past few decades, the United States has been the primary contributor to the deficit, as the country has bought more than it has sold. The difference was reinvested in the United States through purchases of American securities. It is not surprising that their share in the global stock market has grown steadily. In 2025, Europe will bear the financial burden. For instance, the provision of weapons to Ukraine. As a result, European stock indices are performing better than their US counterparts.
US and EU Stock Markets’ Relative Weights

Source: Bloomberg.
The primary factor contributing to the rally in the S&P 500 index is likely attributable to a sense of greed among investors. Investors place a higher value on abbreviations than on statistics and monetary policy. The TACO trade, or “Trump Always Chickens Out,” and FOMO, or “fear of missing out,” are driving investors to purchase the broad stock index on drawdowns. In July, there was a perception that TINA, “There Is No Alternative,” was resurging, implying that US stocks were the only viable investment option.
S&P 500 Index Performance and VIX Index
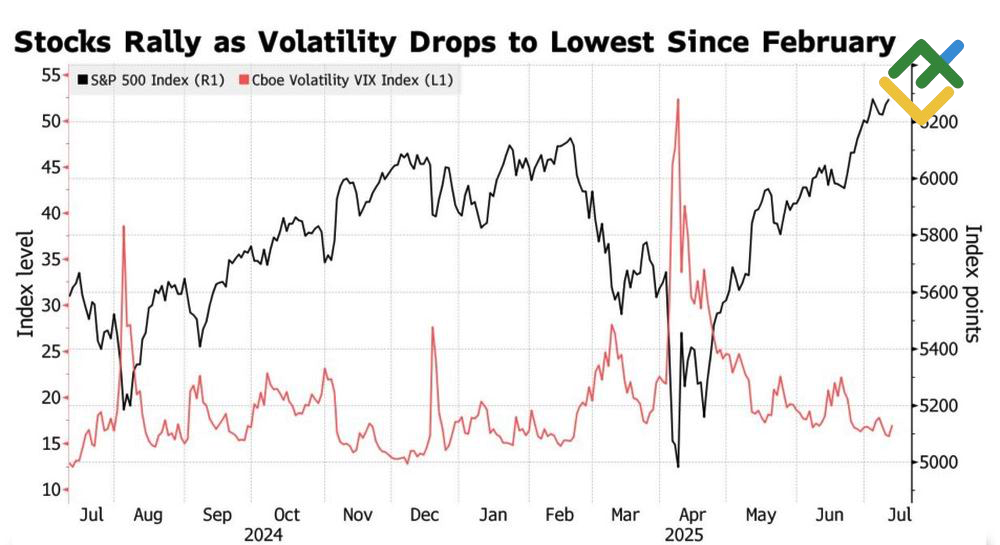
Source: Bloomberg.
However, as always, the devil is in the details. The seemingly sophisticated terminology merely obscures the underlying reality: a speculative bubble. Wall Street Journal experts project that US GDP growth will reach 1% in 2025, which is half of the initial estimate made at the beginning of the year. According to their estimates, Donald Trump’s proposed tax cuts will add 0.2–0.3% to economic growth in the current and next years. However, these gains may be counterbalanced by increased deportations and reduced migration.
Weekly Trading Plan for S&P 500
The reality may be even more concerning. UBS forecasts that, owing to the US administration’s tariffs, US inflation will not revert to April’s 2.3% until the end of 2027. If that is the case, it raises questions about the rationale behind the Fed’s decision to reduce interest rates. Maintaining them in 2025, along with the potential for stagflation in the US, could heighten the risk of a pullback in the S&P 500 index. Therefore, a decline below the support level of $6,205 may trigger a sell-off.
This forecast is based on the analysis of fundamental factors, including official statements from financial institutions and regulators, various geopolitical and economic developments, and statistical data. Historical market data are also considered.
Price chart of EURUSD in real time mode

The content of this article reflects the author’s opinion and does not necessarily reflect the official position of LiteFinance broker. The material published on this page is provided for informational purposes only and should not be considered as the provision of investment advice for the purposes of Directive 2014/65/EU.
According to copyright law, this article is considered intellectual property, which includes a prohibition on copying and distributing it without consent.
{{value}} ( {{count}} {{title}} )
This post is originally published on LITEFINANCE.


