
The recent shift in investor sentiment away from the Trump trade has brought data-dependent Federal Reserve policy back into focus. Should a rate cut be implemented in July if there are concerns that the US economy is decelerating excessively? Let’s discuss this topic and make a trading plan for the EURUSD pair.
The article covers the following subjects:
Highlights and key points
- The waning appeal of the Trump trade is allowing the EURUSD pair to rebound.
- Recession rumors are hurting the US dollar.
- Declining stock indices buoy the greenback.
- The EURUSD pair risks consolidating in the 1.08-1.095 range.
Weekly US dollar fundamental forecast
The EURUSD rate rebounded from the support level of 1.825-1.0835 following Kamala Harris’ “Honeymoon” and speculation that the US economy is decelerating at a faster rate than anticipated. However, the positive results of the US PMIs and the decline in stock indices allowed bears to regain the upper hand. Investors are attempting to ascertain whether to abandon the Trump trade in light of concerns about an impending recession and the awaited release of second-quarter GDP data.
Kamala Harris is not as vulnerable as Joe Biden. Recent polls have shown a narrowing gap between the Republican and Democratic candidates. A Reuters/Ipsos poll placed the vice president in the lead, with Donald Trump trailing by two percentage points. If the Democratic Party retains the White House, there will be no political pressure on the Federal Reserve to cut interest rates. This will create a favorable environment for the EURUSD pair.
Former New York Fed Governor William Dudley anticipates that the Federal Reserve will begin to expand its monetary policy in July. Lower interest rates may help prevent a recession if it is not too late. The recovery in the yield curve suggests that a recession is imminent. The rise in the differential indicates that markets demand that the Fed adopt a more accommodative monetary policy.
US yield curve
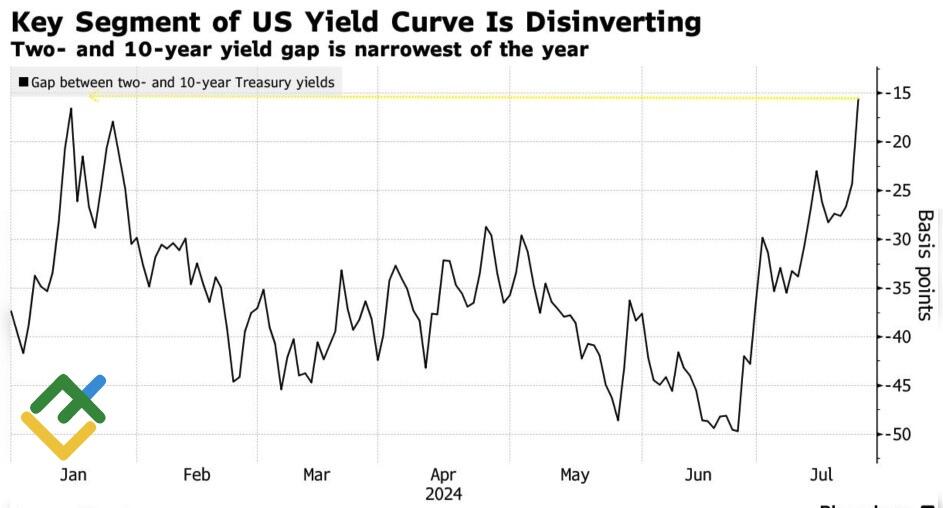
Source: Bloomberg.
The retreat of the Trump trade, rumors of an approaching recession, and the Fed’s calls for rate cuts brought back 100% confidence to the derivatives market regarding the start of monetary expansion in September and allowed the major currency pair to gain ground even amid disappointing European business activity statistics. It was a cold shower for supporters of a quick economic recovery in the currency bloc.
In contrast to the performance of the Old World, the New World is experiencing a period of robust growth. The composite index of purchasing managers reached its highest level since April 2022. When considered alongside the anticipated acceleration of GDP to 2% in the second quarter, as forecast by Bloomberg experts, this raises questions about the necessity of the Fed’s aggressive monetary expansion and provides support to EURUSD bears. Furthermore, the decline in US stock indices has spurred demand for the US dollar as a safe haven.
US business activity
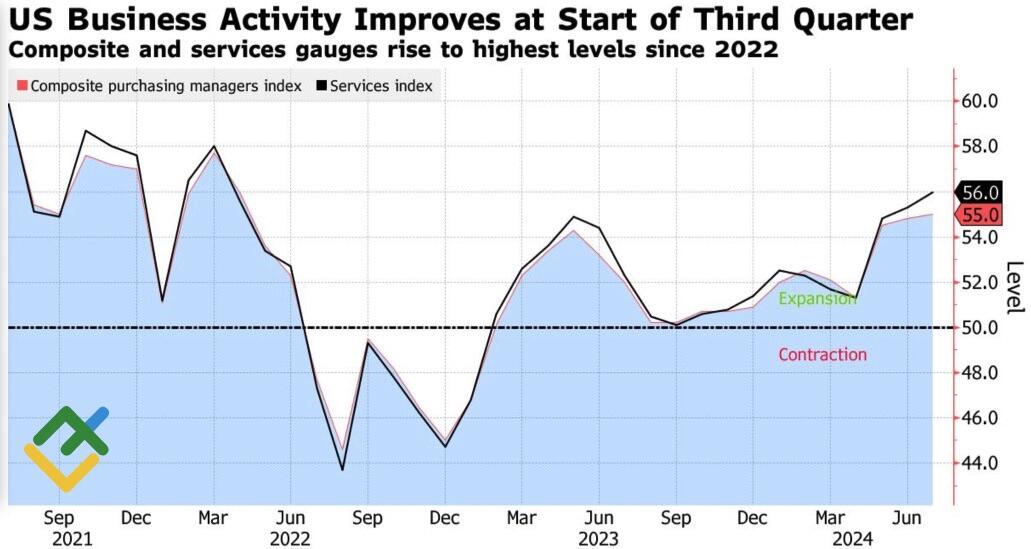
Source: Bloomberg.
Tesla and Alphabet sagged due to disappointing corporate reports, dragging the Magnificent seven stocks down. The companies lost a combined $768 billion in market value. Against this backdrop, the S&P 500 index broke a 356-day streak without a drop of 2% or more, marking its worst daily performance since December 2022.
Weekly EURUSD trading plan
The positioning of candidates in the US presidential race has investors focusing on the data-driven Fed monetary policy. While there are downside risks for the EURUSD pair, the potential for a pullback appears limited. The pair may start to trade within a consolidation range of 1.08-1.095. At the same time, the pair’s return above 1.0865 will allow traders to open long trades, adding them to the ones initiated in the area of 1.0825-1.0835.
Price chart of EURUSD in real time mode

The content of this article reflects the author’s opinion and does not necessarily reflect the official position of LiteFinance. The material published on this page is provided for informational purposes only and should not be considered as the provision of investment advice for the purposes of Directive 2004/39/EC.
{{value}} ( {{count}} {{title}} )
This post is originally published on LITEFINANCE.