
In Forex trading, technical analysis often involves identifying recurring patterns on price charts. Among the numerous tools traders employ, candlestick patterns stand out as some of the most popular. Although there is a wide variety of candlestick formations, only a few of them are considered truly reliable.
One such rare but effective formation is a Tweezer pattern. This pattern works best on higher time frames, offering potential profits of up to 10% of a trader’s deposit. This article explains how to use a Tweezer pattern effectively in trading.
The article covers the following subjects:
Major Takeaways
|
What is a Tweezer pattern? |
A Tweezer is a candlestick pattern that appears on price charts after a prolonged upward or downward trend. The pattern indicates a change in market sentiment and signals a trend reversal. |
|
What is the difference between Tweezer Tops and Tweezer Bottoms? |
A Tweezer Top or a Bearish Tweezer occurs after an uptrend at market highs, while a Tweezer Bottom or a Bullish Tweezer appears at market lows after a decline. |
|
How does the pattern affect the market? |
A Tweezer formation is a reversal pattern that emerges at the end of a prevailing trend and signals a shift in market conditions. |
|
How does the pattern work? |
A trader should place a pending order to open a short or long position at a low or high of the last candlestick of the pattern, depending on the trend direction. |
|
How to identify the pattern on a chart? |
The pattern consists of two consecutive candlesticks with small bodies and ideally long shadows. The pattern forms at key support/resistance levels. |
|
Pattern features |
Although relatively rare, a Tweezer pattern is fairly easy to identify on a price chart. Nowadays, the pattern is often observed in stock and commodity markets. |
|
Advantages of a Tweezer pattern |
This pattern is simple and easy to grasp, making it applicable across various time frames. Additionally, it can serve as a reliable signal to close trades. |
|
Disadvantages of a Tweezer pattern |
The pattern rarely appears on charts and is very easy to confuse with other formations. There are often no clear profit-taking levels. Profit targets are not always well-defined, and traders typically enter positions at the market price. |
|
Suitable time frames |
Although the pattern works on any time frame, its signals are more reliable on higher ones. |
What Are Tweezer Tops and Tweezer Bottoms?
A Tweezer pattern is a reversal candlestick pattern and is considered one of the earliest candlestick patterns traders adopted to monitor trends.
A Tweezer pattern comprises two successive candlesticks with small bodies and long shadows or wicks, positioned at the same level. The candlesticks typically have different colors, with their opening and closing prices being the same.
A Tweezer is a type of candlestick pattern that shows the strength of a market signal. The longer the candlestick shadows, the stronger the signal of a potential market reversal. Conversely, the shorter shadows suggest a weaker signal.
The strongest reversal signal is characterized by very small candlesticks with shadows that are at least three times longer than the bodies. Tweezer Top and Bottom candlesticks also indicate potential reversals and give buy or sell signals. A buy signal occurs when the Tweezer is at the bottom of a trend, while a sell signal arises when it appears at the top.
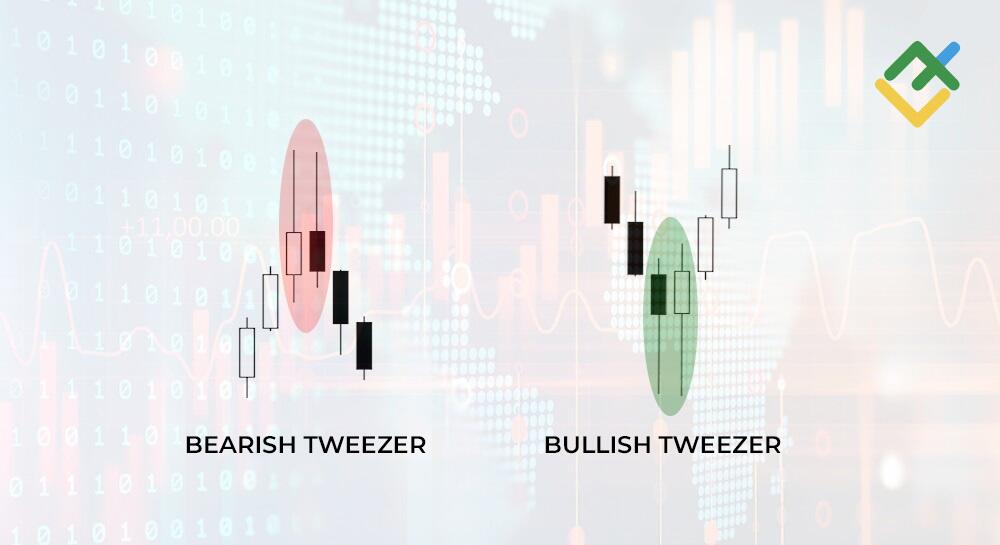
When Does the Bearish Tweezer Top and the Bullish Tweezer Bottom Show?
A Bearish Tweezer reversal pattern occurs at the top of a trend and looks like a Double Top pattern on a lower time frame. A bearish Tweezer pattern, also known as a Tweezer Top, means that bulls are still pushing the price higher, forming a swing high. Afterward, traders lock in part of their profits, prompting the price to retreat and form the first candlestick with a long shadow. The next candlestick of a Tweezer Top signals a bearish trend reversal. Bulls initiate additional trades, hoping to continue the upward movement, but fail to maintain their gains.
After that, bears drag the price lower again, forming a second shadow and a resistance level. As a result, selling pressure outweighs bullish momentum, completely reversing the trend.
A Bullish Tweezer reversal pattern forms at the end of a downtrend and often resembles a Double Bottom on lower timeframes. Also known as a Tweezer Bottom candlestick pattern, this formation indicates that bears are still exerting downward pressure, setting a new swing low. However, as traders begin to lock in profits from their short positions, the price rebounds. The first candlestick with a long shadow forms, followed by a second candlestick that confirms the bullish reversal.
Bears, anticipating a price drop, initiate short trades but fail to break through the low. Meanwhile, bulls rally and push the price back up, creating a second shadow and establishing a support level. Consequently, buyers overpower sellers, leading to an upward trend reversal.
Identifying Tweezer Tops and Bottoms on Charts
To accurately identify a Tweezer on a price chart, it is essential to understand that the pattern comprises three key stages.
- First candlestick formation. Initially, the first bullish candlestick appears on a chart. It should have a small body and a long shadow, at least twice the length of the body.
- Second candlestick formation. The second candlestick of the pattern is almost identical to the first one. Its highs and lows, as well as its body, are approximately the same as those of the first candlestick.
- Reversal. Once the second candlestick closes, a rapid trend reversal usually occurs. Traders usually place a market order to enter a position during the opening of the first candlestick following a Tweezer pattern, which reflects a change in market sentiment.

If you want to enhance your chart analysis skills, you can use a candlestick patterns cheat sheet, which can help you recognize various patterns and start trading effectively.
How to Trade with Tweezer Patterns
Let’s find out how to identify a Tweezer pattern and use its signals in Forex trading.

The 4-hour GBPUSD chart above shows three Tweezer patterns that formed within a couple of weeks.
Opening a short trade.
- The first Tweezer appeared at the top of the market, and the price fell sharply.
- It is better to set a sell order during the formation of the first candlestick after the pattern. On the chart above, it is black and opened with a gap.
- A stop-loss order is usually placed at the level of the longest shadow of the pattern or slightly above it.
- Setting a take-profit order is not as easy. A common approach is to set the target at a distance equal to the combined length of the body and shadow of the last candlestick in the pattern. However, this distance is often too small to generate significant profit. An alternative strategy is to use a trailing stop, which allows traders to profit from a strong price movement.
Opening a long trade.
- Now let’s examine the second Tweezer pattern, which formed at a swing low. The formation of this pattern signals a potential bullish reversal.
- Place a buy order at the opening level of the first candlestick after the pattern.
- A stop-loss order is usually set at the level of the longest shadow of the pattern or slightly below it.
- The profit target is determined in the same way as for short trades. If you use a traditional take-profit order, the target will be set at a distance approximately equal to the size of the entire bullish candlestick at which the trade was opened. However, a trailing stop can help you capture larger profits.
A Tweezer pattern is considered one of the most reliable candlestick signals and typically does not require additional confirmation, making it popular among Price Action traders. However, in modern trading practice, many traders tend to interpret it as a standard Engulfing pattern. In such cases, confirmation becomes necessary, as false signals are quite common.
The most effective tools for confirming signals are oscillators, such as the MACD, Awesome Oscillator, and the RSI. Classic trend indicators, such as Moving Averages or the Alligator indicator, are not as effective in confirming reversals. These technical indicators lag behind, often confirming a signal only after the third candlestick has closed. This delay can cause traders to miss out on significant profits.
Benefits and Disadvantages of Using Tweezer Top and Bottom Patterns
Although a Tweezer pattern is a highly reliable formation, like any other pattern, it has several limitations that should be considered when trading.
|
Benefits |
Disadvantages |
|
The pattern provides highly reliable signals, with a success rate of over 84%. |
In its classic and most reliable form, this pattern is quite rare, sometimes occurring only once a month for a single currency pair. |
|
The pattern can appear on any time frame. However, it is advisable to use an hourly or higher time frame for greater reliability. |
There are numerous interpretations of this pattern in modern candlestick analysis, many of which lack a solid foundation. Therefore, it is advisable to rely solely on the classic type of this pattern when trading. |
|
Since trading this pattern often involves opening positions at the market price, it is reasonable to set a trailing stop and adjust a stop-loss order to the breakeven point. This way, you can capture larger profits while managing risk. |
It is crucial to enter the market immediately after the pattern forms, which makes the use of pending orders impractical. Consequently, it is almost impossible to automate trading when using this pattern. |
|
The pattern consists of only two candlesticks, which means it does not take long to unfold. |
|
|
The pattern swiftly initiates the anticipated price reversal, with the profit target often reached on the very next candlestick. |
Tweezer Candles vs Other Reversal Patterns
Being a classic reversal formation, Tweezers may encompass other smaller reversal patterns, typically single candlesticks, that reinforce its signal.
Tweezers vs Hammer
A Tweezer pattern closely resembles a Hammer pattern. The main difference is that a Hammer consists of one candlestick, while a Tweezer consists of two. When two consecutive Hammers appear, they form an ideal Tweezer pattern.
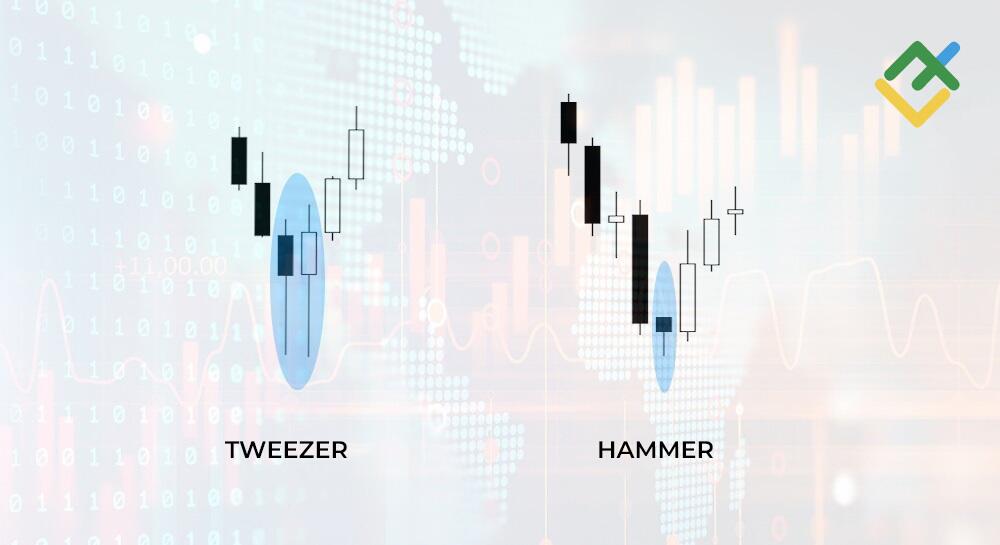
This occurs because both patterns arise from the same market conditions. In each case, buyers and sellers engage in a battle, and eventually, one side prevails.
Traders often spot a Hammer pattern on the chart and enter the market based on its signal. When a second candlestick forms a Tweezer pattern, it serves as additional confirmation of the trend reversal, giving traders a profitable opportunity to increase the volume of their position.
Tweezers vs Shooting Star
A Shooting Star consists of a single candlestick and is the opposite of a Hammer pattern. A Shooting Star pattern appears in a bullish market.
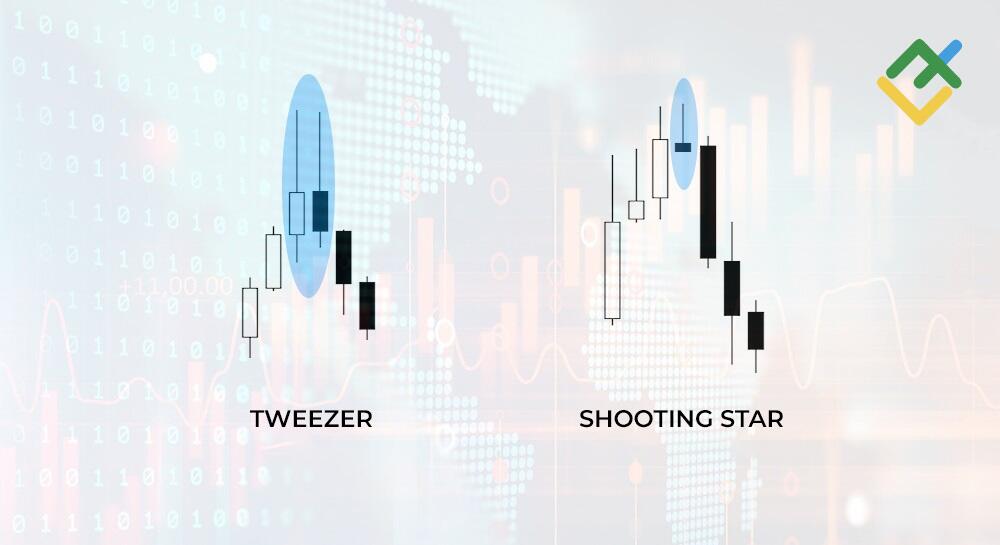
Two consecutive Shooting Star patterns form a Bearish Tweezer pattern. The approach to placing pending orders remains the same as for a Tweezer pattern.
Similar to trading a Hammer pattern, traders enter the market right after a Shooting Star emerges. If a Tweezer pattern appears afterward, it serves as additional confirmation and provides an opportunity to add to the existing position.
Tweezers vs Engulfing Patterns
Essentially, a Tweezer pattern in technical analysis is the initial form of a classic Engulfing pattern. That is why, traders sometimes mistake it for other patterns, such as Bullish Engulfing or Harami.
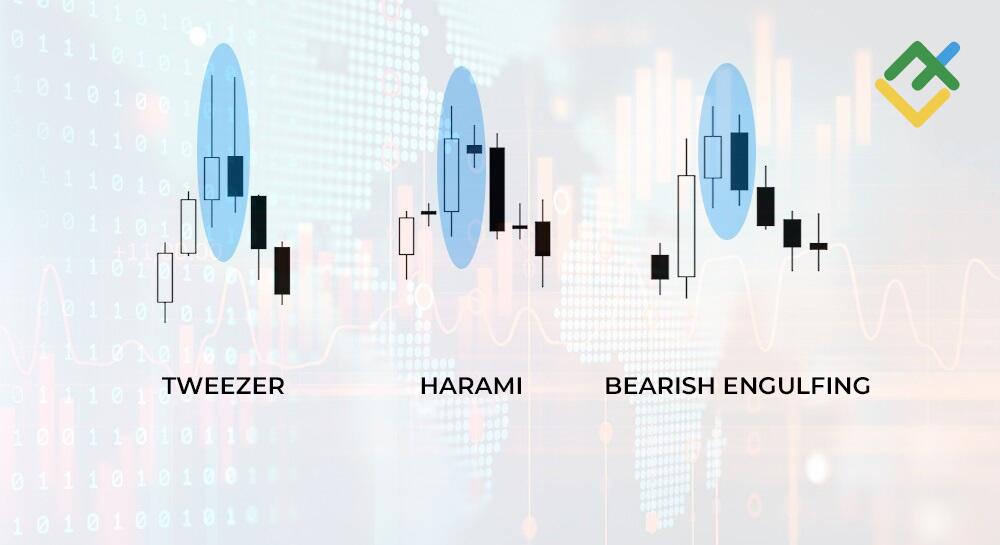
All these patterns share a similar structure and are made up of two candlesticks. The logic behind the price movement is the same for both the Engulfing and Tweezer patterns: sellers overpower buyers in bearish setups, while buyers absorb selling pressure in bullish ones. The only exception is a Harami pattern, which works differently but is also considered a strong bullish or bearish reversal signal.
Conclusion
Trading with such technical analysis tools as candlestick patterns is particularly popular among traders with limited capital since candlestick patterns are easy to recognize on charts and are relatively reliable.
Although a Tweezer candlestick pattern is pretty rare, once you learn how to spot it, you can get a strong reversal signal. Moreover, to make your trading strategy even more effective, stick to the basics of effective trading and follow a few simple rules.
Only trade patterns that appear on higher time frames. Tweezers give the most reliable signals on a 4-hour and daily chart. When opening a position, be sure to set a stop loss and take profit. Once the price approaches the take-profit level, replace this order with a trailing stop. This approach will help you maximize your profits.
Tweezer Top & Bottom FAQ
A Tweezer Bottom or Bullish Tweezer is a pattern that occurs at market lows after uptrends. Its formation signals a change from a downtrend to an uptrend. Unlike the bullish Tweezer Bottom, a Tweezer Top or Bearish Tweezer appears at resistance levels after downtrends and signals a shift from an uptrend to a downtrend.
A Tweezer Bottom is a classic bullish reversal pattern that appears only at market lows, near the support level. The appearance of this pattern usually leads to a shift in the market sentiment.
To identify a Tweezer Top bearish reversal pattern on a chart, you need to wait for two consecutive candlesticks with approximately equal bodies and upper shadows that are at least twice as long as the bodies. The highs of these candlesticks will be at the same level.
A Tweezer Top pattern signals that there is insufficient buying momentum in the market to sustain further gains, and sellers are beginning to take control. As a result, a Tweezer Top pattern forms, and the uptrend turns into a downtrend.
The Tweezer Top Rule suggests that the formation of two consecutive candlesticks with almost identical highs indicates that buyers are struggling to keep the price above a specific level. Consequently, a bearish movement starts.
The Tweezer Bottom rule states that after two consecutive candlesticks with almost identical lows, the asset price starts to climb. The pattern indicates that sellers are unable to drag the price lower, which results in a bullish trend reversal.
The opposite of a Tweezer Top candlestick pattern is a Tweezer Bottom pattern. These two similar patterns usually appear at the end of a strong trend. A Tweezer Top signals a reversal to the downside, while a Tweezer Bottom indicates a bullish reversal.
There are many variations of a Tweezer pattern, and modern traders often use the term Tweezer to refer to a regular Engulfing pattern. However, a classic pattern with long and almost identical candlestick shadows gives the most reliable signal.

The content of this article reflects the author’s opinion and does not necessarily reflect the official position of LiteFinance broker. The material published on this page is provided for informational purposes only and should not be considered as the provision of investment advice for the purposes of Directive 2014/65/EU.
According to copyright law, this article is considered intellectual property, which includes a prohibition on copying and distributing it without consent.
{{value}} ( {{count}} {{title}} )
This post is originally published on LITEFINANCE.


