The TRX (Tron) cryptocurrency, launched in 2017, has rapidly established itself as a leading blockchain platform for decentralized applications (dApps) and digital content. Its emphasis on high bandwidth, low fees, and smart contract support makes it appealing to both developers and users. With ongoing ecosystem development, including the integration of stablecoins and NFTs, TRX maintains a strong position in the crypto industry.
However, Tron’s future depends on demand trends, crypto market regulation, and competition with other blockchain platforms. This article reviews the current advances of TRX, its role in the ecosystem, and the token’s long-term prospects.
The article covers the following subjects:
Major Takeaways
- The current TRX price is $0.26780 as of 18.06.2025.
- The highest TRX price of $0.44935 was reached on 04.12.2024, while the all-time low of $0.001804 was recorded on 12.11.2017.
- According to forecasts, TRX is expected to trade within the range of $0.20–$0.65 in 2025. The average price is expected to range from $0.73 to $1.23 by 2030. However, some analysts expect a surge to $190.
- In 2027, the TRX price is predicted to range between $0.216 and $0.85.
- TRON is actively developing decentralized applications and DeFi. The network supports scalable transactions, including the creation and transfer of tokens and stablecoins, and is actively used in the Web3 infrastructure.
- TRX has strong community support, shown by growing staking activity, new dApp launches, and active validator participation in building the ecosystem.
- Partnership expansion, protocol updates, and the rollout of new solutions on the Tron network may boost investment inflows and increase the token’s liquidity in global markets.
- Technical analysis: Support is forming around $0.1756. A breakout of resistance at $0.2826 may push the price up to $0.42, especially if trading volumes pick up and demand remains strong.
TRX Real-Time Market Status
The TRX price is trading at $0.26780 as of 18.06.2025.
When analyzing cryptocurrencies, it is crucial to track key indicators such as market capitalization, trading volume, circulating and maximum supply, as well as all-time highs and lows. This data helps assess an asset’s liquidity, popularity, and growth potential.
|
Indicator |
Value |
|
Market cap |
$26.23 billion |
|
24-hour trading volume |
$1.02 billion |
|
All-time high |
$0.44935 |
|
All-time low |
$0.001804 |
|
Circulating supply |
94.83 billion tokens |
|
Volume/Market cap |
0.0538 |
TRX Price Forecast for 2025 Based on Technical Analysis
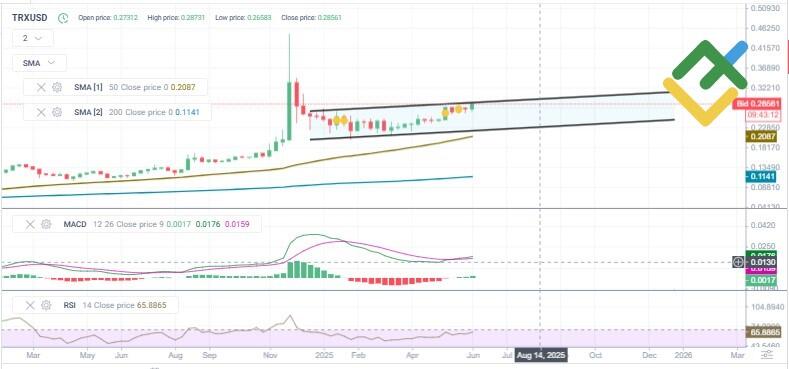
The TRXUSD pair continues to trade in an uptrend after a sharp spike in early 2025. The price is moving within an ascending channel, reflecting a gradual resurgence of interest in the asset. Moving averages confirm the strength of the trend. The 50-day SMA at $0.2087 and the 200-day SMA at $0.1141 act as key support levels, with the price trading above both lines.
The MACD indicator shows weak but consistent bullish momentum, with the histogram currently at 0.0017, while the RSI is approaching 66, indicating that demand is prevailing and the price is nearing the overbought zone. The channel remains narrow and directed upwards, with no signs of overheating. If the current trajectory persists, TRX may reach $0.30 by the end of 2025, which is the upper boundary of the channel.
The table below presents the TRX exchange rate forecast for the next 12 months.
|
Month |
Minimum, $ |
Maximum, $ |
|
June 2025 |
0.243 |
0.268 |
|
July 2025 |
0.247 |
0.274 |
|
August 2025 |
0.25 |
0.28 |
|
September 2025 |
0.253 |
0.286 |
|
October 2025 |
0.257 |
0.291 |
|
November 2025 |
0.26 |
0.296 |
|
December 2025 |
0.263 |
0.3 |
|
January 2026 |
0.266 |
0.303 |
|
February 2026 |
0.269 |
0.306 |
|
March 2026 |
0.271 |
0.309 |
|
April 2026 |
0.274 |
0.311 |
|
May 2026 |
0.276 |
0.314 |
Long-Term Trading Plan for TRXUSD for 2025
Given the steady movement of TRX within the ascending channel, the main strategy is to trade along the trend. Long positions can be opened at the lower boundary of the trading range, particularly when the reversal is confirmed by candlestick patterns or bullish MACD divergence.
An additional signal for entering long trades will be a pullback of the RSI value to the 50–55 range amid the overall upward movement. If the price consolidates above the current resistance, you can increase the volume of your long trades. A stop-loss order should be set slightly below the swing low or below the 50-day SMA. A take-profit order can be placed around $0.30. If the price breaks through the lower boundary of the channel, refrain from initiating new long trades and carefully analyze the market situation.
Analysts’ TRX Price Projections for 2025
Analysts offer a wide range of forecasts for TRX in 2025. Most of them anticipate renewed investor interest in the second half of the year.
Changelly
Price range: $0.200–$0.354 (as of 08.06.2025).
According to Changelly, after solid gains in June and July, TRX may dip in August and September. A mild pullback is expected toward the end of the year, suggesting a short-term correction.
|
Month |
Minimum, $ |
Average, $ |
Maximum, $ |
|
June |
0.277 |
0.316 |
0.354 |
|
July |
0.242 |
0.284 |
0.325 |
|
August |
0.257 |
0.266 |
0.274 |
|
September |
0.237 |
0.254 |
0.271 |
|
October |
0.233 |
0.279 |
0.325 |
|
November |
0.227 |
0.270 |
0.313 |
|
December |
0.200 |
0.233 |
0.265 |
CoinCodex
Price range: $0.281588–$0.656537 (as of 08.06.2025).
CoinCodex anticipates a bullish trend for TRX in the second half of 2025, with the strongest upward momentum likely to unfold from August through December. Average prices are also expected to climb, reflecting positive sentiment among market participants.
|
Month |
Minimum, $ |
Average, $ |
Maximum, $ |
|
June |
0.285969 |
0.341957 |
0.366457 |
|
July |
0.281588 |
0.327553 |
0.395877 |
|
August |
0.393813 |
0.460425 |
0.498539 |
|
September |
0.472406 |
0.541876 |
0.627362 |
|
October |
0.460335 |
0.506923 |
0.546113 |
|
November |
0.508214 |
0.542339 |
0.566285 |
|
December |
0.533101 |
0.581042 |
0.656537 |
Cryptomus
Price range: $0.2478–$0.3327 (as of 08.06.2025).
Cryptomus projects that TRX will steadily advance during the second half of 2025. This movement may reflect solid market support, with no major corrections expected.
|
Month |
Minimum, $ |
Average, $ |
Maximum, $ |
|
June |
0.2478 |
0.2777 |
0.2878 |
|
July |
0.2593 |
0.28 |
0.291 |
|
August |
0.2616 |
0.2866 |
0.296 |
|
September |
0.2732 |
0.2928 |
0.3055 |
|
October |
0.2844 |
0.3021 |
0.3152 |
|
November |
0.293 |
0.3111 |
0.324 |
|
December |
0.3027 |
0.3199 |
0.3327 |
Analysts’ TRX Price Projections for 2026
Projections for TRX in 2026 vary. However, many experts predict the price to rise gradually.
Changelly
Price range: $0.224–$0.604 (as of 08.06.2025).
Changelly‘s analysts expect TRX to post gains step by step throughout 2026, with the highest price projected to be reached in December.
|
Year |
Minimum, $ |
Average, $ |
Maximum, $ |
|
2026 |
0.224 |
0.436 |
0.604 |
CoinCodex
Price range: $0.298275–$0.526821 (as of 08.06.2025).
CoinCodex suggests that TRX may drift lower throughout the year, although a modest rebound is expected in December. The price is expected to reach a high in January.
|
Year |
Minimum, $ |
Average, $ |
Maximum, $ |
|
2026 |
0.298275 |
0.383326 |
0.526821 |
Cryptomus
Price range: $0.3103–$0.4451 (as of 08.06.2025).
According to Cryptomus, TRX may gradually appreciate month by month. The forecast remains conservative, predicting no signs of seasonal volatility or sharp price swings.
|
Year |
Minimum, $ |
Average, $ |
Maximum, $ |
|
2026 |
0.3103 |
0.3703 |
0.4451 |
Analysts’ TRX Price Projections for 2027
Expectations for TRX performance in 2027 differ across analysis platforms. These projections help assess the asset’s growth potential and serve as a benchmark for comparative analysis.
Changelly
Price range: $0.508–$0.853 (as of 08.06.2025).
Changelly anticipates a broader trading range for TRX in 2027. The average price is projected to edge higher and peak in the fourth quarter. The forecast is based on current momentum and predicts no major drawdowns.
|
Year |
Minimum, $ |
Average, $ |
Maximum, $ |
|
2027 |
0.508 |
0.615 |
0.853 |
CoinCodex
Price range: $0.270954–$0.438361 (as of 08.06.2025).
CoinCodex expects TRX to recover gradually in 2027 following a choppy performance at the beginning of the year. More significant gains are expected in the second half.
|
Year |
Minimum, $ |
Average, $ |
Maximum, $ |
|
2027 |
0.270954 |
0.340448 |
0.438361 |
Cryptomus
Price range: $0.3435–$0.4703 (as of 08.06.2025).
Cryptomus offers a restrained yet balanced outlook for TRX in 2027. Although the range remains relatively narrow, the price is projected to climb slowly. This assessment signals stable momentum, with no significant bullish or bearish pressure.
|
Year |
Minimum, $ |
Average, $ |
Maximum, $ |
|
2027 |
0.3435 |
0.4069 |
0.4703 |
Analysts’ TRX Price Projections for 2028
Forecasts for 2028 provide a basis for more informed trading decisions. Most analysts anticipate a steady increase in the TRX value.
Changelly
Price range: $0.705–$1.18 (as of 08.06.2025).
Changelly predicts a strong uptrend for TRX in 2028. The token may surpass $1.00 by December.
|
Year |
Minimum, $ |
Average, $ |
Maximum, $ |
|
2028 |
0.705 |
0.860 |
1.18 |
CoinCodex
Price range: $0.374302–$0.71172 (as of 08.06.2025).
According to CoinCodex, TRX is expected to strengthen progressively in 2028, with the highest price likely to be reached in the second half of the year. The forecast signals sustained investor interest in the asset over the long term.
|
Year |
Minimum, $ |
Average, $ |
Maximum, $ |
|
2028 |
0.374302 |
0.511274 |
0.71172 |
Cryptomus
Price range: $0.3658–$0.4948 (as of 08.06.2025).
Cryptomus provides a more cautious forecast for 2028. The average price is projected to remain below $0.45, with moderate volatility persisting.
|
Year |
Minimum, $ |
Average, $ |
Maximum, $ |
|
2028 |
0.3658 |
0.4303 |
0.4948 |
Analysts’ TRX Price Projections for 2029
The majority of analysts foresee a strengthening of TRX in 2029. However, opinions differ on how fast this growth might unfold.
Changelly
Price range: $0.997–$1.70 (as of 08.06.2025).
According to Changelly, TRX may continue to ascend in 2029. By the end of the year, the token is projected to exceed $1.40.
|
Year |
Minimum, $ |
Average, $ |
Maximum, $ |
|
2029 |
0.997 |
1.24 |
1.70 |
CoinCodex
Price range: $0.585352–$0.83091 (as of 08.06.2025).
CoinCodex suggests a modest price increase for TRX in 2029. Nevertheless, analysts believe the token may reach new highs.
|
Year |
Minimum, $ |
Average, $ |
Maximum, $ |
|
2029 |
0.585352 |
0.714390 |
0.83091 |
Cryptomus
Price range: $0.3893–$0.5197 (as of 08.06.2025).
Based on Cryptomus estimates, TRX is likely to move sideways in 2029. Still, analysts expect the price to hold above the psychological level of $0.50.
|
Year |
Minimum, $ |
Average, $ |
Maximum, $ |
|
2029 |
0.3893 |
0.4545 |
0.5197 |
Analysts’ TRX Price Projections for 2030
Long-term forecasts for 2030 offer insight into Tron’s broader prospects. These projections are approximate, as the actual price will depend on future market conditions.
Changelly
Price range: $1.44–$2.44 (as of 08.06.2025).
Changelly forecasts that TRX will extend its rally throughout 2030. The price may exceed $2.20 and continue advancing through December.
|
Year |
Minimum, $ |
Average, $ |
Maximum, $ |
|
2030 |
1.44 |
1.73 |
2.44 |
CoinCodex
Price range: $0.709907–$0.787098 (as of 08.06.2025).
CoinCodex projects steady appreciation in TRX over the course of 2030, with limited short-term volatility and no sharp spikes.
|
Year |
Minimum, $ |
Average, $ |
Maximum, $ |
|
2030 |
0.709907 |
0.735064 |
0.787098 |
Cryptomus
Price range: $0.4124–$0.5446 (as of 08.06.2025).
Cryptomus anticipates modest gains for TRX in 2030. The price is unlikely to rise above $0.55, and no clear trend is expected to form.
|
Year |
Minimum, $ |
Average, $ |
Maximum, $ |
|
2030 |
0.4124 |
0.4785 |
0.5446 |
Analysts’ TRX Price Projections until 2050
According to Changelly, TRX may significantly strengthen by 2050. The average price is projected to reach $95.40 in 2040 and skyrocket to $198.92 by 2050. This strong rally may be driven by sustained long-term demand for the asset.
CoinCodex anticipates a more moderate increase. The average price is expected to climb to $1.13 in 2040 and advance to $1.85 by 2050.
Cryptomus expects TRX to appreciate gradually. The average price is predicted to grow from $0.5714 in 2035 to $0.7335 in 2040 and reach $1.2334 by 2050, with no sharp fluctuations projected.
|
Year |
Changelly, $ |
CoinCodex, $ |
Cryptomus, $ |
|
2035 |
— |
— |
0.5714 |
|
2040 |
95.4 |
1.13 |
0.7335 |
|
2050 |
198.92 |
1.85 |
1.2334 |
While there are different predictions about growth rates, all experts are optimistic about the long-term prospects for TRX. However, investors should consider potential risks and monitor the state of the cryptocurrency market.
Market Sentiment for TRX (TRON) on Social Media
Social media sentiment significantly impacts TRX price movement, particularly given the influence of news and the cryptocurrency market’s volatility. User discussions shape the overall media sentiment, which is a collective emotional response that can impact investor and trader decisions.
Positive reviews increase demand for an asset and drive up its price. Conversely, negative news can trigger sell-offs. The analysis of comments, the tone of posts, and mentions on social media helps gauge public sentiment and predict short-term price movements.
This approach complements technical analysis and reveals hidden signals that may not be immediately apparent on the chart.
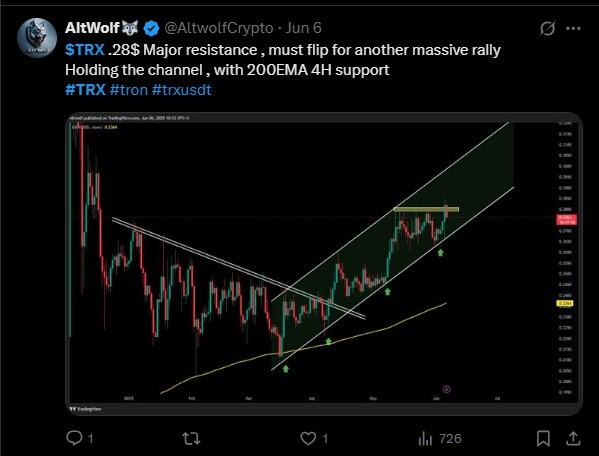
User @AltwolfCrypto believes that $0.28 is a key level for further gains. If the price consolidates above this level, a new rally may start. The user highlights the 200-day EMA, which acts as support, keeping the price within the ascending channel. The trader is confidently positive, expecting a strong upward momentum.
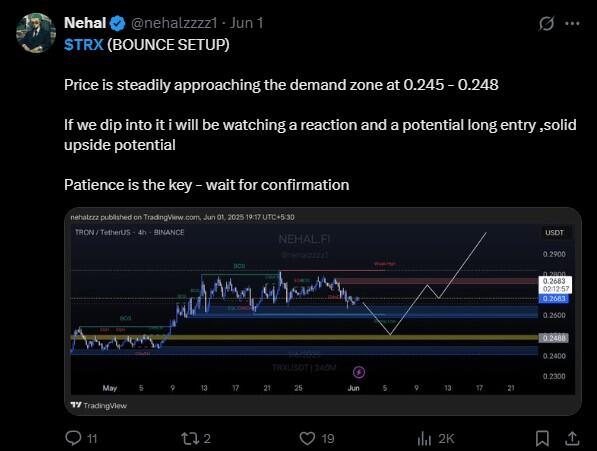
Analyst @nehalzzzz1 expects TRX to rebound from the $0.245–$0.248 zone. The user is closely watching the price action in this area and considering long trades. The post reflects cautious optimism, advising to wait for confirmation before entering the market.
Discussions about TRX on social media are mostly positive. Users are expressing enthusiasm about the continuation of the upward movement, taking into account technical indicators and the broader uptrend.
However, there are also more cautious assessments. Many investors are waiting for additional signals before opening trades. The overall sentiment is moderately optimistic.
TRX Price History
TRON (TRX) reached the highest price of 0.44935 USD on 04.12.2024.
The lowest price of TRON (TRX) was recorded on 12.11.2017 when the token declined to 0.001804 USD.
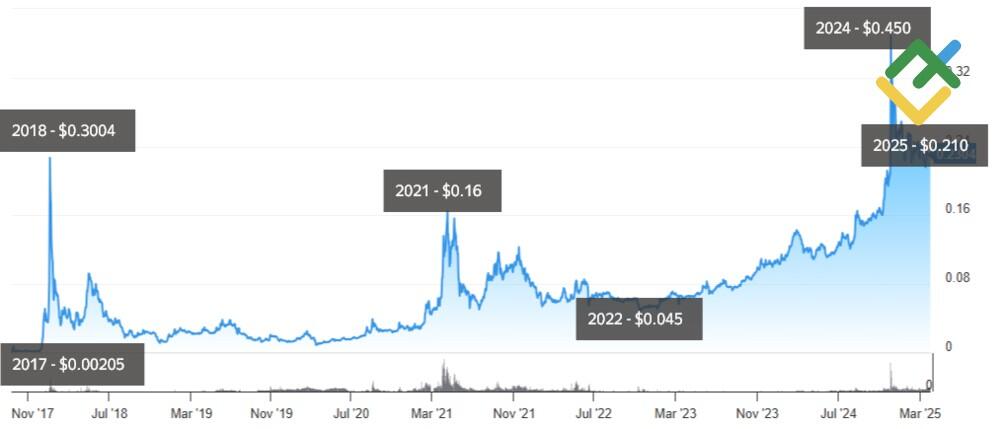
The chart below shows the TRXUSD pair performance over the last ten years. To make our forecasts as accurate as possible, it is essential to evaluate historical data.
The TRX price has undergone periods of robust growth and sharp corrections since its launch.
- 2017 – the project launch with an initial price of $0.00205.
- January 2018 – setting a high of $0.3004 amid the crypto boom.
- February 2018 – a decline to $0.02511 due to market correction.
- April 2021 – a rise to $0.16, though the price dropped to $0.05 after Bitcoin’s collapse.
- May 2022 – the quotes reached $0.12 but plunged to $0.06 after the Terra (LUNA) crash.
- November 2022 – setting a swing low of $0.045 after the bankruptcy of FTX.
- 2024 – a surge to $0.450 due to a 64% increase in TRON network activity, then a correction to $0.20.
- June 2025 – reaching the current price of $0.44935.
Overall, TRX remains a volatile asset, and its exchange rate will depend on market trends and global events.
TRX Price Fundamental Analysis
Fundamental analysis of TRX sheds light on the various factors that determine its long-term value. The price of the token depends not only on supply and demand but also on the technological development of the TRON network, the level of investor confidence, and the general situation in the cryptocurrency market.
What Factors Affect the TRX Price?
- The state of the crypto market – Bitcoin performance and global trends of digital assets.
- Technological development – TRON network updates, scalability, and security improvements.
- Partnerships and integrations – cooperation with DeFi platforms, exchanges, and financial services.
- Regulation – impact of laws and regulations on cryptocurrency circulation.
- Investor demand – interest from retail and institutional investors.
- Market liquidity – trading volume and volatility level.
More Facts About TRX
TRON (TRX) is a decentralized blockchain platform founded in 2017 by Chinese entrepreneur Justin Sun. It aims to create a global system for the free exchange of digital content, allowing users to publish, store, and distribute data without intermediaries.
The platform supports the development of decentralized applications (dApps) and smart contracts. TRON uses a delegated proof-of-ownership (DPoS) algorithm, which ensures high transaction speed and network scalability.
In 2018, TRON acquired BitTorrent, integrating its technology to expand its file-sharing capabilities. Besides, the TRX (Tronix) cryptocurrency is used to pay for transactions and interact with dApps within the TRON network. As of 2024, TRX is among the top cryptocurrencies by market capitalization, which confirms its popularity among users and investors.
Advantages and Disadvantages of Investing in TRX
Investing in TRX (Tron) comes with both advantages and disadvantages.
Advantages
- High efficiency. TRON’s network can process up to 2000 transactions per second.
- Low fees. Transactions on the TRON network are virtually free, making it attractive to users and developers.
- Support for dApps and smart contracts. The TRON platform provides opportunities to create and run decentralized applications and smart contracts.
- Active community and partnerships. TRON has an engaged community of developers and users, as well as partnerships with large companies such as BitTorrent and Samsung. This contributes to the development of the ecosystem.
Disadvantages
- Centralization concerns. Despite being positioned as a decentralized network, the TRON network is controlled by a small number of large nodes, which may affect security and overall resilience.
- Transparency issues. TRON has faced criticism for its unclear governance structure and lack of transparency in decision-making.
- Limited popularity. TRON is less well-known than Ethereum or Bitcoin, which may hinder its development.
How We Make Forecasts
When making forecasts for cryptocurrencies, we use a comprehensive approach:
- Short-term forecasts (up to 1 month) involve technical analysis, which means using tools like moving averages, the RSI, and the MACD indicator. In addition, Trading volumes are evaluated, and candlestick patterns are identified to determine the nearest price fluctuations.
- Medium-term forecasts (3–6 months) include conducting a fundamental analysis focusing on the factors that can affect the market.
- Long-term forecasts (more than 6 months) take into account project metrics such as technology, the strength of the team, and partnerships. Moreover, macroeconomic trends and their impact on the cryptocurrency market are analyzed.
Conclusion: Is TRX a Good Investment?
Tron (TRX) is steadily developing as a tech platform with an active ecosystem. Most analysts predict potential long-term appreciation. However, it is essential to consider all the risks, including high volatility, when investing in cryptocurrencies.
TRX may be a suitable option for investors focused on a buy-and-hold strategy and portfolio diversification. Nevertheless, before purchasing the asset, it is advisable to study the fundamental factors, consider market cycles, and assess your risk tolerance. A balanced approach remains key to effective trading and investment decisions.
TRX Price Prediction FAQs
The current TRX price is $0.26780 as of 18.06.2025.
The future TRX price hinges on the development of Tron technology, cryptocurrency market regulation, and the overall demand for decentralized applications. According to the most optimistic forecasts, the asset’s value is expected to skyrocket by 2050.
TRX is expected to trade between $0.30 and $0.60 in 2026. These estimates are based on the gradual development of Tron’s blockchain infrastructure, the expansion of the token’s scope of application, and general market conditions.
TRX presents promising growth potential thanks to its low transaction fees and support for dApps. However, it also comes with certain risks, particularly related to regulatory concerns. Over the long haul, the asset may gain strength as the Tron ecosystem continues to expand.
The key factors include crypto market trends, adoption of new technologies, demand for DeFi, NFT, and blockchain games, macroeconomic conditions, and regulators’ actions.
The TRX price may reach $1 under favorable market conditions, given the widespread popularity of the Tron blockchain. The price may hit this level in the long term, especially if the platform continues to expand partnerships, improve system scalability, and remain appealing to developers and users.
TRON is actively expanding its ecosystem, introducing new technologies, and entering into partnership agreements. The ongoing development of the DeFi and NFT sectors bolsters the long-term outlook for TRX, though investors should remain mindful of market risks.
The expanding dApp ecosystem, the integration of new solutions in DeFi and NFT, and partnerships with major companies could drive stronger demand for TRX, potentially buoying the token’s price.
Price chart of TRXUSD in real time mode
The content of this article reflects the author’s opinion and does not necessarily reflect the official position of LiteFinance broker. The material published on this page is provided for informational purposes only and should not be considered as the provision of investment advice for the purposes of Directive 2014/65/EU.
According to copyright law, this article is considered intellectual property, which includes a prohibition on copying and distributing it without consent.
{{value}} ( {{count}} {{title}} )
This post is originally published on LITEFINANCE.

