
Tezos (XTZ) stands out in the crypto world with its unique self-amending blockchain and a strong focus on community governance. The platform’s adaptability and innovative approach to smart contracts and decentralized applications suggest a promising future.
While predictions lean towards a bullish trend for Tezos, investors should note the crypto space’s inherent volatility and rapid market changes. This article will explore Tezos’s market trends, price predictions, and the factors shaping its future.
The article covers the following subjects:
Highlights and Key Points
-
Today’s XTZ rate is around $0.6920.
-
The coin’s price is expected to fluctuate between $0.6042 and 0.9466 until the end of 2024.
-
A bullish trend is projected for 2025-2030, with the price reaching $1.66-2.23 per token. The rate may rise to $5.98 by 2030.
-
Market sentiment, Tezos platform updates, partnership agreements, popularity among users, including large organizations, and control by regulators influence the XTZ rate.
Tezos Price Today Coming Days and Week
When forecasting Tezos’ price, consider market sentiment, crypto sector trends, and Tezos-specific developments like protocol upgrades or partnerships.
Analyze technical indicators like Moving Averages and RSI for short-term trends. Additionally, monitor broader economic indicators and significant global events, as they can influence investor behavior in the cryptocurrency market. This comprehensive approach helps in understanding potential movements in Tezos’ price shortly.
Analysts’ XTZ Price Projections for 2024
In this section, we explore the forecasts and insights provided by cryptocurrency analysts for XTZ (Tezos) for the rest of 2024. Experts agree that the asset will rise in value, but drastic fluctuations may come into play.
Changelly
Price range for 2024: $0.640 – 0.732 (estimated as of 16.10.24).
The Changelly analytical portal has provided a comprehensive forecast for the XTZ rate with a monthly breakdown. They anticipate a bullish trend with slight pullbacks.
|
Month |
Min. price, $ |
Average price, $ |
Max. price, $ |
|
October |
0.645 |
0.674 |
0.703 |
|
November |
0.640 |
0.686 |
0.732 |
|
December |
0.671 |
0.691 |
0.710 |
30 Rates
Price range for 2024: $0.6042 – 0.9466 (estimated as of 16.10.24).
According to 30Rates, Tezos’ price is expected to grow amid moderate volatility. The minimum projected price is $0.6042, while the maximum is expected at $0.9466 by year-end.
|
Month |
Opening, $ |
Min.– Max., $ |
Closing, $ |
|
October |
0.7459 |
0.6220-0.8100 |
0.7486 |
|
November |
0.7486 |
0.6042-0.8556 |
0.7996 |
|
December |
0.7996 |
0.7996-0.9466 |
0.8847 |
Tezos Technical Analysis
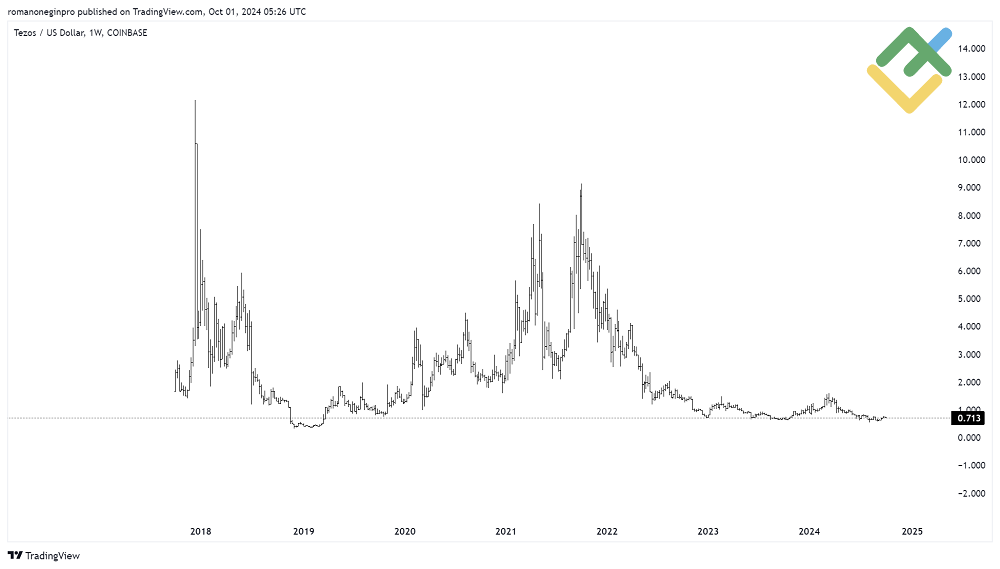
The weekly timeframe shows the entire history of the XTZUSD price movement. Since 2018, a large bearish corrective trend has been forming, which has not yet been fully completed.
Daily and four-hour timeframes are well-suited for XTZ technical analysis.
Additionally, we can use various tools:
-
Elliott waves will help determine patterns and predict a future price trajectory.
-
Trend lines indicate a prevailing price direction.
-
Fibonacci ratios serve to identify potential pivot points.
- Candlestick patterns track market behavior and psychology and spot potential targets.
Get access to a demo account on an easy-to-use Forex platform without registration
XTZUSD Forecast For Next Three Months
The four-hour timeframe demonstrates the final part of a large corrective triple zigzag [W]-[X]-[Y]-[X]-[Z] that is currently unfolding. Its three waves [W]-[X]-[Y] are likely fully completed. The actionary wave [Y] is a double zigzag (W)-(X)-(Y)-(X)-(Z).

The second linking wave [X] is presumably unfolding at the moment as a triple zigzag (W)-(X)-(Y)-(X)-(Z). Its four parts (W)-(X)-(Y)-(X) have been completed, while the zigzag-shaped actionary wave (Z) is developing. This wave is expected to continue to a level of 0.30 over the next month.
The new actionary wave [Z] may rise above the 1.59 high in the next two months.
Long-Term Tezos Analysis for 2024- 2025
The price is falling in a large corrective wave on the current H4 chart. A linking wave [X] is probably forming as a triple zigzag (W)-(X)-(Y)-(X)-(Z). Its final actionary subwave (Z), which is currently unfolding, is also a triple zigzag W-X-Y-X-Z of a smaller degree.
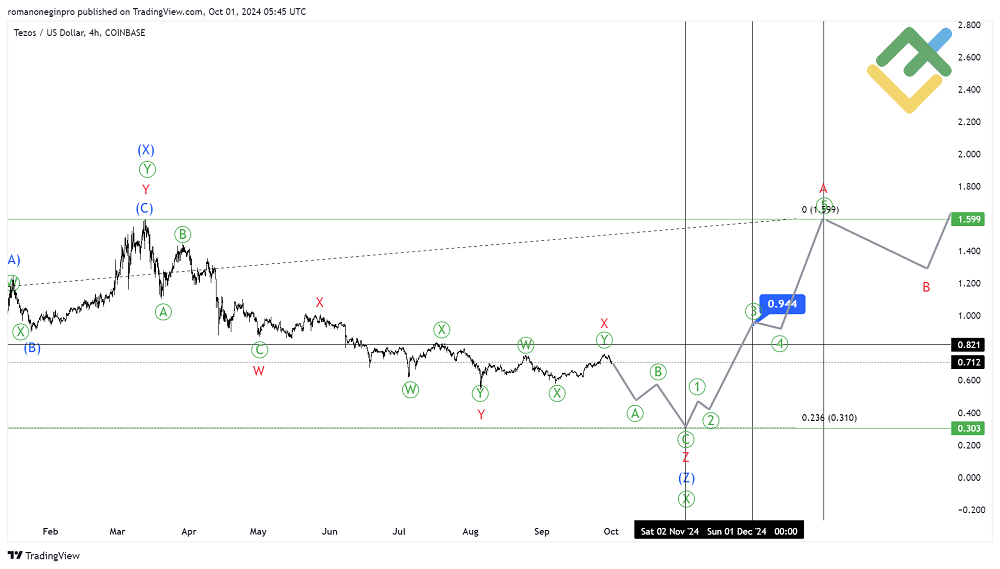
The bearish subwave Z will presumably be forming this month. It will most likely become a standard zigzag [A]-[B]-[C], as shown on the chart.
Bears can send the market to the price level of 0.30, where the actionary wave (Z) size will be 23.6% of wave (Y) according to the Fibonacci ratios.
From the beginning of November, the market may reverse. A new bullish wave will likely form as a zigzag A-B-C, and its upward impulse A is expected to reach a level of 0.94 in November.
Subwaves [4] and [5] of the impulse wave A will continue unfolding in December until this year’s end, presumably to 1.59. This is the maximum marked by subwave (X).
An actionary bullish wave is expected to develop as a triple zigzag from the beginning of 2025 and, most likely, until September 2025. The price may reach the level of 4.61.
|
Month |
XTZUSD projected values |
|
|
Minimum, $ |
Maximum, $ |
|
|
November 2024 |
0.30 |
0.94 |
|
December 2024 |
0.94 |
1.59 |
|
January 2025 |
1.39 |
1.59 |
|
February 2025 |
1.29 |
1.80 |
|
March 2025 |
1.80 |
2.34 |
|
April 2025 |
2.34 |
2.66 |
|
May 2025 |
2.26 |
2.66 |
|
June 2025 |
2.03 |
2.61 |
|
July 2025 |
2.61 |
3.98 |
|
August 2025 |
3.98 |
4.51 |
|
September 2025 |
3.63 |
4.19 |
XTZUSD Long-Term Trading Plan
A trading plan for three months and the coming year could look like the following:
-
Consider short positions from the current level until the end of the month as long as wave (Z) continues unfolding. The target is at 0.30.
-
The rate is expected to grow in a new zigzag starting in November. Long positions can be considered with a target of 0.94.
-
In December, you can also open long positions. The zigzag may end near the maximum of 1.59.
-
Consider opening long positions for long-term trading from the beginning of November until the end of 2024.
XTZ price expert analysis for 2025
Let’s explore the forecasts for XTZ from various analytical platforms. With a comprehensive study, you can make the most accurate forecast and outline a reliable trading plan.
Changelly
Price range for 2025: $0.622 – 1.43 (estimated as of 16.10.24).
Changelly bases its Tezos price prediction for 2025 on technical analysis and expert opinions. The minimum price of the cryptocurrency is expected to be $0.684 by the end of 2025, and the maximum – at $1.06. The average value is projected to be around $1.43.
|
Month |
Min. price, $ |
Average price, $ |
Max. price, $ |
|
January |
0.644 |
0.790 |
0.717 |
|
February |
0.647 |
0.848 |
0.748 |
|
March |
0.651 |
0.907 |
0.780 |
|
April |
0.655 |
0.965 |
0.811 |
|
May |
0.658 |
1.02 |
0.842 |
|
June |
0.622 |
1.08 |
0.873 |
|
July |
0.666 |
1.14 |
0.904 |
|
August |
0.669 |
1.20 |
0.935 |
|
September |
0.673 |
1.26 |
0.967 |
|
October |
0.677 |
1.31 |
0.998 |
|
November |
0.680 |
1.37 |
1.03 |
|
December |
0.684 |
1.43 |
1.06 |
30Rates
Price range for 2025: $0.7236 – 1.6656 (estimated as of 16.10.24).
Based on 30Rates’s estimates, Tezos (XTZ)’s price is set to grow significantly in 2025. The coin will likely reach a high of 1.6656 by December.
|
Month |
Opening, $ |
Min.– Max., $ |
Closing, $ |
|
January |
0.8847 |
0.7377-0.8847 |
0.7932 |
|
February |
0.7932 |
0.7236-0.8326 |
0.7781 |
|
March |
0.7781 |
0.7526-0.8658 |
0.8092 |
|
April |
0.8092 |
0.7575-0.8715 |
0.8145 |
|
May |
0.8145 |
0.7878-0.9064 |
0.8471 |
|
June |
0.8471 |
0.8471-1.0014 |
0.9359 |
|
July |
0.9359 |
0.9359-1.1616 |
1.0856 |
|
August |
1.0856 |
1.0237-1.1779 |
1.1008 |
|
September |
1.1008 |
1.1008-1.3663 |
1.2769 |
|
October |
1.2769 |
1.2769-1.4953 |
1.3975 |
|
November |
1.3975 |
1.3975-1.6620 |
1.5533 |
|
December |
1.5533 |
1.4476-1.6656 |
1.5566 |
Analysts’ XTZ Price Projections for 2026
What will the XTZ rate be in 2026? Experts anticipate a bullish trend to continue, but the asset’s volatility will remain high.
Changelly
Price range for 2026: $0.749 – 1.72 (estimated as of 16.10.24).
Changelly forecasts that Tezos’ bullish trend will continue in 2026. The minimum price is expected to be 0.749 in January. In December, the rate may climb to 1.72.
|
Month |
Min. price, $ |
Average price, $ |
Max. price, $ |
|
January |
0.749 |
1.44 |
1.12 |
|
February |
0.813 |
1.44 |
1.17 |
|
March |
0.878 |
1.45 |
1.23 |
|
April |
0.943 |
1.45 |
1.28 |
|
May |
1.01 |
1.46 |
1.34 |
|
June |
1.07 |
1.47 |
1.39 |
|
July |
1.14 |
1.47 |
1.45 |
|
August |
1.20 |
1.48 |
1.50 |
|
September |
1.27 |
1.48 |
1.56 |
|
October |
1.33 |
1.49 |
1.61 |
|
November |
1.40 |
1.49 |
1.67 |
|
December |
1.46 |
1.50 |
1.72 |
CryptoPredictions
Price range for 2026: $0.670 – 1.359 (estimated as of 16.10.24).
Analysts at CryptoPredictions suggest a moderate yet sustained bullish trend throughout the year. Opening at a low of 0.670 in January, the rate will grow stably and reach 1.359 in December.
|
Month |
Minimum, $ |
Maximum, $ |
Average price, $ |
|
January |
0.670 |
0.985 |
0.788 |
|
February |
0.692 |
1.019 |
0.814 |
|
March |
0.713 |
1.049 |
0.839 |
|
April |
0.737 |
1.084 |
0.867 |
|
May |
0.760 |
1.118 |
0.894 |
|
June |
0.784 |
1.154 |
0.922 |
|
July |
0.807 |
1.188 |
0.950 |
|
August |
0.831 |
1.223 |
0.978 |
|
September |
0.855 |
1.258 |
1.006 |
|
October |
0.878 |
1.292 |
1.033 |
|
November |
0.901 |
1.326 |
1.061 |
|
December |
0.923 |
1.359 |
1.087 |
XTZ long-term forecast for 2027-2030
Most forecasts for Tezos’ price in 2027-2030 suggest a bullish trend. Experts at Changelly expect the upward momentum to continue, with the price ranging from 1.76 to 5.98 for four years. Meanwhile, AMBCrypto projects a more modest growth, not expecting the maximum price to exceed 2.23 by 2030.
|
Year |
Average price, $ |
Min. price, $ |
Max. price, $ |
|
2027 |
1.25 |
0.99 |
1.50 |
|
2028 |
1.41 |
1.13 |
1.69 |
|
2029 |
1.41 |
1.13 |
1.70 |
|
2030 |
1.86 |
1.49 |
2.23 |
Recent Price History of the (XTZ) Tezos coin
Tezos (XTZ) has demonstrated significant price volatility over the years, from as low as $0.41 with a market cap of $380.80M in 2018 to a more robust $1.76 and a market cap of $917.20M by the end of 2019. However, by December 30, 2022, it witnessed a downturn to $0.72 per token. The decline from its 2021 high of $9.11 to the more modest figures in 2022 has caught investor attention.

The price gradually declined throughout 2022, hitting 0.70 by the end of the year. Then, a correction movement began and continued until the spring of 2024. However, the price has been falling again for the last six months. The conducted wave analysis suggests that the final part of the triple zigzag is being built. This pattern will likely end at 0.30, and XTZ will follow a new bullish trend from the beginning of November and beyond.
Predictions for XTZ’s prices vary, with some optimistic scenarios suggesting a fourfold increase. However, all will depend on Tezos’ platform’s popularity and the broader market dynamics.
Which Factors Impact XTZ Price?
Tezos (XTZ) has been an intriguing player in the blockchain space, known for its innovative approach to governance and scalability. Various factors drive Tezos’s value.
-
Market sentiment. Positive news or developments tend to boost investor confidence and drive prices up.
-
Blockchain Development. Advances or setbacks in the Tezos protocol directly affect investor perception and, consequently, the price of XTZ.
-
Regulatory Environment. Changes in laws and regulations surrounding cryptocurrencies can significantly impact the demand and price of Tezos.
-
Technical Analysis and Market Trends. Trading patterns, historical data, and market trends are analyzed to predict future price movements of XTZ.
-
Staking and Institutional Adoption. The attractiveness of staking rewards and adoption by larger institutions can drive demand and price changes for Tezos.
Conclusion: Is It Worth Investing in XTZ?
Tezos shows potential for steady, long-term growth driven by its robust technology and community governance model. While 2024 may bring some volatility, experts expect an upward trajectory over the next 5-10 years, with prices potentially exceeding $5.98 per XTZ token. Tezos looks like a promising long-term investment tool despite short-term fluctuations.
XTZ Price Prediction FAQ
The current price that Tezos is trading at is around $0.6920 per XTZ token as of today 21.10.2024.
According to expert analysis, Tezos is expected to reach $0.732 to $0.9466 per token by the end of 2024. This will depend mainly on how the broader crypto markets perform and whether Tezos continues to develop its ecosystem.
According to the most optimistic forecasts, the price of Tezos could reach $1.6656 by 2025. Some experts give more modest estimates, expecting XTZ to trade at $0.622-$1.43 in 2025.
As Tezos has been forming a corrective pattern for seven years, the price may see impulse growth in the years to come. If this pattern turns out to be correction B of a global multi-year zigzag, upon its completion, the market may skyrocket to 5.98 by 2030. A more optimistic scenario suggests that the bulls may drive the price higher.
Experts believe that the XTZ rate will highly likely reach $10 if wave B of the global multi-year zigzag forms. If we see a rapid “bullish” impulse after the completion of this wave, the price will reach a level of $10 in the next five years.
The primary factors that affect Tezos’s price include overall crypto market conditions, new upgrades to the Tezos blockchain protocol, the pace of dApp development on the platform, user and developer adoption rates, trading volumes, and liquidity.
As mentioned earlier, a multi-year corrective pattern is forming on the Tezos price chart. This is likely a corrective wave B, after which impulse C will unfold. In this impulse, the price may rise to 5.98 during 2024-2030, or even higher.
Tezos could be a good long-term investment. The market will highly likely grow once the corrective wave is completed. If this corrective wave turns out to be wave B in a pattern of a higher degree, impulse C could start developing upon its completion. If the assumption is correct, consider the Tezos cryptocurrency as a long-term investment.
Price chart of XTZUSD in real time mode

The content of this article reflects the author’s opinion and does not necessarily reflect the official position of LiteFinance. The material published on this page is provided for informational purposes only and should not be considered as the provision of investment advice for the purposes of Directive 2004/39/EC.
{{value}} ( {{count}} {{title}} )
This post is originally published on LITEFINANCE.


