
Tesla stands out in the market due to its innovations in electric vehicles, solar power, and artificial intelligence. Yet, how will these factors affect its stock price in the long term? This analysis aims to forecast TSLA’s stock price from 2025 to 2050, carefully considering technological advancements, shifts in the economic landscape, and the evolving competitive environment.
This article explores various scenarios and factors that may impact Tesla’s future trajectory, providing a detailed overview of the company’s stock price prospects.
The article covers the following subjects:
Major Takeaways
- The current TSLA stock price is $241.37 as of 21.04.2025.
- Tesla reached its all-time high of $487.87 on 18.12.2024. The all-time low of $0.99 was set on 07.07.2010.
- Analysts’ opinions on the Tesla stock in 2025 are divided. Some experts believe the price will reverse upward and climb to $307.65–$444.66. Other agencies predict a bearish trend to continue to $210.00 or offer neutral forecasts, suggesting the asset will trade in the range of $144.00–$285.00 during the year.
- According to various analysis agencies, the Tesla securities may range from $174.23 to $323.00 in 2026. More conservative forecasts suggest the quotes will move within the narrow range of $232.51–$265.71.
- Although analysts’ forecasts for TSLA shares in 2027–2030 diverge, almost all of them predict a positive scenario. Some experts believe that the price may reach $958.40–$1,750.00 by 2030. More conservative projections indicate an increase to $624.38 by 2027–2030.
- Long-term forecasts are mostly positive. Nevertheless, such a long period introduces a lot of uncertainties due to the influence of fundamental factors. Regardless, experts are optimistic that the stock may reach $4,644.93–$5,878.37 by 2040–2050.
TSLA Real-Time Market Status
The TSLA price is trading at $241.37 as of 21.04.2025.
To determine the current state of Tesla Inc. shares, remember to track the company’s financial indicators:
- Market capitalization is a measure of a company’s net value as perceived by investors.
- The number of shares outstanding signifies the total number of shares available in the market.
- Earnings per share (EPS) represent the amount of a company’s earnings available to each share, revealing its profitability.
- The price-to-earnings ratio (P/E) indicates how high the stock price is in relation to the earnings.
- Monthly volatility illustrates 30-day fluctuations in the asset price.
- The average trading volume over 20 days shows the average daily volume over the last 20 trading sessions.
|
Indicator |
Value |
|
Market cap |
$810.92 billion |
|
Shares outstanding |
3.22 billion |
|
Earnings per share (EPS) |
$2.04 |
|
Price-to-earnings ratio (P/E) |
123.58 |
|
Monthly volatility |
23.45% |
|
Average trading volume over 20 days |
$147.94 million |
TSLA Stock Price Forecast for 2025 Based on Technical Analysis
Let’s perform a technical analysis of the TSLA stock using a weekly chart.

Since the end of 2024, Tesla’s share price has fallen 53%. Currently, the asset is hovering at 254.04. Technical indicators and candlestick patterns are giving contradictory signals:
- The price is trading within a large Bear Flag pattern. A downward breakout of this pattern is expected, with a potential long-term target of 106.13.
- Bullish Engulfing and Hammer reversal patterns are forming within the Bear Flag pattern, suggesting that the price may slide to the buy area below the support zone and implying that the current downtrend may reverse.
- MACD values are increasing in the negative zone, aiming at the zero line. This indicates that the bearish trend is fading.
- RSI values are at 41, pointing to ongoing selling pressure and potential further decline.
- MFI readings indicate a significant outflow of liquidity from the asset since the start of 2025, with values remaining near the lower boundary of the index.
- The VWAP and SMA20 are both above the current market price, suggesting sustained selling pressure.
The table below presents Tesla’s (#TSLA) stock price forecasts for the next 12 months.
|
Month |
Minimum, $ |
Maximum, $ |
|
April 2025 |
214.26 |
288.00 |
|
May 2025 |
276.69 |
324.53 |
|
June 2025 |
308.87 |
334.96 |
|
July 2025 |
295.83 |
314.09 |
|
August 2025 |
306.24 |
336.09 |
|
September 2025 |
326.27 |
361.05 |
|
October 2025 |
328.88 |
365.40 |
|
November 2025 |
352.36 |
392.36 |
|
December 2025 |
368.01 |
405.41 |
|
January 2026 |
360.18 |
384.53 |
|
February 2026 |
377.58 |
407.15 |
|
March 2026 |
405.41 |
428.89 |
Long-Term Trading Plan for TSLAUSD for 2025
Technical indicators and candlestick patterns provide no clear signals for opening trades in TSLA shares. However, technical analysis has helped identify key support and resistance levels that can be used in your trading strategy.
Trading plan for 12 months
- The price chart shows the formation of a large Bear Flag — a continuation pattern — with Hammer and Bullish Engulfing candlesticks appearing within it.
- MACD values are rising in the negative zone and indicating the gradual weakening of bearish momentum. The RSI is below 50, signaling the development of a bearish trend. The MFI reading is near the lower boundary, although it is steadily growing, pointing to a burgeoning bullish momentum.
- If the price surges and pierces the key resistance of 298.90, one may consider long trades with long-term targets near 328.89–488.81.
- If the price manages to break through the key support of 215.37, consider short trades with targets near 190.38–106.13 during 2025.
Analysts’ TSLA Shares Price Projections for 2025
Experts forecast a mixed performance for TSLA’s share price in 2025.
LongForecast
Price range in 2025: $144.00–$285.00 (as of 14.04.2025).
According to LongForecast, the Tesla price may reach $185.00 by the middle of the year. In the second half, a short-term recovery to $242.00 is expected.
|
Month |
Open, $ |
Min–Max, $ |
Close, $ |
|
April |
268.00 |
185.00–285.00 |
217.00 |
|
May |
217.00 |
186.00–257.00 |
202.00 |
|
June |
202.00 |
170.00–202.00 |
185.00 |
|
July |
185.00 |
144.00–185.00 |
157.00 |
|
August |
157.00 |
144.00–170.00 |
157.00 |
|
September |
157.00 |
157.00–195.00 |
181.00 |
|
October |
181.00 |
181.00–225.00 |
208.00 |
|
November |
208.00 |
193.00–227.00 |
210.00 |
|
December |
210.00 |
210.00–261.00 |
242.00 |
Gov Capital
Price range in 2025: $226.34–$449.96 (as of 14.04.2025).
Gov Capital predicts that the average price of TSLA shares will reach $296.00 by the middle of 2025. In the second half of the year, the quotes are expected to trade within the range of $275.59–$449.96, with an average closing price of $341.83.
|
Date |
Least Possible Price, $ |
Average, $ |
Best Possible Price, $ |
|
30.04.2025 |
226.34 |
251.49 |
276.64 |
|
31.05.2025 |
231.46 |
257.18 |
282.90 |
|
30.06.2025 |
266.40 |
296.00 |
325.61 |
|
31.07.2025 |
285.93 |
317.70 |
349.47 |
|
31.08.2025 |
275.59 |
306.21 |
336.83 |
|
30.09.2025 |
324.16 |
360.18 |
396.20 |
|
31.10.2025 |
368.15 |
409.05 |
449.96 |
|
30.11.2025 |
331.64 |
368.49 |
405.34 |
|
31.12.2025 |
307.65 |
341.83 |
376.01 |
CoinCodex
Price range in 2025: $216.79–$556.03 (as of 14.04.2025).
According to CoinCodex, the average price of the asset may stabilize at $248.23 in June. By the end of the year, experts anticipate the quotes to steadily rise to $444.66–$499.73.
|
Month |
Minimum, $ |
Average, $ |
Maximum, $ |
|
April |
273.55 |
290.02 |
310.76 |
|
May |
216.79 |
240.77 |
274.42 |
|
June |
227.14 |
248.23 |
276.15 |
|
July |
251.45 |
264.12 |
289.63 |
|
August |
269.94 |
287.40 |
302.43 |
|
September |
299.83 |
311.45 |
326.72 |
|
October |
321.83 |
377.88 |
505.50 |
|
November |
444.63 |
499.73 |
556.03 |
|
December |
393.46 |
444.66 |
512.54 |
Tesla shares are expected to face volatility in 2025 due to competition and technological advancements. Forecasts suggest significant gains if new products are launched successfully and production capacity is expanded. However, performance may be affected by macroeconomic conditions and geopolitical instability.
Analysts’ TSLA Shares Price Projections for 2026
Many analysis agencies make predominantly negative forecasts for TSLA’s stock price in 2026.
LongForecast
Price range in 2026: $224.00–$429.00 (as of 14.04.2025).
According to LongForecast, the price will open at $242.00 in 2026. The upward momentum is expected to progress to $320.00 by the end of June. In the second half of 2026, the bullish trend is expected to continue, with the price reaching $323.00 by the end of December.
|
Month |
Open, $ |
Min–Max, $ |
Close, $ |
|
January |
242.00 |
224.00–262.00 |
243.00 |
|
June |
298.00 |
294.00–346.00 |
320.00 |
|
December |
344.00 |
297.00–349.00 |
323.00 |
WalletInvestor
Price range in 2026: $228.39–$266.38 (as of 14.04.2025).
WalletInvestor forecasts that the asset’s value may reach $265.40 at the beginning of 2026. By the middle of the year, the price is expected to trade between $232.51 and $241.77. At the end of the year, analysts predict that the average price will stabilize at $265.71.
|
Month |
Open, $ |
Close, $ |
Minimum, $ |
Maximum, $ |
|
January |
265.40 |
258.17 |
258.17 |
266.38 |
|
June |
232.51 |
241.77 |
232.28 |
241.93 |
|
December |
261.18 |
265.71 |
261.18 |
265.98 |
CoinCodex
Price range in 2026: $98.80–$520.20 (as of 14.04.2025).
CoinCodex predicts that Tesla’s stock price may reach $450.08 at the start of 2026 but drop to $289.79 by mid-year. Negative momentum is expected to continue in the second half, with an average price of $174.23.
|
Month |
Minimum, $ |
Average, $ |
Maximum, $ |
|
January |
355.84 |
450.08 |
520.20 |
|
June |
259.37 |
289.79 |
316.06 |
|
December |
98.80 |
174.23 |
224.78 |
Forecasting Tesla’s stock price for 2026 is challenging due to the rapid development of the electric vehicle market and the company’s technological advancements. Estimates vary from optimistic predictions of growth driven by production expansion and new model launches to more cautious views that take into account competition and regulatory risks.
Analysts’ TSLA Shares Price Projections for 2027
Experts provide moderate forecasts for the SLA stock in 2027.
LongForecast
Price range in 2027: $226.00–$460.00 (as of 14.04.2025).
According to LongForecast, Tesla may reach $323.00 per share at the beginning of 2027, hitting a high of $403.00 in March. By the end of the year, the price is likely to trade around $314.00.
|
Month |
Open, $ |
Min–Max, $ |
Close, $ |
|
January |
323.00 |
296.00–348.00 |
322.00 |
|
June |
370.00 |
290.00–370.00 |
315.00 |
|
December |
325.00 |
289.00–339.00 |
314.00 |
WalletInvestor
Price range in 2027: $228.85–$266.83 (as of 14.04.2025).
WalletInvestor forecasts that Tesla’s share price will trade between $258.69 and $266.83 in early 2027. Analysts expect a mid-year pullback to $242.31, with the price recovering and settling near $265.52 by year-end.
|
Month |
Open, $ |
Close, $ |
Minimum, $ |
Maximum, $ |
|
January |
265.22 |
258.69 |
258.69 |
266.83 |
|
June |
232.21 |
242.31 |
232.21 |
242.31 |
|
December |
261.76 |
265.52 |
261.51 |
266.25 |
CoinCodex
Price range in 2027: $91.67–$378.51 (as of 14.04.2025).
CoinCodex projects TSLA’s average price at approximately $126.65 in early 2027. Following a sharp slump, a rebound is expected by mid-year, with quotes reaching $298.35. The price is expected to continue climbing toward $305.25 at the end of the year.
|
Month |
Minimum, $ |
Average, $ |
Maximum, $ |
|
January |
91.67 |
126.65 |
190.62 |
|
June |
232.24 |
298.35 |
338.09 |
|
December |
286.81 |
305.25 |
327.45 |
In 2027, Tesla shares may face heightened volatility sparked by breakthroughs in self-driving cars, competition from legacy automakers, and evolving government policies on electric vehicles.
Analysts’ TSLA Shares Price Projections for 2028
Experts disagree on TSLA’s share price performance in 2028.
LongForecast
Price range in 2028: $304.00–$453.00 (as of 14.04.2025).
LongForecast expects the asset to trade around $314.00 in early 2028. The first half of the year will likely see neutral movement, with the price closing at $362.00 in June. In the second half, the price may fluctuate in both directions before stabilizing near $342.00 by the end of December.
|
Month |
Open, $ |
Min–Max, $ |
Close, $ |
|
January |
314.00 |
314.00–390.00 |
361.00 |
|
June |
419.00 |
333.00–419.00 |
362.00 |
|
December |
335.00 |
315.00–369.00 |
342.00 |
WalletInvestor
Price range in 2028: $229.39–$267.22 (as of 14.04.2025).
According to WalletInvestor, the Tesla stock may surge to $267.22 at the beginning of 2028. The first half of the year is expected to witness mixed momentum, with the price reaching $242.27 by the end of June. The asset may soar again in the second half of the year, hitting $265.80 by the end of December.
|
Month |
Open, $ |
Close, $ |
Minimum, $ |
Maximum, $ |
|
January |
267.22 |
260.47 |
259.29 |
267.22 |
|
June |
232.93 |
242.27 |
232.74 |
242.39 |
|
December |
261.59 |
265.80 |
261.59 |
266.52 |
CoinCodex
Price range in 2028: $144.54–$649.57 (as of 14.04.2025).
CoinCodex‘s analysts predict significant volatility for Tesla’s stock in 2028, anticipating an average price of approximately $261.04 at the start of the year. However, a plunge to around $206.47 is expected by mid-year, followed by a potential rebound to $558.65 by year-end.
|
Month |
Minimum, $ |
Average, $ |
Maximum, $ |
|
January |
208.96 |
261.04 |
310.47 |
|
June |
188.13 |
206.47 |
243.84 |
|
December |
446.37 |
558.65 |
649.57 |
Analysts forecast Tesla shares to skyrocket in 2028, fueled by the expansion of electric vehicle production, autonomous driving technology, and energy solutions. The stock may reach $558.65–$649.57 and beyond, provided the current growth rate is maintained and new projects are successfully implemented.
Analysts’ TSLA Shares Price Projections for 2029
Most analysts expect positive momentum for Tesla shares in 2029.
WalletInvestor
Price range in 2029: $230.01–$267.89 (as of 14.04.2025).
According to WalletInvestor, the price will open at $267.57 in 2029. By mid-year, the price is forecasted to slide to $242.11. In the second half of the year, the asset’s trajectory is expected to be mixed. The price will likely close at $267.89 in December.
|
Month |
Open, $ |
Close, $ |
Minimum, $ |
Maximum, $ |
|
January |
267.57 |
260.49 |
259.97 |
267.57 |
|
June |
232.67 |
242.11 |
232.67 |
242.25 |
|
December |
263.95 |
267.89 |
263.57 |
267.89 |
CoinCodex
Price range in 2029: $273.18–$758.14 (as of 14.04.2025).
CoinCodex projects the average TSLA share price will trade around $549.98 in early 2029. By mid-year, the asset may slip to $387.29. In the second half, experts anticipate a sharp jump to $629.89.
|
Month |
Minimum, $ |
Average, $ |
Maximum, $ |
|
January |
523.46 |
549.98 |
587.37 |
|
June |
363.53 |
387.29 |
422.33 |
|
December |
563.08 |
629.89 |
706.15 |
Markettalkz
Price range in 2029: $580.00–$1,100.00 (as of 14.04.2025).
According to Markettalkz, the price will range between $580.00 and $980.00 in the first half of 2029. In the second half, the bullish trend may intensify, with the quotes reaching $1,100.00 in December.
|
Month |
Minimum, $ |
Maximum, $ |
|
January |
580.00 |
880.00 |
|
June |
630.00 |
980.00 |
|
December |
690.00 |
1,100.00 |
The analysis of market trends suggests that Tesla’s stock may surge significantly in 2029, exceeding the current levels. This growth is possible if the company maintains its innovative approach and successfully expands into new markets.
Analysts’ TSLA Shares Price Projections for 2030
Experts are split on how TSLA’s stock price will change in 2030.
CoinCodex
Price range in 2030: $209.55–$715.14 (as of 14.04.2025).
According to CoinCodex, the average price will reach $624.38 at the beginning of 2030. By mid-year, the asset may fall to $435.50. In the year’s second half, the negative momentum may escalate, dragging the average price to $291.94 in December.
|
Month |
Minimum, $ |
Average, $ |
Maximum, $ |
|
January |
517.94 |
624.38 |
715.14 |
|
June |
402.19 |
435.50 |
470.22 |
|
December |
209.55 |
291.94 |
360.70 |
Markettalkz
Price range in 2030: $700.00–$1,750.00 (as of 14.04.2025).
Markettalkz offers an optimistic outlook for the Tesla stock in 2030. At the beginning of the year, the share price will likely trade around $700.00–$1,200.00. By the middle of the year, the quotes may reach the range of $800.00–$1,450.00. In the second half of 2030, the bullish momentum will strengthen, and the price will soar to $1,750.00 in December.
|
Month |
Minimum, $ |
Maximum, $ |
|
January |
700.00 |
1,200.00 |
|
June |
800.00 |
1,450.00 |
|
December |
920.00 |
1,750.00 |
Stockscan
Price range in 2030: $353.43–$958.40 (as of 14.04.2025).
Stockscan predicts that the average price could reach $399.68 by early 2030. The uptrend is expected to continue, with the price rising to $647.91 by mid-year and reaching $956.04 by the end of the year.
|
Month |
Minimum, $ |
Average, $ |
Maximum, $ |
|
January |
399.68 |
353.43 |
400.24 |
|
June |
647.91 |
606.61 |
648.04 |
|
December |
956.04 |
913.02 |
958.40 |
Forecasting Tesla’s share price for 2030 is challenging due to high market volatility and the uncertainty of future technological developments. Optimistic scenarios predict the stock may rise, supported by Tesla’s leading position in the electric vehicle and energy sectors. On the other hand, pessimistic forecasts point to potential declines driven by growing competition and regulatory challenges. A more balanced outlook suggests moderate appreciation, largely dependent on continued innovation and the company’s ability to scale production.
Analysts’ TSLA Shares Price Projections until 2050
It is difficult to forecast Tesla’s share price over the long term because of a range of factors tied both to the company’s unique characteristics and broader trends in technology and the global economy.
- CoinPriceForecast offers moderate forecasts for TSLA shares. According to their data, the price may climb to $952.00 in 2035.
- Experts at CoinCodex provide a more positive outlook, expecting the price to jump to $4,026.82 by 2040.
- According to Markettalkz, the value of Tesla’s securities may appreciate to $4,644.93 by 2040 and to $5,878.37 by 2050.
|
Year |
CoinPriceForecast, $ |
CoinCodex, $ |
Markettalkz, $ |
|
2035 |
952.00 |
– |
3,612.22 |
|
2040 |
– |
1,682.49 |
4,644.93 |
|
2045 |
– |
– |
5,439.34 |
|
2050 |
– |
4,026.82 |
5,878.37 |
The Tesla stock may experience considerable fluctuations by 2040–2050, stemming from technological advances in autonomous driving, the energy revolution, and the company’s space-related ambitions. Success in these areas, as well as global economic stability, will determine the long-term trajectory of the stock price.
Market Sentiment for TSLA (Tesla) on Social Media
Media sentiment refers to the overall tone of news and publications reflecting public opinion about Tesla. Positive sentiment often drives the share price higher, while negative sentiment can lead to declines, as public perception influences investor behavior.

@strenghPlan, a user of the X (former Twitter) social network, posted about a large purchase of #TSLA shares last week amid expectations of a price hike. The independent expert predicts the stock will climb to at least $1,000.00 in the next few years.

@zero_point_1 suggests that the tech giant’s share price will unlikely tumble below $100.00 and encourages everyone to buy back the asset on any decline.
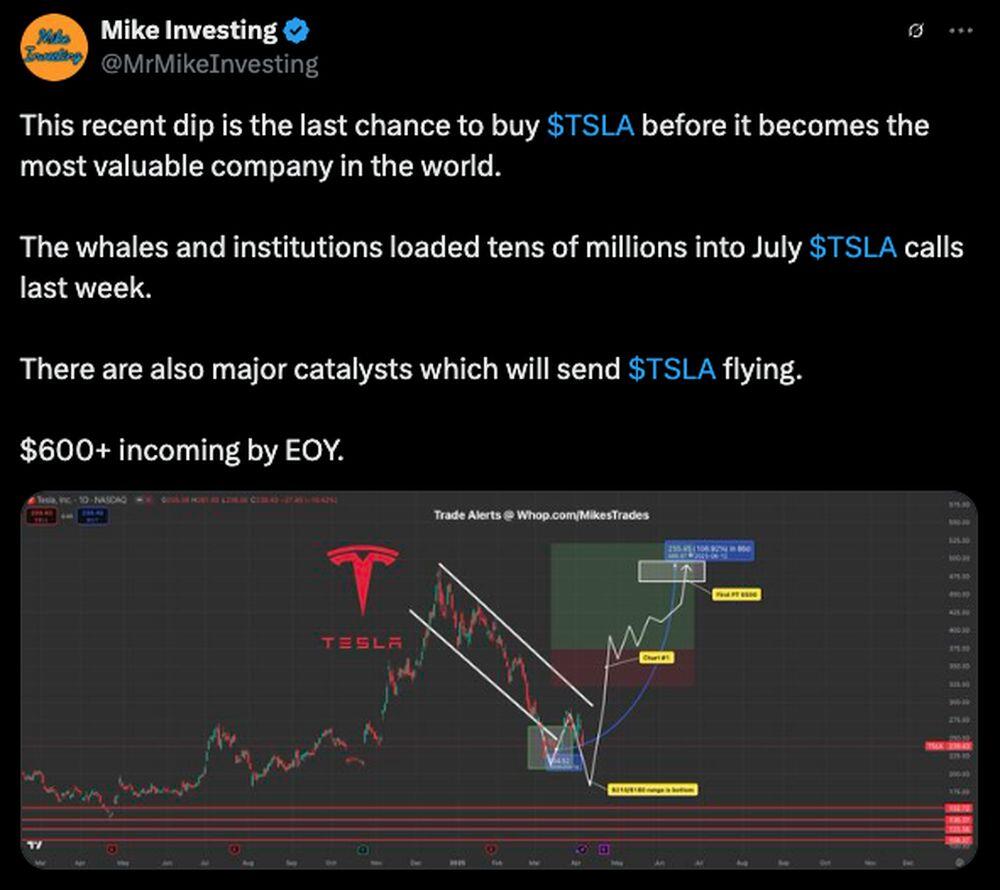
@MrMikeInvesting believes that the recent slump in the TSLA stock price is the last chance to open long trades before the bull rally. The user forecasts the asset to surge to at least $600.00 or more by the end of the year.
Overall, posts on the X social network reflect positive sentiment among private investors and traders towards the TSLA stock.
TSLA Price History
Tesla (TSLA) reached the highest price of $487.87 on 18.12.2024.
The lowest price of Tesla (TSLA) was recorded on 07.07.2010 when the stock declined to $0.99.
Tesla went public through an IPO in 2010. Since then, its stock has surged by over 1,575%. This impressive success stems from Tesla’s innovative business model. Elon Musk has revolutionized the auto industry, making Tesla the world’s most valuable automaker with a market cap of over $840 billion.
Tesla’s stock experienced significant gains at the end of 2019, driven by strong financial performance in the third and fourth quarters. The company has generated revenue of more than $6 billion with earnings per share of $1.86. Additionally, the expansion of Tesla’s Gigafactory Shanghai, which began producing Model Y vehicles, further boosted investor enthusiasm.
Despite the COVID-19 pandemic in 2020, Tesla boosted production by 71%, and critics were proven wrong as the company approached an annual output of 500,000 vehicles. From 2019 to 2021, the company’s stock price soared from $16.45 to an unprecedented $414.33.
In early 2022, TSLA’s uptrend reversed due to rising global inflation, the US Fed’s tighter monetary policy, and geopolitical tensions in Eastern Europe. Besides, Elon Musk’s $44 billion acquisition of Twitter, funded by selling a portion of his Tesla shares, drove a sharp drop in Tesla’s stock price.
However, by 2023, Tesla’s shares rebounded, reaching $299.27 amid a positive annual report showing $12.5 billion in net income, up from $5.5 billion in 2021.
In July 2023, the stock’s trend turned bearish again after Musk announced reduced production due to factory upgrades. Additionally, vague plans for an autonomous vehicle ecosystem disappointed investors, and Musk’s plans to invest $1 billion in the Dojo supercomputer for AI also raised doubts. The absence of clear timelines for the Cybertruck release further unsettled investors.
By March 2024, TSLA fell to $153.75, but it rebounded after reaching an agreement with Baidu to bring semi-autonomous driving technology to China.
Following a strong quarterly report, the stock surged to $273.49 in October 2024, with record profits of $2.2 billion. Moreover, Tesla plans to mass-produce the Cybercab robotaxi by 2026, targeting annual production of 2–4 million units.
Data released in April 2025 showed that Tesla’s Q1 sales were down 13% compared to the previous quarter, fueling concerns about a potential slowdown in growth. In addition, rumors began circulating about a possible management shakeup as Elon Musk appeared increasingly focused on his other projects, including SpaceX and Neuralink.
The key factor determining further stock performance will be the company’s ability to maintain production rates, develop and implement new technologies, as well as effectively manage operational risks.
TSLA Shares Fundamental Analysis
Like other financial instruments, TSLA’s stock price is influenced by numerous macroeconomic and geopolitical factors.
- Financial performance. Strong earnings reports bolster confidence among major market players in Tesla Inc.’s long-term growth prospects. Consistently rising profits suggest high demand for the company’s products, attracting new investors.
- High competition in the electric car industry. Chinese automakers’ rapid growth is putting pressure on Tesla in the global market, as prices for cars from China are nearly half of Tesla’s.
- Innovative technologies. On the one hand, large investments in technologies, including AI, make investors wary. On the other hand, they highlight the company’s large-scale development prospects.
- Geopolitical factors. Various armed conflicts force investors to hedge their risks with precious metals and other safe-haven assets. This reduces the popularity of stocks, including TSLA, and concerningly, the asset’s value may decline.
- Macroeconomic factors. The trade war between the US and China significantly impacts the stock market. Sanctions and higher trade tariffs to protect domestic markets directly affect electric vehicle production and Tesla’s stock price.
- Elon Musk’s statements. TSLA’s high volatility is partly due to the activity of Tesla Inc.’s founder on various social media platforms, particularly X. The entrepreneur’s high-profile statements have repeatedly caused major fluctuations in TSLA’s price.
More Facts About TSLA
Tesla Inc. was founded in 2003 and is headquartered in Austin, Texas. In addition to producing, repairing, and servicing vehicles, the company designs and installs solar energy generation and storage devices.
Tesla Inc. gained popularity thanks to its innovative approach to automotive engineering. Autonomous driving, robotaxis, and other AI-based technologies are how the company imagines the industry’s future.
However, due to the high cost of these innovations, the company’s stock remains quite volatile, attracting numerous traders. TSLA shares offer opportunities for profit in both the short and long term.
Year over year, the company’s revenues and capitalization continue to grow. Tesla remains dynamic, developing in a highly competitive environment, making it popular among market participants.
Advantages and Disadvantages of Investing in TSLA
This section examines the advantages and disadvantages of investing in the TSLA stock.
Advantages
- Attractive purchase price. The asset’s current price is significantly lower than the peak values of 2021, when the price reached 414.33. Certainly, there are no guarantees that the stock price will exceed those peak levels. However, expert forecasts, supported by technical analysis, inspire optimism. Large players buy and build up assets during temporary drawdowns to profit from future growth.
- Historical performance of TSLA stock prices. Positive financial earnings reports indicate increasing demand for the company’s products and its steady development. The company’s market capitalization is also growing, showing Tesla’s substantial potential.
- The company’s investments in innovative technology development. Tesla was the first to make a breakthrough in the automotive industry by creating an electric vehicle. Now, the company plans to produce autonomous vehicles and robotaxis. Additionally, the global shift to green energy will support TSLA’s growth.
Disadvantages
- High production costs for electric vehicles greatly boost Tesla’s vehicle prices. Tax benefits for electric cars are not particularly helpful, so consumers still face high costs. This, in turn, may negatively impact the company’s revenue, profit, and stock value.
- The company’s costly innovations may also harm Tesla’s stock. Increasingly, Chinese companies are entering the market with more affordable electric cars, already challenging Tesla’s position. Large expenditures on innovation may not pay off, potentially leading to worsening financial results for Tesla and, consequently, affecting the company’s stock price.
- High volatility enables traders and investors to achieve quick profits, but it also carries a high risk of losing investments. Therefore, before making trading decisions on TSLA stock, it’s essential to conduct a thorough fundamental and technical analysis.
How We Make Forecasts
The key components in forecasting various trading instruments, including the TSLA stock, are:
1. Fundamental analysis involving:
- evaluating forecasts from leading analysis agencies;
- assessing the company’s financial condition (market capitalization, income/expenses, earnings per share, business profitability, return on investment, and much more);
- analyzing the news environment around the company;
- examining geopolitical and macroeconomic factors that may affect the company’s stock price.
2. Technical analysis. A more successful conservative research model combines candlestick, chart, and indicator analysis. Signals from various technical tools help identify the most advantageous entry points and determine optimal profit targets.
Conclusion: Is TSLA a Good Investment?
Forecasting Tesla’s share price involves a high degree of uncertainty. Technological advances, changes in the global economy, competition, and regulatory factors significantly impact the price.
Therefore, the presented scenarios can only serve as general reference points rather than strict guidelines. Investors should consider potential risks, conduct their own research, and diversify their portfolios in order to make informed investment decisions.
TSLA Price Prediction FAQ
The current TSLA price is trading at $241.37 as of 21.04.2025.
Forecasts for Tesla’s share price vary widely, reflecting the high volatility and uncertainty surrounding the company. Many analysts expect the price to reach $307.65–$444.66 by the end of 2025. Other platforms anticipate a decline to $210.00.
Tesla’s upside potential hinges on the company’s ability to maintain momentum in electric vehicle sales and successfully roll out new technologies, such as autonomous driving solutions. Upbeat outlooks point to a price increase to $444.66 by the end of the year, while negative projections indicate a decrease to $144.00–$210.00.
Tesla stock’s 52-week low and high are $138.80 and $488.54, respectively, reflecting significant fluctuations driven by news about production performance, management changes, and general market trends.
The forecast for Tesla shares for 2026 is based on the expectation of a production ramp-up and expansion of the company’s global presence. The stock may range from $174.23 to $323.00. More conservative forecasts indicate that the price will trade within a narrow range between $232.51 and $265.71.
Optimistic scenarios suggest a significant jump to $958.40–$1,750.00 in Tesla’s share price by 2030. Conservative experts give more moderate forecasts and anticipate an increase to $624.38 in 2027–2030.
According to some estimates, the Tesla stock price may climb to $958.40–$1,750.00 by 2030, buoyed by technological leadership, competitiveness, a favorable regulatory environment, and global economic trends.
The upside potential of Tesla’s stock price hinges on several key factors, including the company’s ability to continue implementing innovative solutions, manage production efficiently, and adapt to changing market conditions. Investors should weigh the risks and opportunities associated with the company when making any decisions.
As of April 2025, the consensus rating from 32 analysts is “Hold.” However, recommendations on TSLA stock vary depending on factors such as investment horizon, risk tolerance, and expectations for the company’s long-term outlook.
Price chart of TSLA in real time mode

The content of this article reflects the author’s opinion and does not necessarily reflect the official position of LiteFinance broker. The material published on this page is provided for informational purposes only and should not be considered as the provision of investment advice for the purposes of Directive 2014/65/EU.
According to copyright law, this article is considered intellectual property, which includes a prohibition on copying and distributing it without consent.
{{value}} ( {{count}} {{title}} )
This post is originally published on LITEFINANCE.


