Silver, classified as both a precious and industrial metal, has a special place in the global market due to its extensive utility and investment opportunities. It is utilized in various industrial sectors, ranging from electronics to renewable energy sources. Moreover, it is popular with investors as a hedge against inflation.
This article focuses on the factors that could impact the XAGUSD price forecast for 2024 and beyond, offering trading ideas and analysis to guide you through the precious metals market. Given silver’s distinctive position in the market, its price forecasts will be especially relevant for those who want to diversify their investment portfolio or protect capital against inflation.
The article covers the following subjects:
Highlights and Key Points: Silver Price Predictions 2024–2030
- Current Silver Price: As of today, silver trades at $30.849, reflecting its sensitivity to global manufacturing demand and market volatility.
- Most analysts and experts anticipate silver’s growth to $32 – $42 per troy ounce by the end of 2024. Optimistic forecasts predict a potential rise to $46. According to more conservative and moderate forecasts, the defensive asset may reach $30 – $32 per ounce by the end of the year.
- Analysts predict that the precious metal will continue its upward trend in 2025. Longforecast and Coin Price Forecast project the price to reach $40.71 – $55.87 per troy ounce. According to optimistic forecasts, the XAGUSD quotes may reach $53 – $56. At the same time, several analytical agencies offer a more moderate forecast, anticipating a price range of $33 – $40 per ounce.
- Most experts predict that silver prices will trade around $33 – $44 per troy ounce in 2026. In addition, some analysts suggest that the price may range between $63 and $68.
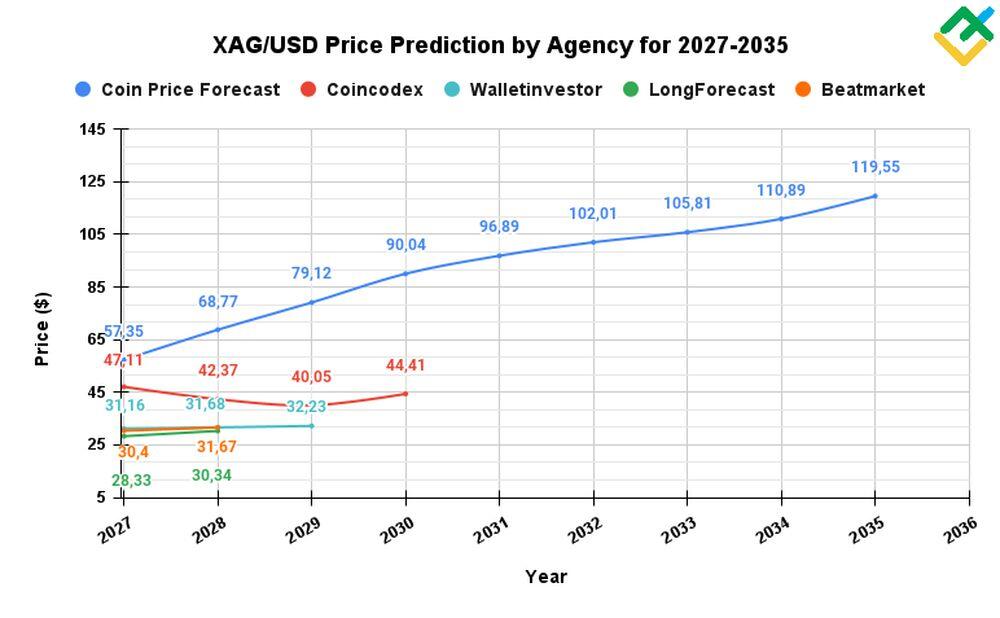
- Predictions for 2027–2035 are mixed. Many experts anticipate the prices to range between $33 and $40. More optimistic forecasts suggest that the asset could reach $56 by 2030. Coin Price Forecast predicts an increase in the asset value to $162 per troy ounce by 2035.
Silver Price Today, Coming Days and Week
When forecasting silver prices for the nearest term, focus on several critical factors. Monitor global economic indicators, such as GDP growth and industrial demand, as silver is widely used in manufacturing. Pay attention to changes in monetary policy, especially interest rate decisions by central banks, as these influence precious metal prices.
Track geopolitical events and market sentiment, as these can drive safe-haven demand. Observe fluctuations in the US dollar, as silver prices typically move inversely to it. Additionally, consider supply dynamics, including mining production and inventory levels, which can impact the balance between supply and demand.
Silver Price Forecast for 2024 — Experts Predictions
Many analytical agencies offer optimistic forecasts for silver prices for the second half of 2024. Experts anticipate prices for the precious metal to trade above $30 per troy ounce.
The key factors influencing the XAGUSD price this year include increasing demand, potential interest rate cuts by the US Federal Reserve and other central banks in the next six months, as well as escalating geopolitical tensions.
TradingEconomics
Price Range in 2024: $29.88 – $32.05 (as of July 10, 2024)
According to TradingEconomics, the silver price has surged by 30.69%, equivalent to $7.29 per ton, since the start of 2024. Based on TradingEconomics’ macro models and analysts’ expectations, the price of the precious metal will range between $29.88 and $32.05 in the next 6-12 months.
Predict-Price
Price Range in 2024: $26.24 – $46.17 (as of July 10, 2024)
According to Predict-Price’s artificial intelligence calculations, in an optimistic scenario the price will achieve the $46.17 level in the current year. At the same time, if a negative scenario is realized, the quotes may fall to $26.24. The price is expected to remain neutral for the next 6 months.
CoinPriceForecast
Price Range in 2024: $29.44 – $42.16 (as of July 10, 2024)
According to CoinPriceForecast, the price will likely rise to $42.16 per troy ounce by the end of 2024.
| Year | Mid-Year, $ | Year-End, $ |
|---|---|---|
| 2024 | 29.44 | 42.16 |
Long Forecast
Price Range in 2024: $29.00 – $39.46 (as of July 10, 2024)
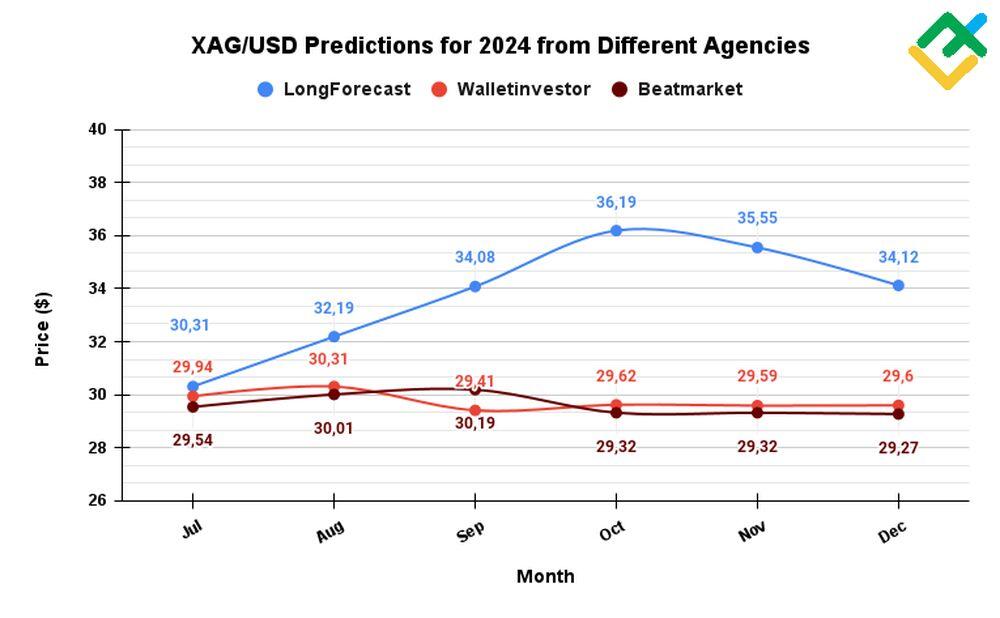
LongForecast analysts expect the XAGUSD price to rise to $35.10 by the end of October 2024, hitting the first swing high since February 2012. By the end of the year, experts anticipate a further growth to $37.16 – $41.43 with the closing price at $39.46 per ounce.
| Month | Open, $ | Low-High, $ | Close, $ |
|---|---|---|---|
| July | 29.44 | 29.00-35.31 | 32.66 |
| August | 32.66 | 29.82-36.03 | 34.31 |
| September | 34.31 | 31.40-34.70 | 33.05 |
| October | 33.05 | 33.05-36.86 | 35.10 |
| November | 35.10 | 35.10-39.02 | 37.16 |
| December | 37.16 | 37.16-41.43 | 39.46 |
WalletInvestor
Price range in 2024: $29.07 – $32.24 (as of July 10, 2024)
WalletInvestor forecasts the price to range between $29.07 and $32.24 per troy ounce for the next six months of 2024. By the end of the third quarter, the price is expected to trade around $32.05. By the end of the year, the price is expected to be $31.37 per troy ounce.
| Month | Opening, $ | Closing, $ | Minimum, $ | Maximum, $ |
|---|---|---|---|---|
| July | 29.09 | 29.94 | 29.07 | 29.94 |
| August | 31.65 | 32.05 | 31.60 | 32.05 |
| September | 32.18 | 31.16 | 31.16 | 32.24 |
| October | 31.12 | 31.38 | 31.04 | 31.39 |
| November | 31.34 | 31.36 | 31.30 | 31.42 |
| December | 31.37 | 31.37 | 31.19 | 31.37 |
CoinCodex
Price range in 2024: $30.53 – $40.19 (as of July 10, 2024)
According to CoinCodex, the instrument may reach $38.59 by the end of 2024, increasing by 24.36%.
Сurrently, XAGUSD is above the SMA50 level of $30.11. It has also exceeded the MA200 mark of $26.19. With that being said, analysts see the current market sentiment as bullish.
| Year | Minimum, $ | Maximum, $ |
|---|---|---|
| 2024 | 30.53 | 40.19 |
Beatmarket
Price range in 2024: $31.00 – $34.26 (as of July 10, 2024)
Beatmarket offers a moderate forecast for the XAGUSD rate over the next six months. The quotes will likely range between $31.00 and $34.26 per troy ounce by the end of 2024. The main factors influencing the price include the following fundamental factors:
- an increase in demand for silver will likely help to raise its value;
- the potential reduction in the interest rate of the US Fed, along with monetary policy easing, may also positively impact the prices.
| Date | Minimum, $ | Maximum, $ |
|---|---|---|
| August | 31.00 | 34.26 |
| September | 31.16 | 32.24 |
| October | 31.04 | 31.39 |
| November | 31.30 | 31.42 |
| December | 31.19 | 31.37 |
Capex
Price range in 2024: $28.75 – $30.00 (as of July 10, 2024)
According to Capex, the price may overcome the psychological level of $30.00 per ounce in the current year. However, analysts note that in 2021, the growth of the precious metal repeatedly stopped at this level. If the quotes break through this mark, the growth may continue.
The main fundamental factors highlighted by experts include:
- the pace of interest rate hikes by central banks and the regulators’ rhetoric on monetary policy;
- escalation of the conflict between Russia and Ukraine, as well as the development of the conflict between Israel and Palestine;
- slowdown in global economic growth and moderate recession in developed countries.
The Silver Institute
Price range in 2024: $25.00 – $48.00 (as of July 10, 2024)
The Silver Institute’s experts forecast a possible increase in the value of the asset in 2024 up to $48.00 per ounce. This year, the global demand for the metal will likely grow to 1.2 billion ounces, marking only the second instance of such growth in recorded history. The main factors affecting the metal prices are:
- geopolitical tensions and escalation of armed conflicts in the world;
- the elections in the USA, the European Union, and other countries.
Silver Technical Analysis
To forecast the short- and medium-term movements of the XAGUSD rate, it is important to use 4-hour, daily, weekly, and monthly time frames. Technical indicators such as MACD, Stochastic oscillator, OBV, tick volumes, and VWAP in combination with the SMA20 can provide a more detailed analysis of silver. These tools are essential for monitoring market volumes, oversold/overbought zones, the strength of the current trend, as well as potential pivot points.
Along with technical indicators, it is recommended to use candlestick and chart analysis. Unlike technical indicators, candlestick patterns offer earlier signals for trend continuation or reversal. These patterns enable traders to open positions at a more favorable price and set reasonable stop-loss levels.
Common candlestick and chart patterns seen on XAGUSD price charts include various types of “Triangles,” “Engulfing” patterns, a “Hammer/Hanging man,” a “Pennant,” and other patterns.
Before delving into a detailed analysis, it is necessary to examine the asset’s monthly chart and determine the current market conditions along with key support and resistance levels.
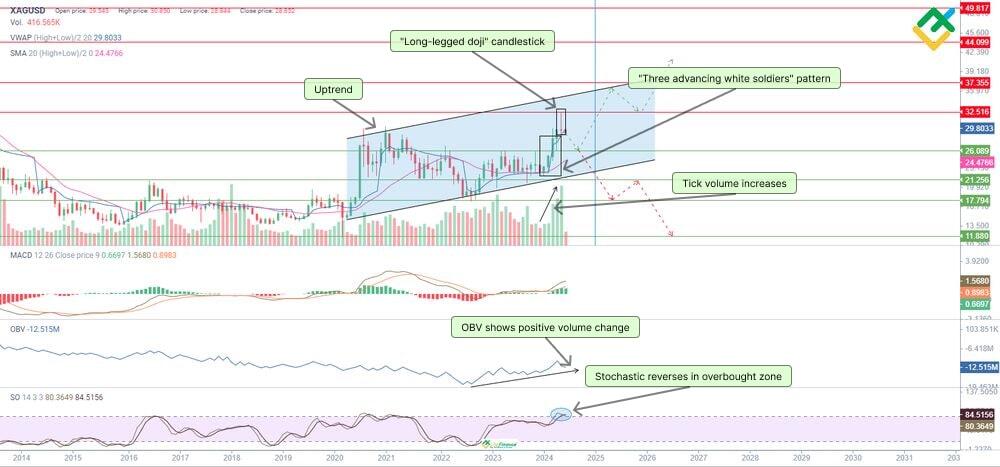
The silver daily chart indicates that the price has settled near 28.78 within an uptrend. In May 2024, the quotes rose above the swing high for the first time since December 2012, hitting 32.50 per troy ounce.
The silver price intensively grew due to the formation of a “Three white soldiers” candlestick pattern, indicating a continuation of the uptrend. However, after reaching above the highest price, the asset formed a “Long-legged doji” candlestick, signaling market uncertainty and the potential downward correction to 26.08.
Nevertheless, tick volume is increasing significantly, indicating heightened bullish activity and interest in long trades. The On Balance Volume indicator (OBV) also shows the growth of cash flows into the asset.
The MACD values are decreasing in the positive zone, showing the weakening of the uptrend. The Stochastic indicator values reverse downward in the overbought zone, signaling the weakening of bulls and a probable downward correction in the near future.
The current silver price is below the weighted average price (VWAP) indicator but above the SMA20 line, underscoring market uncertainty and a possible reversal of the uptrend.
A preliminary assessment of the asset shows that the bullish rally is fading, and the price may correct to 26.08 and reverse upward to 32.51–49.81.
Get access to a demo account on an easy-to-use Forex platform without registration
XAG Analysis For Next Three Months
Let us analyze the 4-hour and daily charts to determine the silver rate in the coming months.
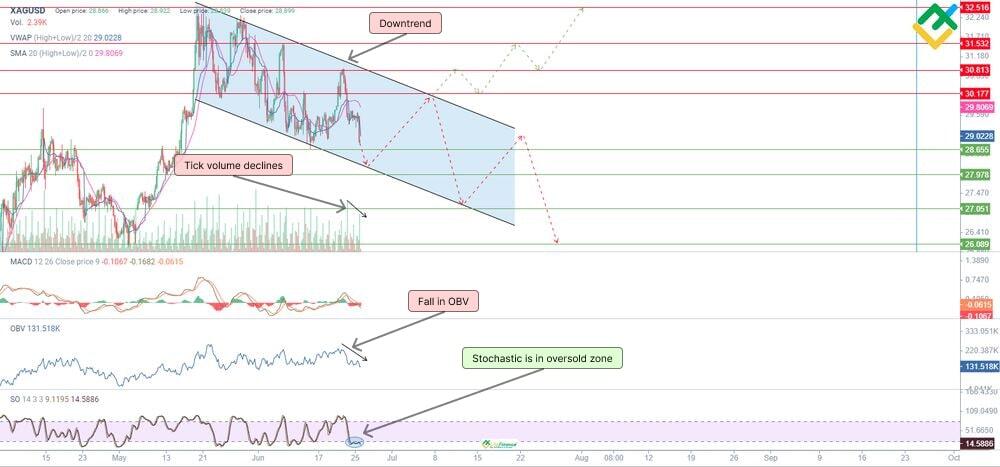
The 4-hour chart shows that silver trades within a downtrend, which began after reaching above the swing high.
The VWAP and SMA20 are above the price, indicating bearish pressure. Decreasing market and tick volume suggest that traders are gradually taking profits and the asset liquidity is outflowing.
The MACD is declining in the negative zone with new strength, emphasizing the bears’ stability and their intent to drag the price lower. However, the stochastic indicator is fluctuating in the oversold zone, signaling that the asset may rebound upwards soon.
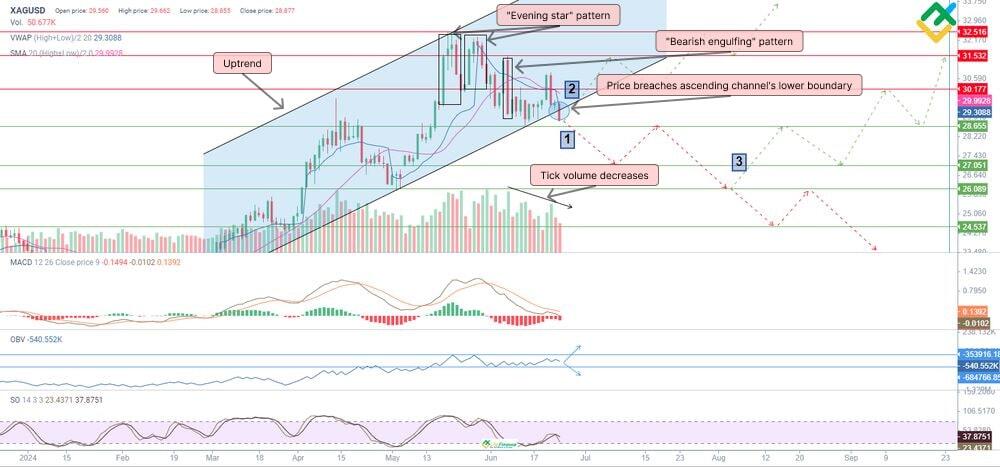
The daily chart confirms that the uptrend has reversed, showing that the price broke through the lower boundary of the uptrend. “Evening star” and “Bearish engulfing” candlestick patterns near the resistance 30.17–31.53 levels have signaled a decline.traders
The MACD values have resumed the decline in the negative zone after trying to reach the zero boundary. This indicates that the downward movement is gaining strength. The stochastic indicator values also turned downward after bouncing off the lower boundary of the range.
The tick volume is dropping, demonstrating the decreasing trader’s interest in the asset. The values of the On Balance Volume (OBV) indicator vary in a narrow range, which also confirms that large traders are setting the profit-taking orders. The VWAP and SMA20 are above the price on the chart, which signals to open short trades.
In the current situation, three scenarios of further price movement in the coming months can be considered:
- After breaking through the lower boundary of the ascending channel, the price will continue to fall to the support of 28.65. If the price breaches the support, traders will likely open short trades with the targets near 27.05–24.53 and below.
- If bulls manage to hold the price at the key support 28.65, the quotes may increase, forming a “Bear trap” pattern, and return to the ascending channel, continuing growth to 30.17–32.51.
- The third scenario suggests the price may decline to the 26.08 level with further price reversal in August 2024. After the correction to 26.08, the price may continue to recover to 27.05–31.53 by the end of the quarter.
Long-Term Silver Technical Analysis for 2024
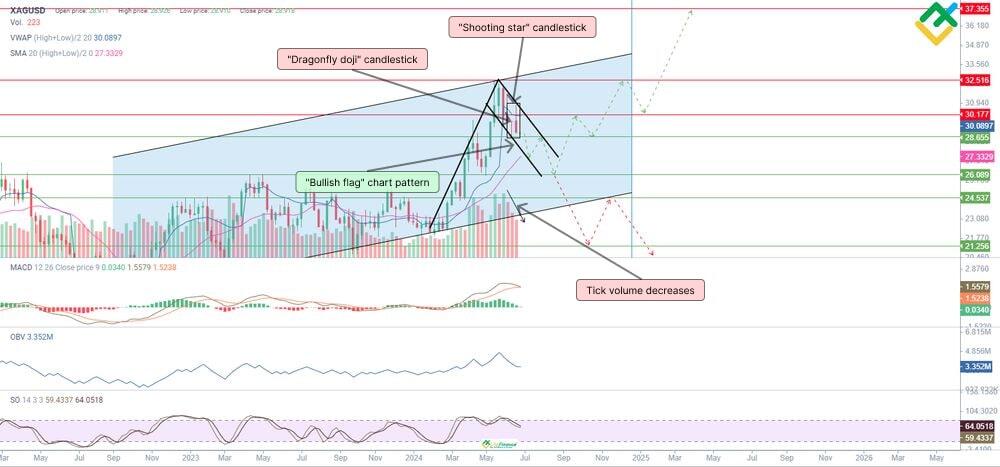
The daily chart shows that the silver price is trading in a downward correction with an emerging “Bull flag” pattern. The bullish “Dragonfly doji” pattern has formed at the swing high, signaling market uncertainty and price decline.
A “Shooting star” pattern has formed next, signaling a trend reversal or a downward correction. Mostly, it indicates the correction. Along with these patterns, tick and market volumes are decreasing, which is also typical for the “Bull flag” pattern.
The MACD is decreasing in the positive zone, approaching the zero mark, which indicates a waning uptrend. The stochastic indicator has reversed near the upper boundary and is directed downward, generating a sell signal.
The VWAP indicator is above the current market price. However, the SMA20 is still below the price on the chart, emphasizing the market’s uncertainty.
If the asset consolidates below 28.65, the price may decline, at least to 26.08. If bulls do not react at this level, the uptrend will reverse, and the price will likely fall to 24.53–21.25 by the end of the year.
If bulls manage to hold the price at 26.08, and the asset breaks through the upper boundary of the “Bull flag” pattern on upward momentum, silver will return to 28.65–32.51.
The table below shows the forecasted values of price lows and highs for the current year.
| Month | Forecasted XAGUSD values | |
|---|---|---|
| Low | High | |
| July 2024 | 26.25 | 28.91 |
| August 2024 | 25.94 | 29.13 |
| September 2024 | 28.65 | 31.13 |
| October 2024 | 29.43 | 31.27 |
| November 2024 | 28.95 | 31.40 |
| December 2024 | 30.96 | 32.27 |
Long-Term Trading Plan for Silver (XAG)
The asset may grow further within a large uptrend after the downward correction to 26.08.
Trading Plan for Next Three Months
The trading plan for silver for the coming months according to the technical analysis:
- the silver price has reached below the lower boundary of the uptrend on the daily chart, implying the continuation of the downtrend to the key support level of 26.08. Then, the quotes will likely start to climb and may reach 31.53 by the end of the quarter;
- it is also possible that the bulls are currently forming a “Bear trap” pattern, and the price may bounce from 28.65 with further growth to 31.53–32.51;
- the key support levels are 28.65, 27.05, 26.08, and 24.53;
- the key resistance levels are 30.17, 31.53, and 32.51.
Trading Plan for 2024
The trading plan for silver for the current year, based on the research conducted:
- The quotes are likely correcting within the “Bull flag” chart pattern to 26.08. The price may rebound from this level and grow to 28.65–37.35, reaching 32.51 by the end of the year;
- otherwise, if the price breaks through 26.08, the uptrend will reverse with the targets near 24.53–21.25 by the end of this period;
- the key support levels are 28.65, 26.08, 24.53, and 21.25;
- the key resistance levels for the current year are 30.17, 32.51, and 37.35.
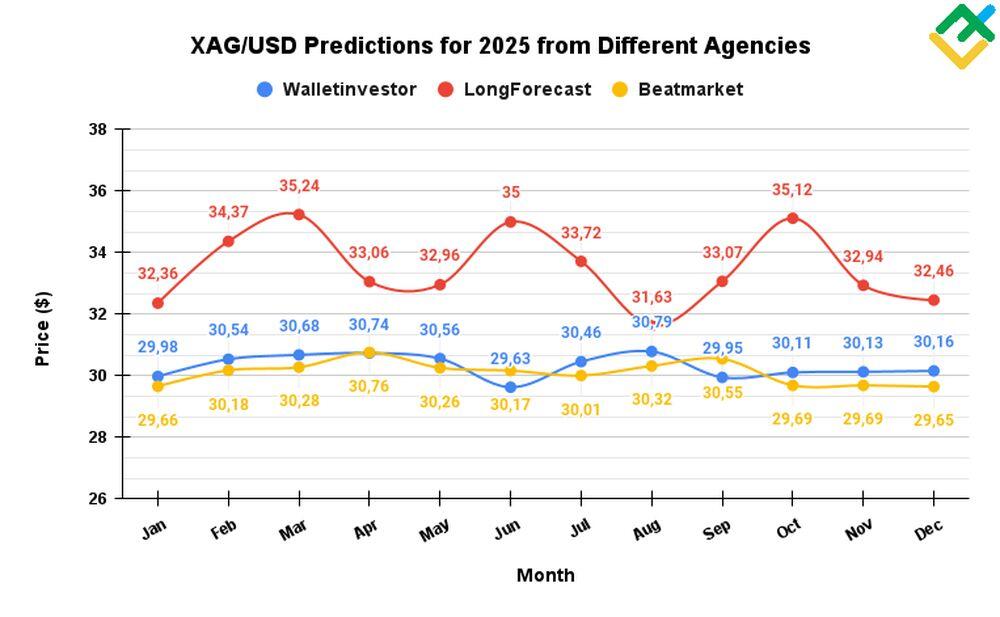
Silver Price Forecast of 2025 — Experts Predictions
The overall price outlook for 2025 remains positive and assumes continued growth of the XAGUSD price in the range of $33 – $56 per troy ounce.
Predict-Price
Price range in 2024: $25.05 – $54.95 (as of July 10, 2024)
Analytical portal Predict-Price predicts that in the case of an optimistic scenario, the price may reach $54.95 per ounce. In the negative scenario, the asset may fall to $25.05.
LongForecast
Price range in 2025: $32.77 – $40.71 (as of July 10, 2024)
According to LongForecast predictions, the price will stand at $38.77 at the beginning of the year. The annual high will be hit in January, with prices potentially reaching $40.71 per troy ounce. Experts anticipate the price to fluctuate between $32.77 and $40.35 for the rest of the year. At the same time, the annual low will be $32.77 in October, with a closing price of around $38.30 in December.
| Month | Open, $ | Min–Max, $ | Close, $ |
|---|---|---|---|
| January | 39.46 | 36.83-40.71 | 38.77 |
| February | 38.77 | 35.35-39.07 | 37.21 |
| March | 37.21 | 33.53-37.21 | 35.29 |
| April | 35.29 | 35.29-39.35 | 37.48 |
| May | 37.48 | 36.51-40.35 | 38.43 |
| June | 38.43 | 34.25-38.43 | 36.05 |
| July | 36.05 | 34.14-37.74 | 35.94 |
| August | 35.94 | 35.94-40.08 | 38.17 |
| September | 38.17 | 34.93-38.61 | 36.77 |
| October | 36.77 | 32.77-36.77 | 34.49 |
| November | 34.49 | 34.26-37.86 | 36.06 |
| December | 36.06 | 36.06-40.22 | 38.30 |
CoinCodex
Price Range in 2025: $30.45 – $53.77 (as of July 10, 2024)
According to CoinCodex, the price will vary in a wide range between $30.45 and $53.77 in 2025. By the end of the year, analysts expect silver’s value to rise to $51.64 per troy ounce.
| Year | Minimum, $ | Maximum, $ |
|---|---|---|
| 2025 | 30.45 | 53.77 |
CoinPriceForecast
Price Range in 2025: $51.33 – $55.87 (as of July 10, 2024)
According to CoinPriceForecast, the asset’s price may increase to $51.33 per ounce by the middle of 2025. At the end of the year, analysts forecast price growth up to $55.87.
| Year | Mid-Year | Year-End |
|---|---|---|
| 2025 | 51.33 | 55.87 |
WalletInvestor
Price range in 2025: $31.390 – $32.929 (as of July 10, 2024)
WalletInvestor forecasts that the price will fluctuate between $31.39 and $32.93 in the first half of 2025, with the closing price in June at $31.765 per troy ounce. In the second half of the year, the quotes will vary between $31.70 and $32.80, reaching $31.93 by the end of the year.
| Date | Opening, $ | Closing, $ | Minimum, $ | Maximum, $ |
|---|---|---|---|---|
| January | 31.400 | 31.750 | 31.390 | 31.776 |
| February | 31.814 | 32.302 | 31.814 | 32.315 |
| March | 32.393 | 32.443 | 32.283 | 32.443 |
| April | 32.467 | 32.483 | 32.467 | 32.929 |
| May | 32.426 | 32.307 | 32.083 | 32.426 |
| June | 32.346 | 31.765 | 31.765 | 32.346 |
| July | 31.747 | 32.198 | 31.700 | 32.198 |
| August | 32.168 | 32.549 | 32.155 | 32.549 |
| September | 32.694 | 31.715 | 31.715 | 32.802 |
| October | 31.701 | 31.895 | 31.611 | 31.949 |
| November | 31.911 | 31.921 | 31.857 | 31.973 |
| December | 31.932 | 31.931 | 31.737 | 31.932 |
Beatmarket
Price range in 2025: $31.39 – $32.93 (as of July 10, 2024)
Analysts from Beatmarket offer conservative forecasts for the XAGUSD rate in 2025. At the beginning of the year, the price will likely trade in the range of $31.39 – $31.78. The price peak will be reached in April, ranging from a low of $32.47 to a high of $32.93. By the end of the year, the price will likely trade between $31.74 and $31.93. Experts attribute these fluctuations to the dynamics of interest rates and the demand for the precious metal.
| Date | Minimum, $ | Maximum, $ |
|---|---|---|
| January | 31.39 | 31.78 |
| February | 31.81 | 32.32 |
| March | 32.28 | 32.44 |
| April | 32.47 | 32.93 |
| May | 32.08 | 32.43 |
| June | 31.77 | 32.35 |
| July | 31.70 | 32.20 |
| August | 32.16 | 32.55 |
| September | 31.72 | 32.80 |
| October | 31.61 | 31.95 |
| November | 31.86 | 31.97 |
| December | 31.74 | 31.93 |
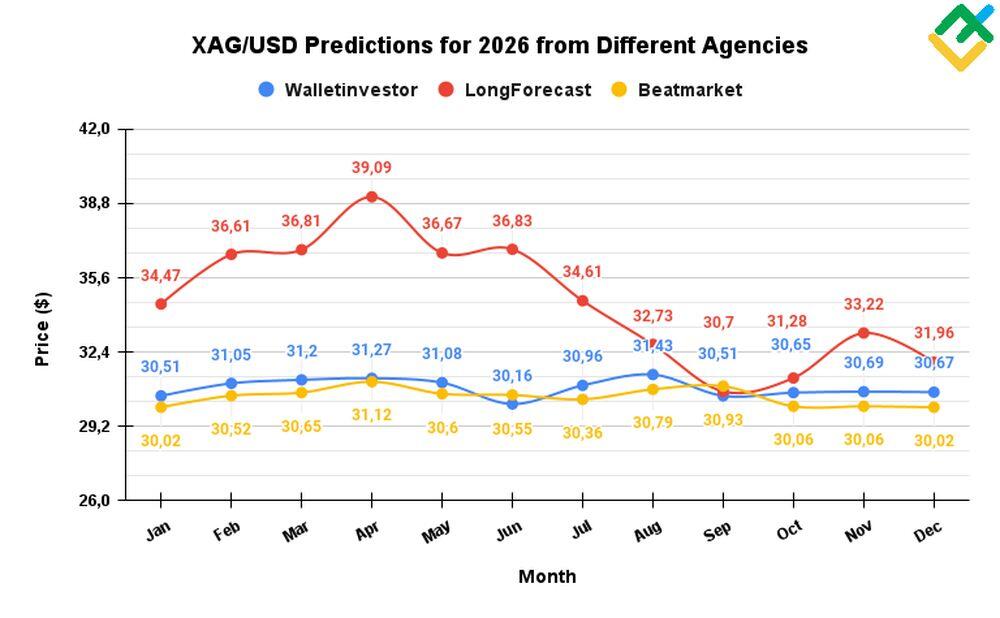
Silver Price Forecast of 2026 — Experts Predictions
According to the forecasts of many reputable analytical agencies, the silver price will trade mostly above $30.00 per troy ounce in 2026. Nevertheless, some experts give rather pessimistic forecasts, expecting the price to fall to $23 per ounce.
Growing demand from industrial production and limitations of silver mining may boost the price in 2026.
CoinCodex
Price range in 2026: $33.00 – $44.20 (as of July 10, 2024)
According to CoinCodex, the XAGUSD price is projected to range between $33 and $44.20 in 2026. This forecast suggests the continuation of the bullish trend.
| Year | Minimum, $ | Maximum, $ |
|---|---|---|
| 2026 | 33.00 | 44.20 |
Beatmarket
Price range in 2026: $31.92 – $33.47 (as of July 10, 2024)
According to Beatmarket, silver will vary between $31.92 and $33.47 in the first quarter of 2026. In the second quarter, the price will likely fluctuate, reaching a high of $33.20 in August. In September, the asset will rise to an annual high of $33.36. By the end of the year, the price will fluctuate between $32.29 and $32.49 per troy ounce.
| Date | Minimum, $ | Maximum, $ |
|---|---|---|
| January | 31.92 | 32.32 |
| February | 32.35 | 32.84 |
| March | 32.84 | 32.99 |
| April | 33.03 | 33.47 |
| May | 32.62 | 32.95 |
| June | 32.31 | 32.91 |
| July | 32.26 | 32.74 |
| August | 32.70 | 33.20 |
| September | 32.29 | 33.36 |
| October | 32.16 | 32.50 |
| November | 32.41 | 32.53 |
| December | 32.29 | 32.49 |
Predict-Price
Price range in 2026: $23.49 – $63.73 (as of July 10, 2024)
According to Predict-Price‘s AI analysis, the silver price may reach $63.73 and $23.49 in 2026 in the best and worst-case scenarios, respectively.
LongForecast
Price range in 2026: $32.42 – $44.76 (as of July 10, 2024)
According to LongForecast, the price is expected to rise in the first half of 2026 within a wide range of $35.93 – $42.63. The highest level may be $44.76 per troy ounce in June. In the second half of the year, the silver price may decline and stabilize within the range of $34.13 – $40.17. At the end of the year, the asset will likely trade around $34.13 per ounce.
| Month | Open, $ | Min–Max, $ | Close, $ |
|---|---|---|---|
| January | 38.30 | 34.13-38.30 | 35.93 |
| February | 35.93 | 33.63-37.17 | 35.40 |
| March | 35.40 | 35.40-39.47 | 37.59 |
| April | 37.59 | 37.59-41.92 | 39.92 |
| May | 39.92 | 38.13-42.15 | 40.14 |
| June | 40.14 | 40.14-44.76 | 42.63 |
| July | 42.63 | 37.99-42.63 | 39.99 |
| August | 39.99 | 38.16-42.18 | 40.17 |
| September | 40.17 | 35.86-40.17 | 37.75 |
| October | 37.75 | 33.92-37.75 | 35.70 |
| November | 35.70 | 31.82-35.70 | 33.49 |
| December | 33.49 | 32.42-35.84 | 34.13 |
Coin Price Forecast
Price range in 2026: $60.88 – $68.87 (as of July 10, 2024)
CoinPriceForecast predicts that the precious metal will rise to $60.88 per troy ounce by the middle of 2026 and to $68.87 by the end of the year.
| Year | Mid-Year | Year-End |
|---|---|---|
| 2026 | 60.88 | 68.87 |
WalletInvestor
Price range in 2026: $31.921 – $33.474 (as of July 10, 2024)
WalletInvestor offers conservative forecasts for the silver price in 2026. During the year, the silver quotes will likely trade in a narrow range of $31.92 – $33.74. The year’s highest price will be reached in April at $33.74 and the lowest — in January at $31.92. At the end of the year, the value of the asset will likely be around $32.47 per ounce.
| Date | Opening, $ | Closing, $ | Minimum, $ | Maximum, $ |
|---|---|---|---|---|
| January | 31.940 | 32.290 | 31.921 | 32.317 |
| February | 32.354 | 32.825 | 32.354 | 32.836 |
| March | 32.924 | 32.979 | 32.844 | 32.985 |
| April | 33.029 | 33.039 | 33.029 | 33.474 |
| May | 32.954 | 32.850 | 32.624 | 32.954 |
| June | 32.900 | 32.313 | 32.313 | 32.905 |
| July | 32.319 | 32.712 | 32.258 | 32.738 |
| August | 32.762 | 33.203 | 32.701 | 33.203 |
| September | 33.230 | 32.294 | 32.294 | 33.358 |
| October | 32.252 | 32.453 | 32.161 | 32.504 |
| November | 32.471 | 32.496 | 32.414 | 32.526 |
| December | 32.479 | 32.471 | 32.287 | 32.486 |
Silver: A Historical Overview
Silver is a precious metal used in jewelry, cutlery, electronics, and as an investment tool. Its price movements can indicate economic conditions and influence other financial markets. Silver’s history as an asset dates back thousands of years.
In the 1970s, silver trading began at $1.80 per troy ounce. Prices hit a record of $49.45 in 1980 when the Hunt brothers cornered the market. Silver spiked to $20 during the 2008 crisis before falling again. The highest price was around $50 in 2011.
Silver’s future trajectory remains uncertain. Its price reflects a balance of industrial and investment demand with mining supply. Continued volatility is expected, with the potential for substantial upswings and pullbacks. Tracking silver’s price provides insights into economic forces and precious metals markets.
Demand for Silver
Based on the Silver Institute‘s annual report, silver will likely be in deficit for the fourth consecutive year. At the same time, silver has surpassed gold in the current 2024 growth rate.

According to the Silver Institute and several other experts’ forecasts, industrial demand for silver will grow to a new record of 1.2 billion ounces this year, leading to an even greater asset shortage and positively impacting the XAGUSD prices.
According to the report, the industrial sector’s demand for the metal increased by 11% in 2023, reaching a record 654.4 million ounces. For the current year, the industrial demand may increase by 9%, while the metal deficit could rise by 17%, to 215.3 million ounces.
In addition, silver production in 2024 may be affected by problems at the largest metal producers in Mexico and Peru. These countries are at multi-year supply lows, while finding new fields require 10–15 years of preparation.
In addition, the green industry and solar energy provide significant support for the prices, as their silver demand has recently increased significantly. Silver is actively used by the “green” business for the production of solar panels and photovoltaic modules, as well as the production of electric cars. Demand from the green sector is forecast to increase to 90 million ounces by 2025.
Investment demand for silver as a traditional safe-haven asset is also high. Rising geopolitical tensions worldwide and the US Fed’s hawkish rhetoric monetary policy also help to increase the demand.
Long-Term Silver Price Predictions 2027–2030
Let’s take a look at the future outlook for the price of silver.
CoinPriceForecast
According to CoinPriceForecast, the price of the precious metal will steadily increase in the next decade. Thus, the asset may almost reach $80, being $79.89 per troy ounce by the end of 2027. The silver price will likely increase to $107.87 per ounce by the end of 2030 and $162.32 by the end of 2035.
| Year | Mid-Year | Year-End |
|---|---|---|
| 2027 | 75.80 | 79.89 |
| 2028 | 81.92 | 83.33 |
| 2029 | 88.65 | 95.90 |
| 2030 | 102.13 | 107.87 |
| 2031 | 114.80 | 121.69 |
| 2032 | 123.40 | 125.21 |
| 2033 | 131.47 | 137.70 |
| 2034 | 143.90 | 150.07 |
| 2035 | 156.21 | 162.32 |
Beatmarket
Beatmarket forecasts neutral dynamics for the silver price in 2027–2028. During 2027, the quotes will likely fluctuate in the range of $32.45 – $34.02. In 2028, the dynamics of the asset will remain neutral, and the price will move in a sideways channel within the range of $33.07 – $35.00 per troy ounce.
Experts attribute the slight increase in the asset’s value in 2028 to the growing demand for solar energy and green technologies.
| Date | Minimum, $ | Maximum, $ |
|---|---|---|
| 2027 | ||
| January | 32.45 | 32.86 |
| February | 32.89 | 33.36 |
| March | 33.40 | 33.54 |
| April | 33.56 | 34.02 |
| May | 33.17 | 33.46 |
| June | 32.88 | 33.46 |
| July | 32.82 | 33.28 |
| August | 33.25 | 33.74 |
| September | 32.85 | 33.92 |
| October | 32.70 | 33.06 |
| November | 32.96 | 33.08 |
| December | 32.84 | 33.05 |
| 2028 | ||
| January | 33.07 | 33.44 |
| February | 33.44 | 33.99 |
| March | 33.94 | 35.00 |
| April | 34.18 | 34.58 |
| May | 33.72 | 34.07 |
| June | 33.39 | 34.01 |
| July | 33.36 | 33.86 |
| August | 33.81 | 34.33 |
| September | 33.37 | 34.47 |
| October | 33.25 | 33.61 |
| November | 33.51 | 33.63 |
| December | 33.40 | 33.55 |
CoinCodex
According to CoinCodex, the asset price in 2027–2030 will range between $33.20 and $49.78. At the same time, the average price per troy ounce of silver will be $37.98 by 2030.
| Year | Minimum, $ | Maximum, $ |
|---|---|---|
| 2027 | 33.20 | 49.78 |
| 2028 | 36.99 | 44.77 |
| 2029 | 33.64 | 42.32 |
| 2030 | 34.51 | 46.93 |
Long Forecast
According to LongForecast, the silver price will show mixed performance in the first half of 2027 and trade in the $27.58 – $38.06 range. In the second half of the year, the price will decline, reaching its low in September at $27.58. By the end of the year, the price is expected to recover slightly to $30.71.
In 2028, the price will also be volatile and fluctuate in the range of $27.78 – $34.48 until July. The closing price for the end of August may be $32.98 per ounce.
| Month | Open, $ | Min–Max, $ | Close, $ |
|---|---|---|---|
| 2027 | |||
| January | 34.13 | 34.13-38.06 | 36.25 |
| February | 36.25 | 33.14-36.62 | 34.88 |
| March | 34.88 | 33.95-37.53 | 35.74 |
| April | 35.74 | 32.28-35.74 | 33.98 |
| May | 33.98 | 33.98-37.89 | 36.09 |
| June | 36.09 | 32.21-36.09 | 33.91 |
| July | 33.91 | 30.22-33.91 | 31.81 |
| August | 31.81 | 29.40-32.50 | 30.95 |
| September | 30.95 | 27.58-30.95 | 29.03 |
| October | 29.03 | 29.03-32.37 | 30.83 |
| November | 30.83 | 30.83-34.38 | 32.74 |
| December | 32.74 | 29.17-32.74 | 30.71 |
| 2028 | |||
| January | 30.71 | 28.79-31.82 | 30.30 |
| February | 30.30 | 29.37-32.47 | 30.92 |
| March | 30.92 | 30.92-34.48 | 32.84 |
| April | 32.84 | 29.89-33.03 | 31.46 |
| May | 31.46 | 29.61-32.73 | 31.17 |
| June | 31.17 | 27.78-31.17 | 29.24 |
| July | 29.24 | 29.24-32.60 | 31.05 |
| August | 31.05 | 31.05-34.63 | 32.98 |
WalletInvestor
WalletInvestor offers a moderately optimistic forecast on the silver rate for 2027–2029. In the first half of 2027, the price will likely vary in the range of $32.452 – $34.016, with the closing price of $32.886 in June. In the second half of 2027, the price is expected to fluctuate in the range of $32.700 – $33.919, with a December closing price of $32.983.
At the end of 2028, the asset will likely be at $33.514 per troy ounce. At the same time, the price is expected to reach a low of $33.069 in January and the high of $34.575 in April. In 2029, the price will continue to fluctuate in the range of $33.600 – $35.131 per ounce.
| Date | Opening, $ | Closing, $ | Minimum, $ | Maximum, $ |
|---|---|---|---|---|
| 2027 | ||||
| January | 32.452 | 32.830 | 32.452 | 32.857 |
| February | 32.894 | 33.346 | 32.894 | 33.356 |
| March | 33.452 | 33.542 | 33.397 | 33.544 |
| April | 33.565 | 33.568 | 33.562 | 34.016 |
| May | 33.460 | 33.449 | 33.171 | 33.460 |
| June | 33.444 | 32.886 | 32.883 | 33.462 |
| July | 32.866 | 33.252 | 32.818 | 33.275 |
| August | 33.310 | 33.738 | 33.252 | 33.738 |
| September | 33.792 | 32.847 | 32.847 | 33.919 |
| October | 32.776 | 33.010 | 32.700 | 33.057 |
| November | 33.032 | 33.042 | 32.964 | 33.077 |
| December | 33.051 | 32.983 | 32.839 | 33.051 |
| 2028 | ||||
| January | 33.069 | 33.435 | 33.069 | 33.435 |
| February | 33.436 | 33.991 | 33.436 | 33.991 |
| March | 34.030 | 34.073 | 33.940 | 34.099 |
| April | 34.214 | 34.182 | 34.182 | 34.575 |
| May | 34.070 | 34.014 | 33.724 | 34.070 |
| June | 34.006 | 33.385 | 33.385 | 34.006 |
| July | 33.395 | 33.856 | 33.362 | 33.856 |
| August | 33.854 | 34.327 | 33.806 | 34.327 |
| September | 34.324 | 33.373 | 33.373 | 34.469 |
| October | 33.317 | 33.577 | 33.246 | 33.606 |
| November | 33.589 | 33.598 | 33.513 | 33.626 |
| December | 33.552 | 33.514 | 33.395 | 33.552 |
| 2029 | ||||
| January | 33.600 | 34.004 | 33.600 | 34.004 |
| February | 34.005 | 34.556 | 33.979 | 34.556 |
| March | 34.569 | 34.588 | 34.489 | 34.649 |
| April | 34.720 | 34.683 | 34.683 | 35.131 |
| May | 34.626 | 34.557 | 34.285 | 34.626 |
| June | 34.522 | 33.953 | 33.953 | 34.543 |
| July | 33.956 | 33.909 | 33.909 | 33.956 |
Capex
According to Capex, the asset may exceed $50.00 per ounce in the next five years. It is possible if the transition to green energy continues to develop globally. In this case, the demand for silver will grow intensively, positively impacting the asset’s value.
Factors That May Affect the Silver Price
The key factors affecting silver prices include:
- Supply and Demand. The annual production and demand from large importing countries like the USA, Great Britain, and India play a significant role.
- Industrial Demand. Silver’s use in electronics, green technologies, and the medical field drives its industrial demand.
- Investment Demand. The fluctuating demand significantly impacts silver prices, with physical silver investment and ETF holdings being notable considerations.
- Economic Forces. Global economic conditions, interest rates, and geopolitical events like the Russian conflict influence silver prices.
- Gold/Silver Ratio. The relative value of gold to silver can shift investor preference between the two metals.
- Silver and USD. An inverse relationship exists; a weaker dollar often boosts silver prices.
- Green technology development. Silver is an integral component in many solar and green energy industries, so it is important to monitor any advances in this area.
Conclusion: What Is the Future of Silver? Is Silver a Good Investment?
To sum up, silver has been and will continue to be considered a defensive asset that protects the capital from depreciation during periods of global economic decline. In addition, this asset helps to diversify your investment portfolio in order to reduce risks. It is also possible to speculate on the market with silver, since it is highly volatile.
Many analysts predict a bullish silver market from 2024 to 2030, with a possible rise above $50.00 and even $100.00 per troy ounce by 2030. However, some experts believe that the price will vary in the range of $25–$35 per ounce during this period.
Although experts offer valuable forecasts on the future dynamics of the XAGUSD rate, investors should carefully conduct fundamental and technical analyses before making investment decisions.
Silver Price Prediction FAQ
As of today, 10.07.2024, silver is trading at ${XAGUSD} per ounce.
Many analysts predict the silver price to increase to $30 – $46 per ounce in 2024. Factors such as record demand for the metal from the industrial sector, a potential cut in interest rates by the US Fed, and growing tensions in geopolitics accelerate this growth. Many investors view the precious metal as a defensive asset. Thus, buying silver in 2024 is profitable.
By 2025, silver is projected to trade in a bullish trend. Thus, the silver price may rise to $33 – $40 per troy ounce. Besides, the asset may climb to $55 – $56.
Most analysts predict neutral dynamics for silver in the $33 – $46 range. However, the asset may rise to $107.9 by the end of 2030.
Such forecasts exist. However, such a price is expected only in 2030. According to Coin Price Forecast, the silver price will reach above $107 per ounce only by the end of 2030.
It is also possible. However, it will likely happen in the long term, as the price depends on the fundamental factors that directly affect the asset. The price will most likely fluctuate between $30 and $46 per ounce in the coming months.
Price chart of XAGUSD in real time mode

The content of this article reflects the author’s opinion and does not necessarily reflect the official position of LiteFinance. The material published on this page is provided for informational purposes only and should not be considered as the provision of investment advice for the purposes of Directive 2004/39/EC.
{{value}} ( {{count}} {{title}} )
This post is originally published on LITEFINANCE.


