
Dear readers,
I’ve prepared a short-term forecast for Bitcoin, Ripple, and Ethereum based on the Elliott wave analysis.
The article covers the following subjects:
Highlights and key points
- BTCUSD: the price is declining in impulse wave C, within which subwabes [1]-[2]-[3]-[4]-[5] are unfolding. Expect growth in correction [2] to around 61,406.67 and consider a long position.
- XRPUSD: a descending impulse is developing at the moment, with wave [1] completed as its part. The price is currently growing in correction [2] to around 0.59646. Long positions could be opened.
- ETHUSD: an ascending corrective wave 2 is developing at the moment and may end at 2,648.56. Long positions could be opened in the short term.
Elliott Wave analysis for Bitcoin
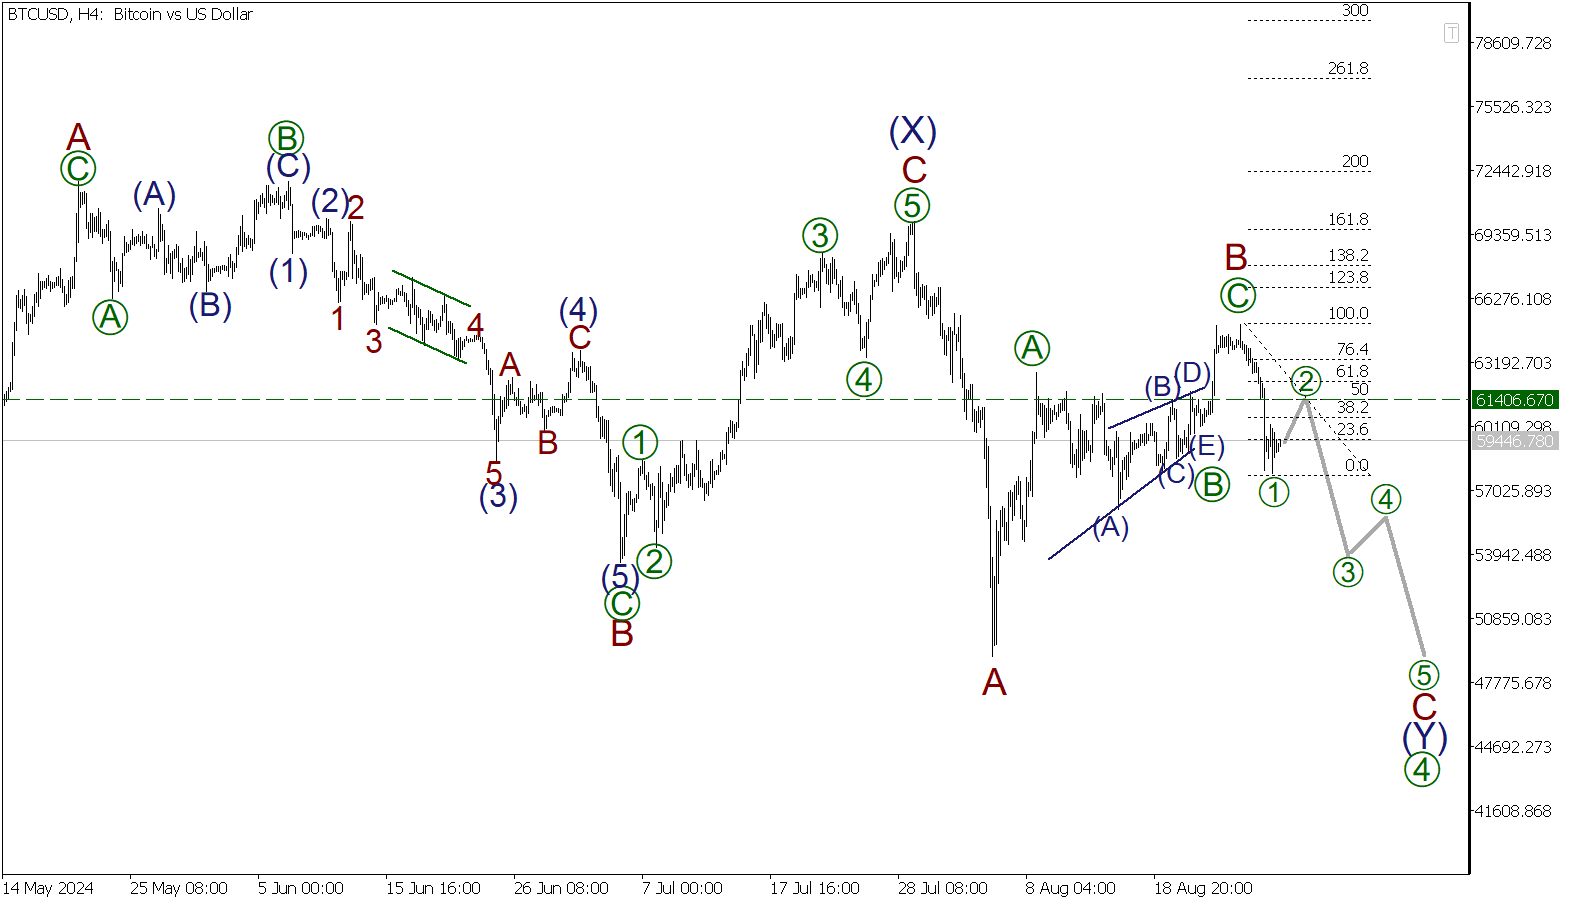
The BTCUSD appears to be forming a descending impulse wave С, which consists of subwaves [1]-[2]-[3]-[4]-[5]. This impulse began developing after a bullish corrective wave B formed as a zigzag [A]-[B]-[C]. The price already declined in impulse wave [1] not long ago and is likely forming a minor ascending correction [2] at the moment, which may end at around 61,406.67. At this level, correction [2] will be 50% of wave [1] according to Fibonacci ratios. Then, a decline in a new descending part of the impulse, wave [3], may take place.
Trading plan for BTCUSD for today:
Buy: 59,446.78, Take profit: 61,406.67
Elliott Wave analysis for Ripple
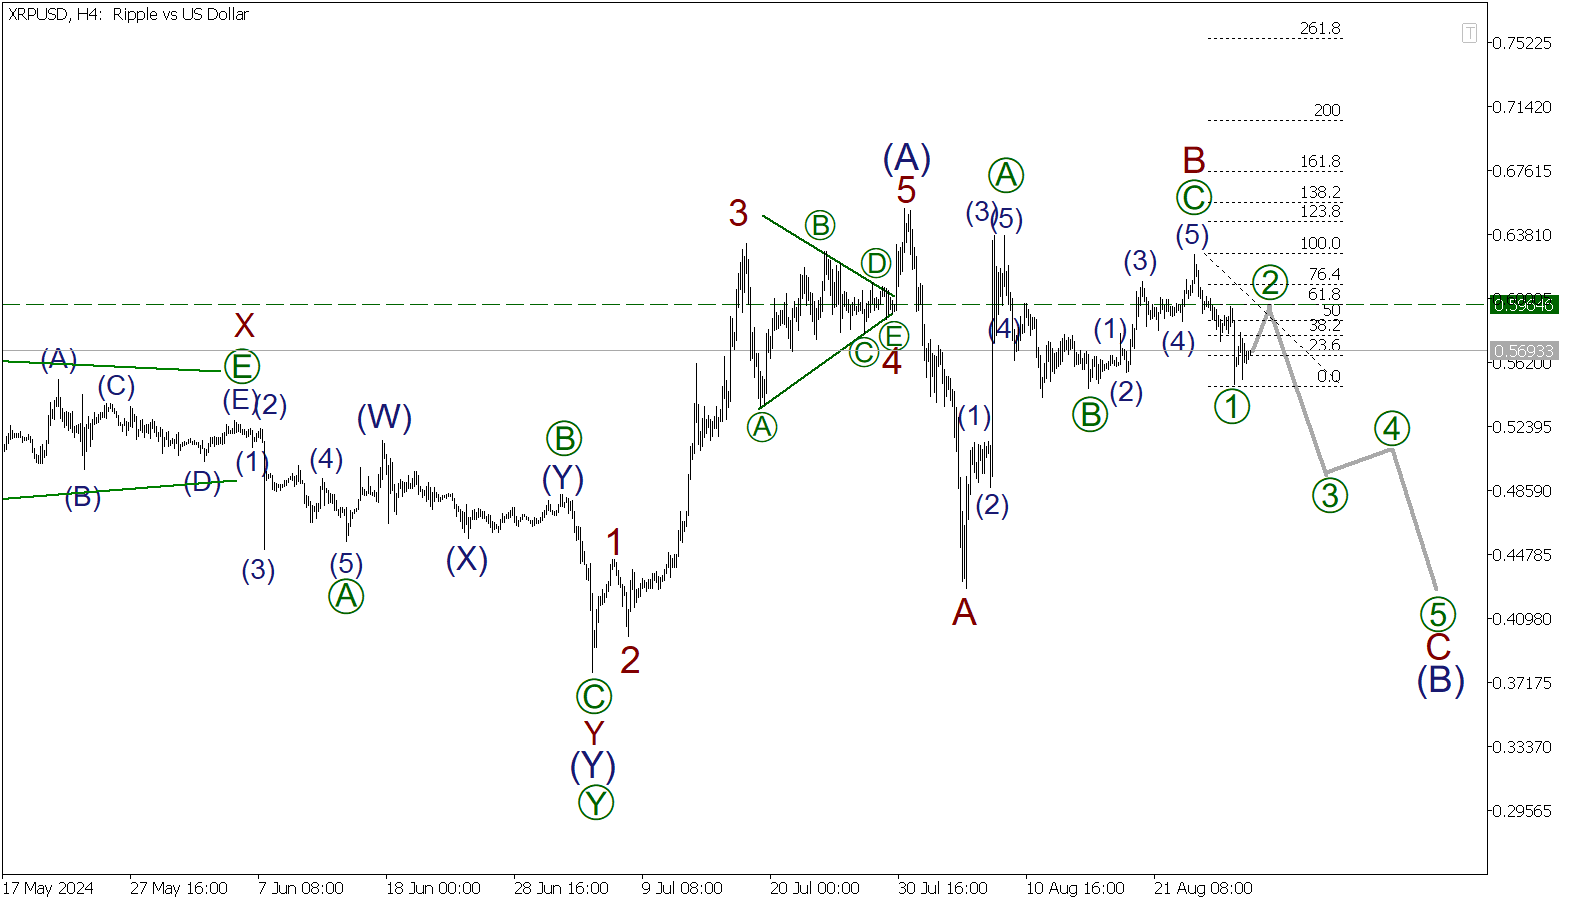
The XRPUSD is forming a large bullish zigzag (А)-(В)-(С). Its corrective wave (B) is developing at the moment. Subwaves A and B are fully completed, and the price appears to be falling in the first part of impulse wave C, which consists of subwaves [1]-[2]-[3]-[4]-[5]. Once the corrective wave [1] formed, the market started developing the ascending correction [2]. Second waves of impulses usually form as deep corrections, reaching more than 50% of a previous wave according to Fibonacci ratios. So, the price may rise in correction [2] to 61.8% of wave [1] according to Fibonacci ratios, i.e. the level of 0.59646.
Trading plan for XRPUSD for today:
Buy 0.56933, Take profit: 0.59646
Elliott Wave analysis for Ethereum
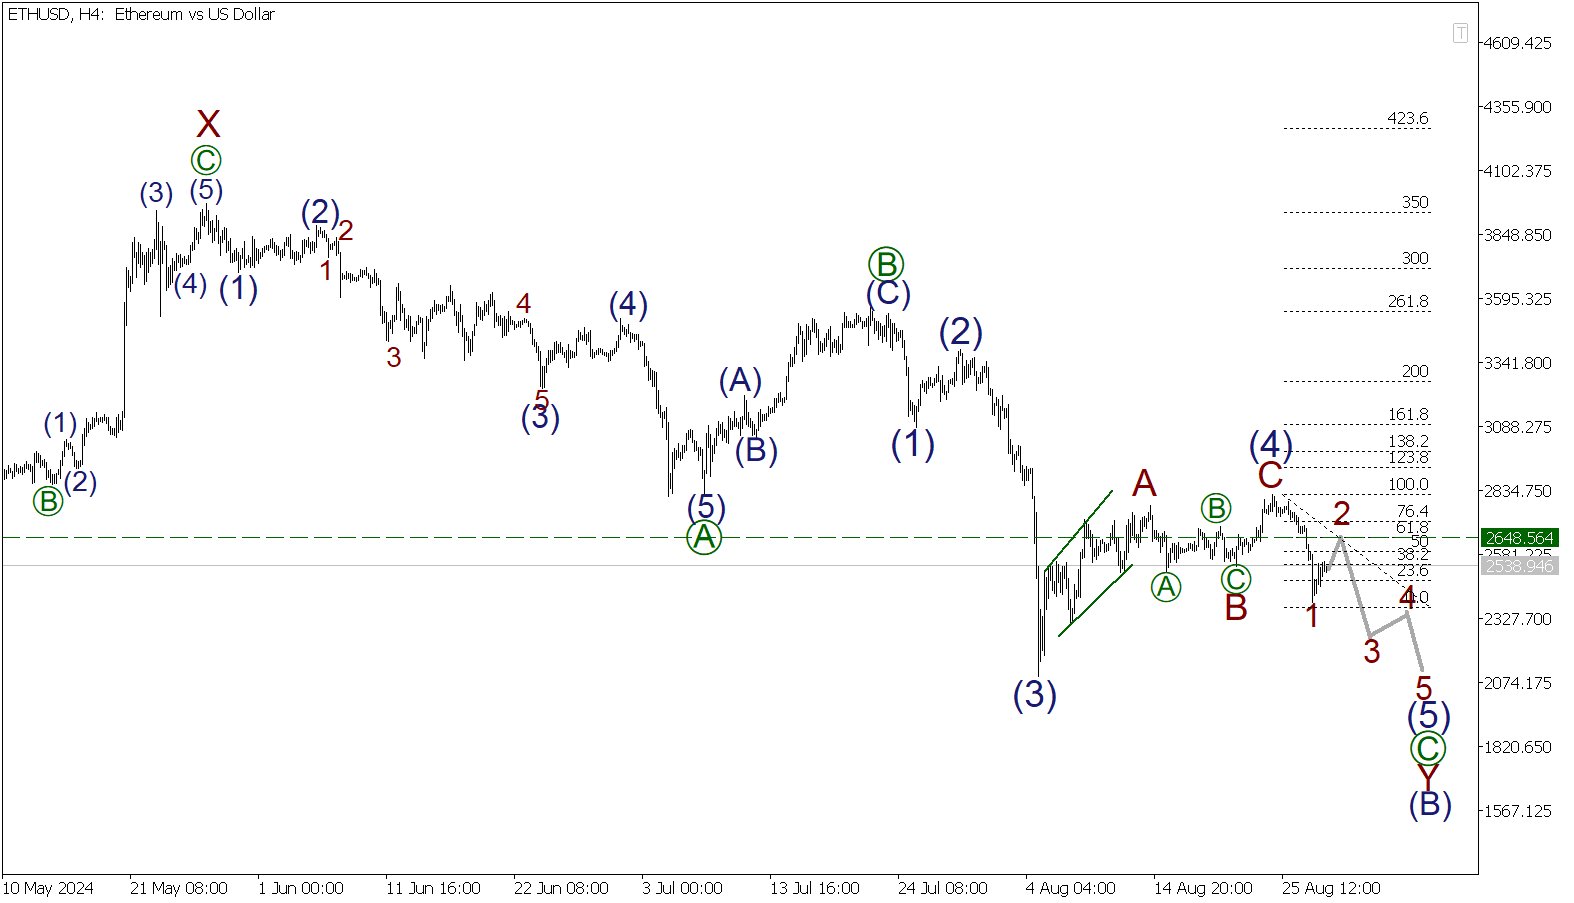
The ETHUSD is most likely developing a large bearish zigzag [A]-[B]-[C]. Its impulse wave [C] is currently unfolding. This wave includes waves of smaller degree labeled with blue numbers (1)-(2)-(3)-(4)-(5). The ascending zigzag (4) has formed recently, and then the impulse (5) started unfolding. It includes subwaves 1-2-3-4-5. Wave 1 is fully formed, and a slight ascending correction 2 is currently developing. I expect it to end at 2,648.56, reaching 61.8% of wave 1 according to Fibonacci lines.
Trading plan for ETHUSD for today:
Buy 2,538.95, Take profit: 2,648.56
P.S. Did you like my article? Share it in social networks: it will be the best “thank you” 🙂
Ask me questions and comment below. I’ll be glad to answer your questions and give necessary explanations.
Useful links:
- I recommend trying to trade with a reliable broker here. The system allows you to trade by yourself or copy successful traders from all across the globe.
- Use my promo code BLOG for getting deposit bonus 50% on LiteFinance platform. Just enter this code in the appropriate field while depositing your trading account.
- Telegram chat for traders: https://t.me/litefinancebrokerchat. We are sharing the signals and trading experience.
- Telegram channel with high-quality analytics, Forex reviews, training articles, and other useful things for traders https://t.me/litefinance
Price chart of BTCUSD in real time mode

The content of this article reflects the author’s opinion and does not necessarily reflect the official position of LiteFinance. The material published on this page is provided for informational purposes only and should not be considered as the provision of investment advice for the purposes of Directive 2004/39/EC.
{{value}} ( {{count}} {{title}} )
This post is originally published on LITEFINANCE.


