
Dear readers,
I’ve prepared a short-term forecast for Bitcoin, Ripple, and Ethereum based on the Elliott wave analysis.
The article covers the following subjects:
Highlights and key points
- BTCUSD: the horizontal wave is expected to end at 65,000.00. Consider a long position.
- XRPUSD: an impulse rise to 0.654 is projected. Consider opening long positions.
- ETHUSD: the price may soar to the high of 2,818.49. Long positions could be opened.
Elliott Wave Analysis for Bitcoin
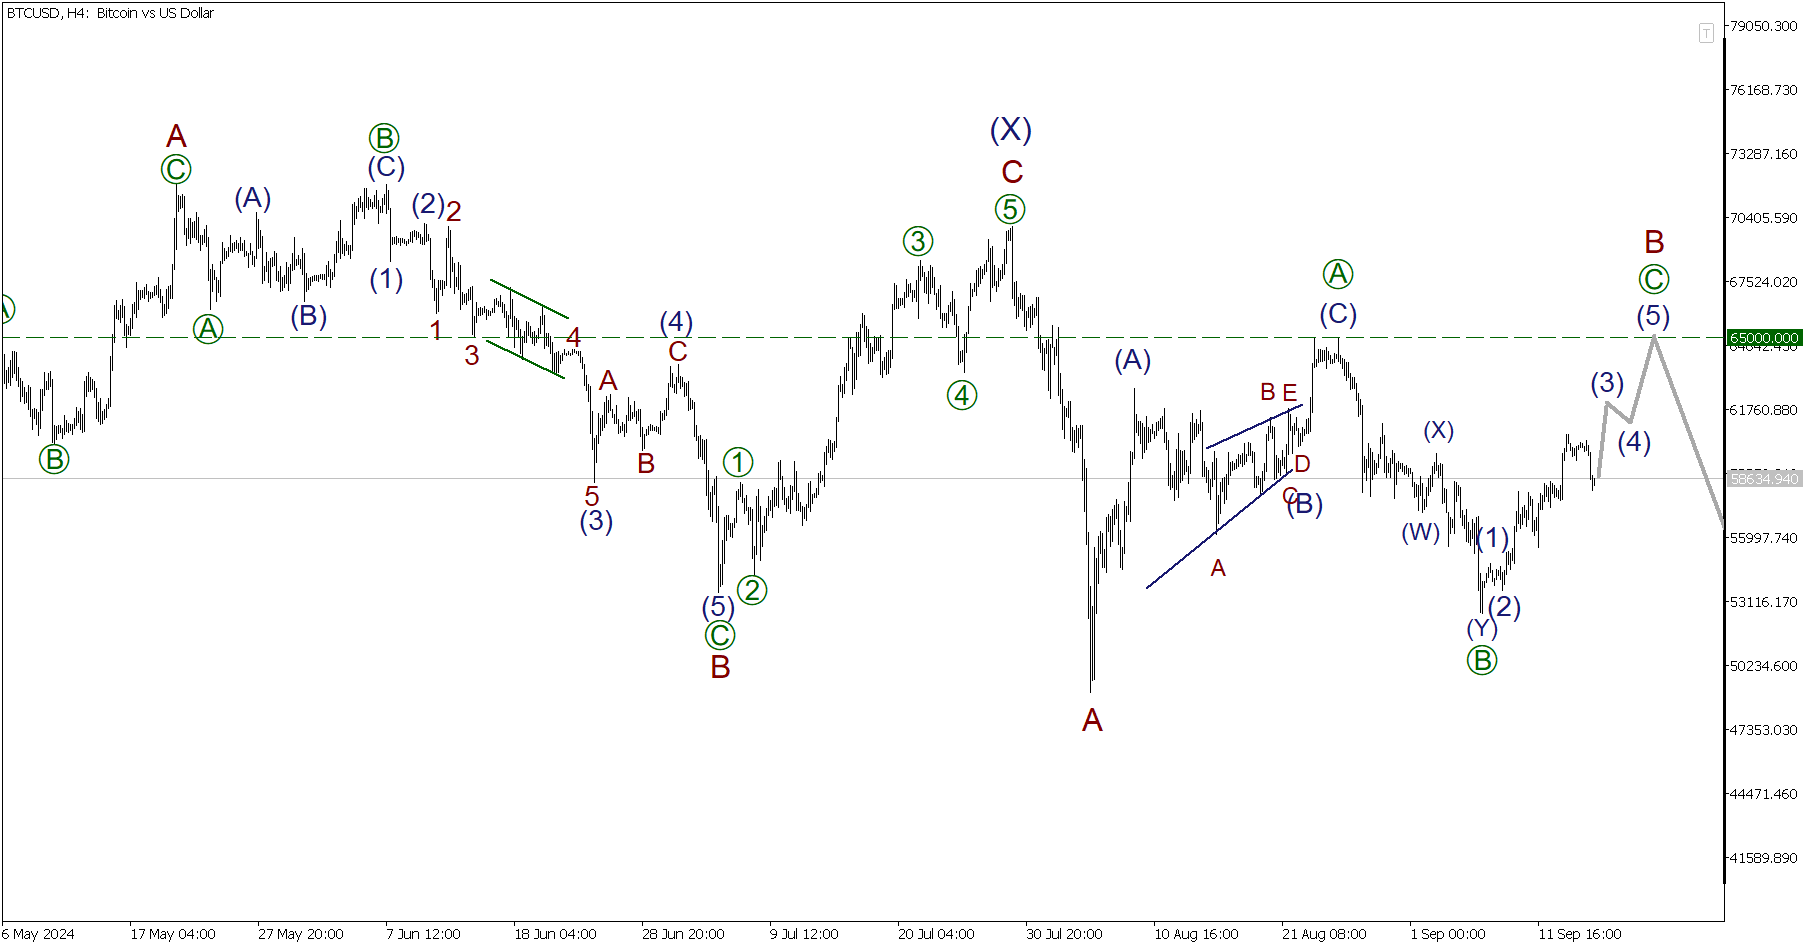
The BTCUSD pair continues to develop a correction, consisting of three sub-waves (W)-(X)-(Y). The final motive sub-wave (Y) is unfolding as a zigzag A-B-C. Its first impulse wave A has formed, and the pair is moving in a complex correction B, which may end as a horizontal wave pattern [A]-[B]-[C] near 65,000.00, the peak of the wave [A]. Against this background, one may consider long positions.
Trading plan for BTCUSD for today:
Buy 58634.44, Take profit: 65000.00
Elliott Wave Analysis for Ripple
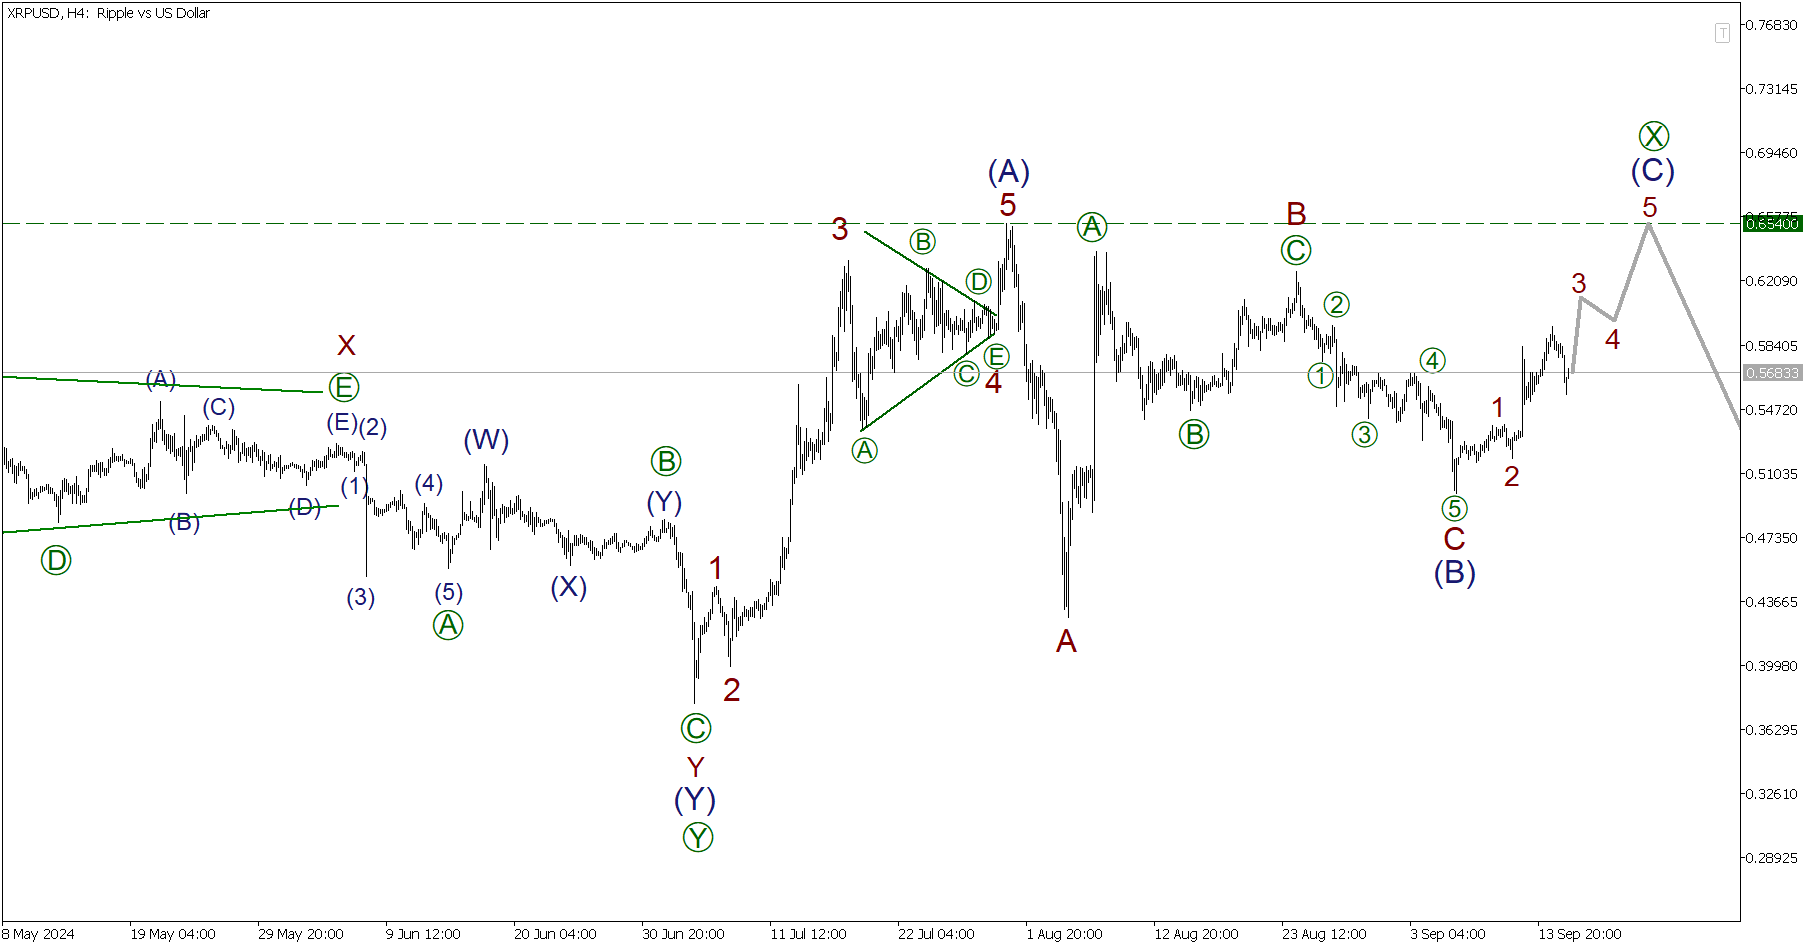
The XRPUSD crypto-pair may be forming a linking wave [X], most likely as a standard zigzag (A)-(B)-(C). Its impulse sub-wave (A) is likely completed. The corrective wave (B) has also been formed, consisting of sub-waves A-B-C. The final wave (C) is developing as an impulse. Therefore, the price is likely increase to the high of 0.654.
Trading plan for XRPUSD for today:
Buy 0.568, Take profit: 0.654
Elliott Wave Analysis for Ethereum
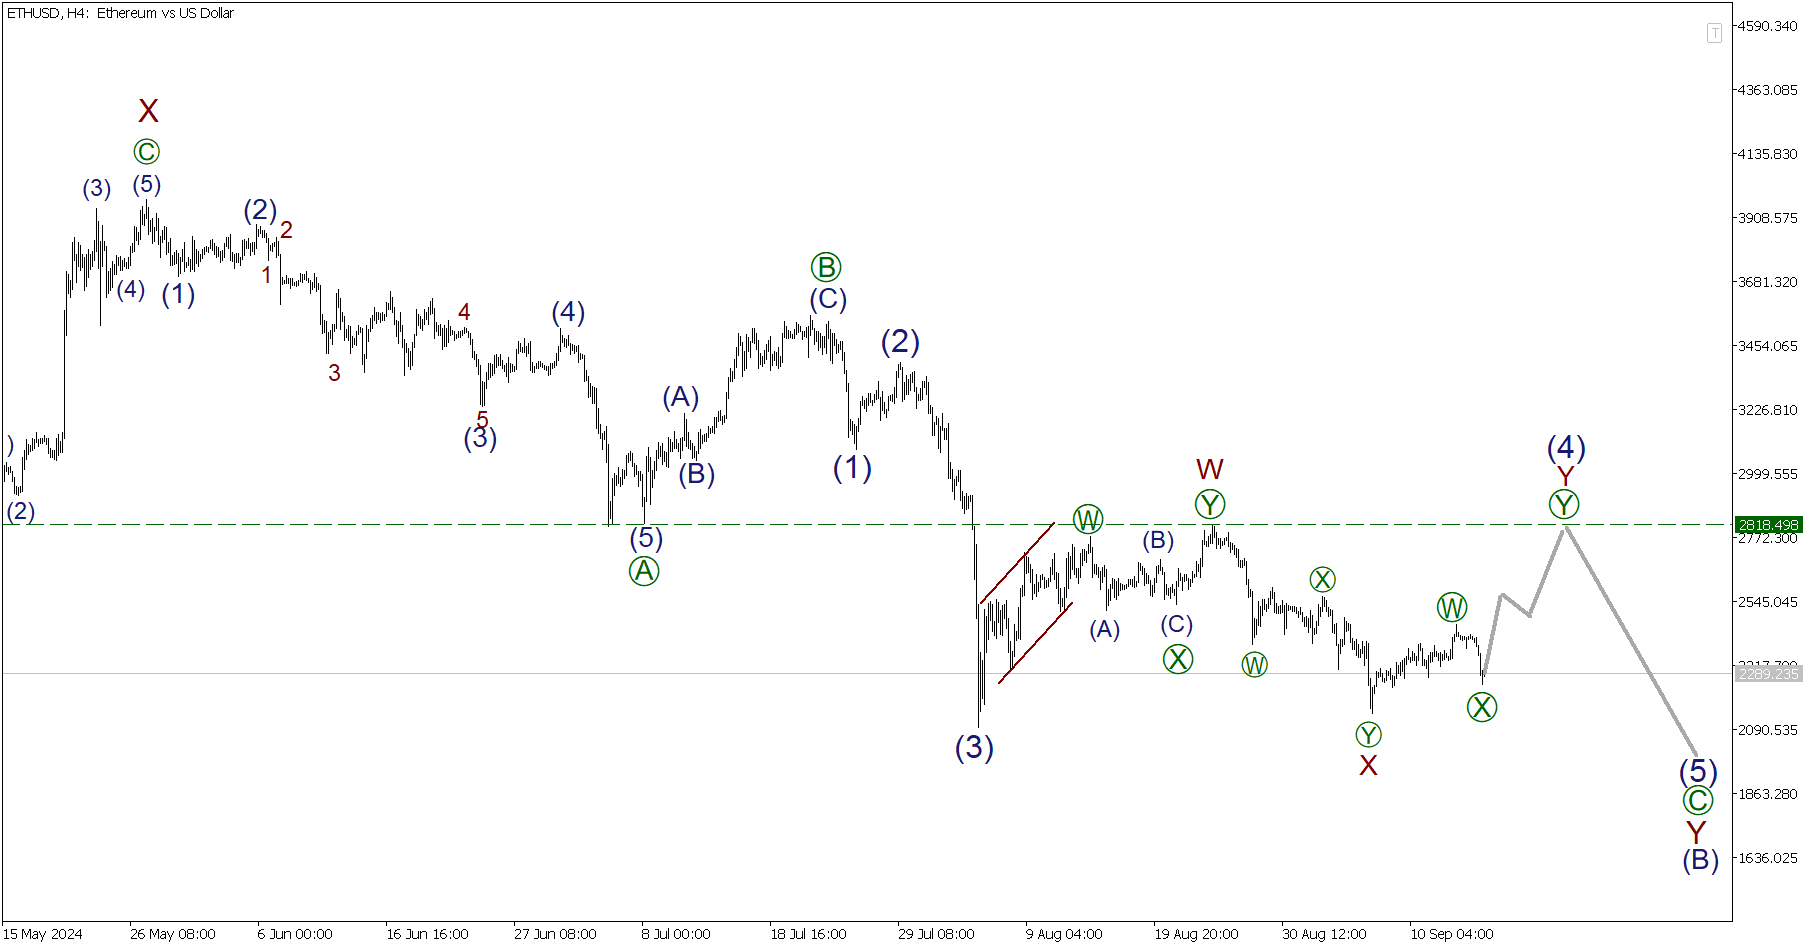
The ETHUSD pair is forming a complex correction (B) as a double zigzag W-X-Y. An actionary zigzag-shaped wave Y, which consists of subwaves [A]-[B]-[C], may be unfolding at the moment. Impulse [A] and correction [B] are formed, and the final sub-wave [C] is currently developing. Correction (4), which is made of waves W-X-Y, may be unfolding within impulse [C] and end near the high of 2,818.49, which was marked within the sub-wave W.
Trading plan for ETHUSD for today:
Buy 2289.23, Take profit: 2818.49
P.S. Did you like my article? Share it in social networks: it will be the best “thank you” 🙂
Ask me questions and comment below. I’ll be glad to answer your questions and give necessary explanations.
Useful links:
- I recommend trying to trade with a reliable broker here. The system allows you to trade by yourself or copy successful traders from all across the globe.
- Use my promo code BLOG for getting deposit bonus 50% on LiteFinance platform. Just enter this code in the appropriate field while depositing your trading account.
- Telegram chat for traders: https://t.me/litefinancebrokerchat. We are sharing the signals and trading experience.
- Telegram channel with high-quality analytics, Forex reviews, training articles, and other useful things for traders https://t.me/litefinance
Price chart of BTCUSD in real time mode

The content of this article reflects the author’s opinion and does not necessarily reflect the official position of LiteFinance. The material published on this page is provided for informational purposes only and should not be considered as the provision of investment advice for the purposes of Directive 2004/39/EC.
{{value}} ( {{count}} {{title}} )
This post is originally published on LITEFINANCE.


