
Dear readers,
I’ve prepared a short-term forecast for Bitcoin, Ripple, and Ethereum based on the Elliott wave analysis.
The article covers the following subjects:
Major Takeaways
- BTCUSD: The price is expected to rise to 92,717.00 amid the current bullish momentum.
- XRPUSD: Subwave (1) continues forming as an impulse. Consider long positions with Take Profit at a high of 0.735.
- ETHUSD: The previous high has been updated, and the price continues growing. Consider buying from the current level with Take Profit at 3,720.14.
Elliott Wave Analysis for Bitcoin
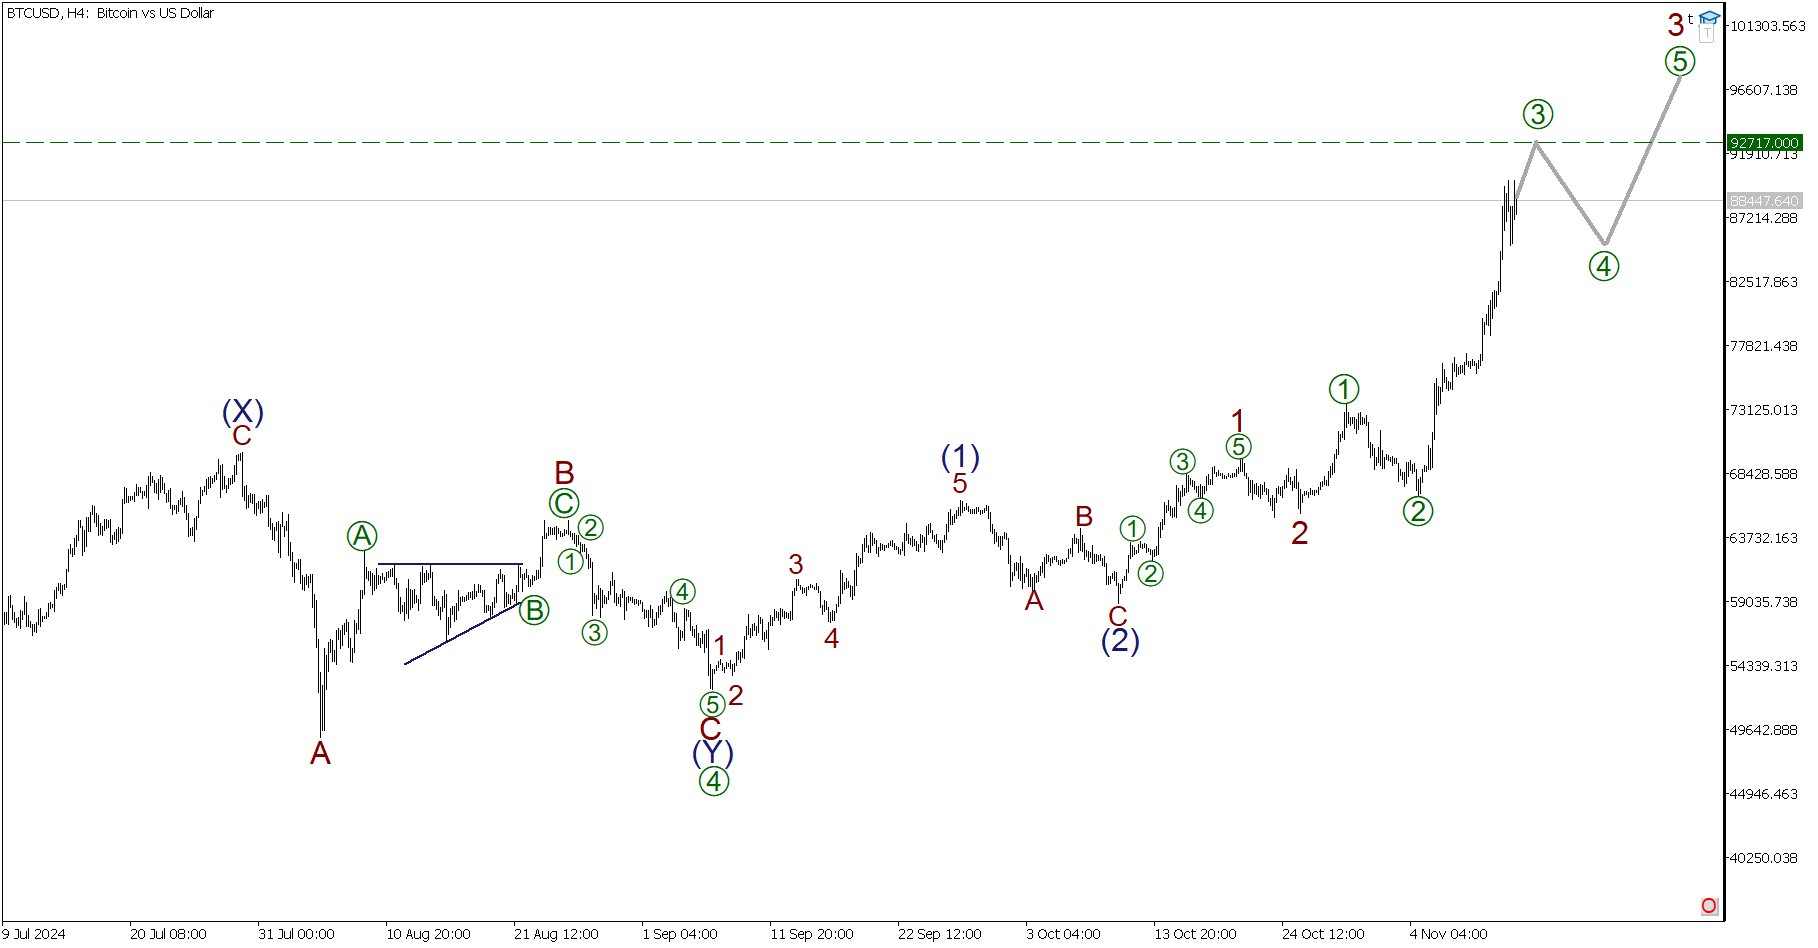
BTCUSD has presumably formed correction [4] as a triple zigzag (W)-(X)-(Y). A new bullish wave is developing in the last segment of the chart. It may form as an impulse (1)-(2)-(3)-(4)-(5). Impulse (1) and correction (2) have formed. Subwaves of a smaller degree 1 and 2 also look complete. The price is expected to rise in the third part of subwave 3 to 92,717.00, then pull back slightly in correction [4], and continue rallying in subwave [5]. Long positions can be considered in this scenario.
Trading Plan for BTCUSD for Today:
Buy 88,447.64, Take profit: 92,717.00
Elliott Wave Analysis for Ripple
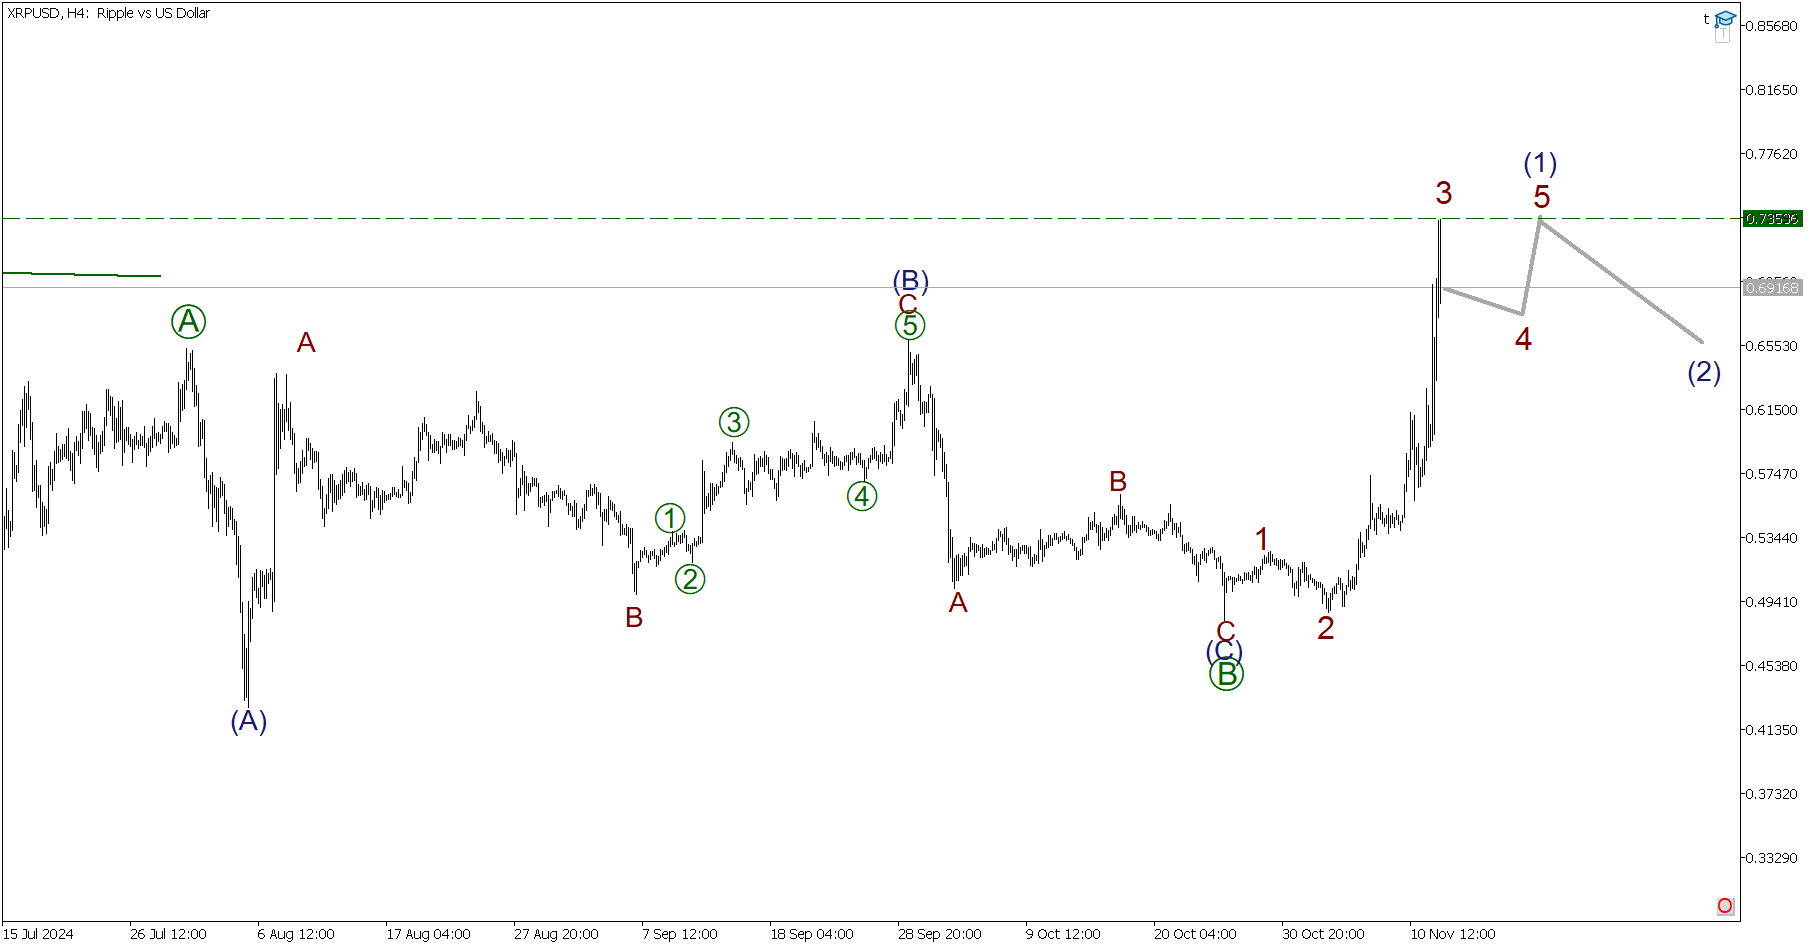
The XRPUSD chart presents a breakdown of a large correction pattern—zigzag [A]-[B]-[C]. We can see the final part of the completed impulse wave [A]. The corrective wave [B] is formed as a zigzag (A)-(B)-(C). The first subwave (1) is presumably forming in the final segment of the chart, marking the beginning of a bullish impulse wave [C]. Subwave (1) is projected to end as an impulse 1-2-3-4-5 near the previous price level of 0.735, marked by correction (B).
Trading Plan for XRPUSD for Today:
Buy 0.691, Take profit: 0.735
Elliott Wave Analysis for Ethereum
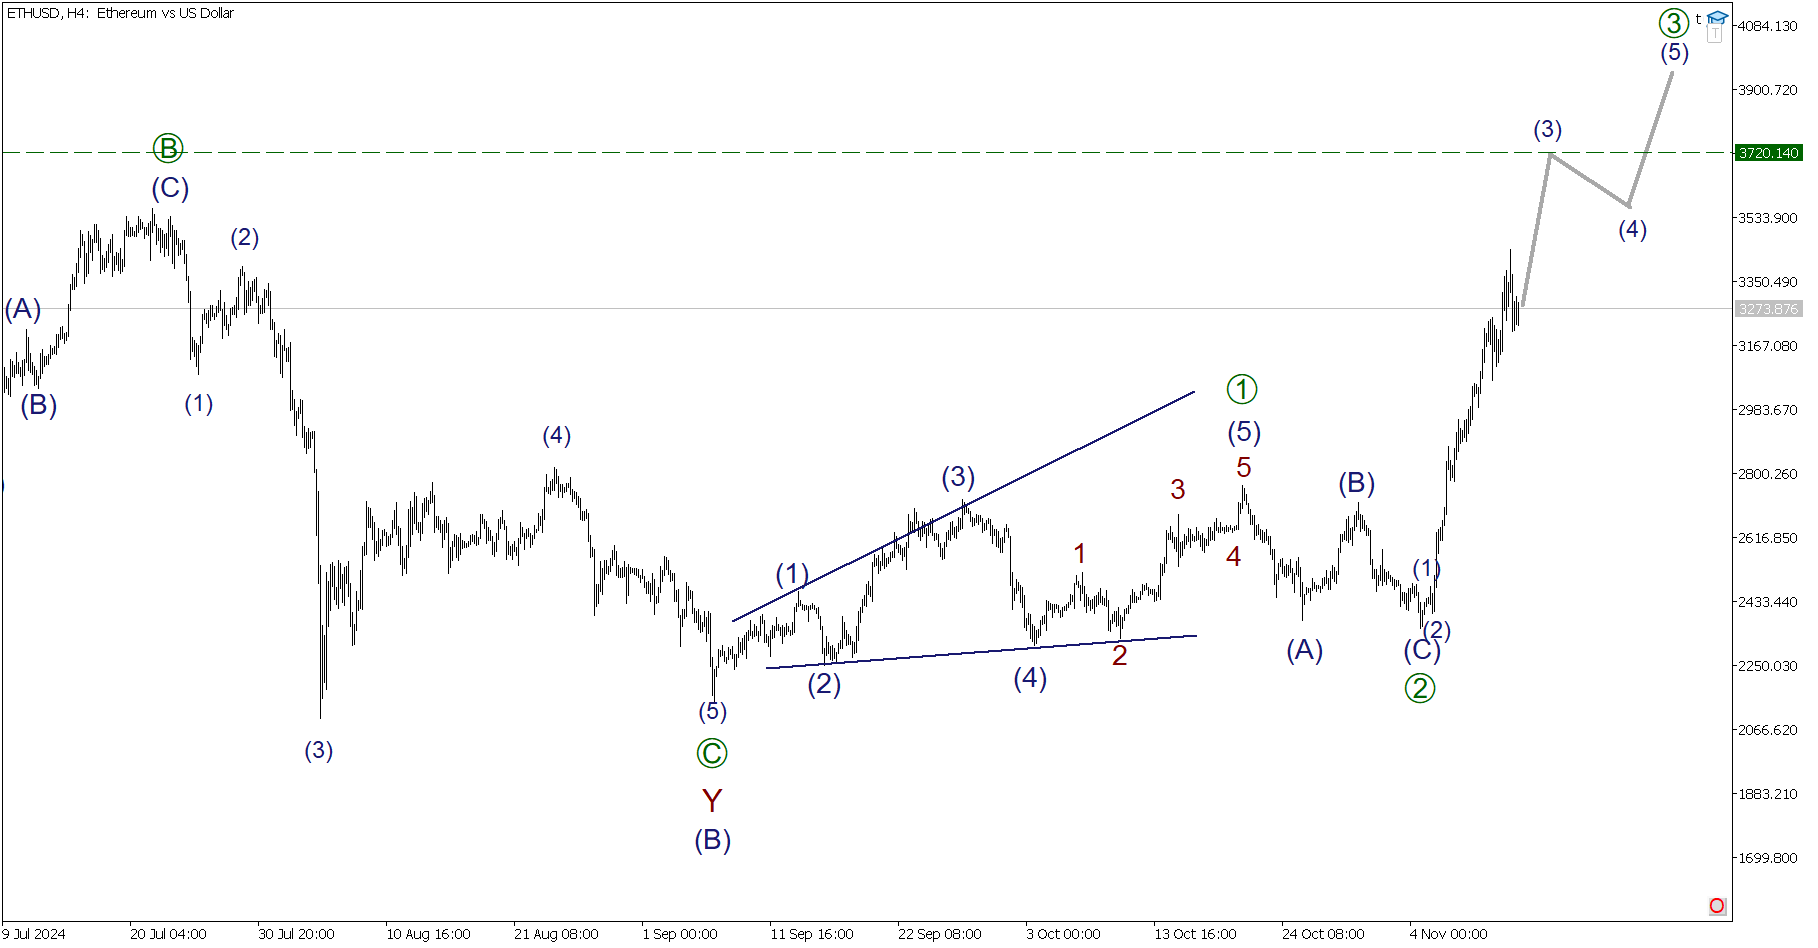
A complex correction (B) is presumably formed as a double zigzag W-X-Y in Ethereum‘s chart. The first part of a new bullish wave has started developing, potentially as an impulse [1]-[2]-[3]-[4]-[5]. Its first subwave [1] is a leading diagonal (1)-(2)-(3)-(4)-(5). The price has corrected in a zigzag-shaped subwave [2]. So, the price is growing in the third impulse subwave and may reach a peak of 3,720.14 and even higher.
Trading Plan for ETHUSD for Today:
Buy 3,273.87, Take profit: 3,720.14
P.S. Did you like my article? Share it in social networks: it will be the best “thank you” 🙂
Ask me questions and comment below. I’ll be glad to answer your questions and give necessary explanations.
Useful links:
- I recommend trying to trade with a reliable broker here. The system allows you to trade by yourself or copy successful traders from all across the globe.
- Use my promo code BLOG for getting deposit bonus 50% on LiteFinance platform. Just enter this code in the appropriate field while depositing your trading account.
- Telegram chat for traders: https://t.me/litefinancebrokerchat. We are sharing the signals and trading experience.
- Telegram channel with high-quality analytics, Forex reviews, training articles, and other useful things for traders https://t.me/litefinance
Price chart of BTCUSD in real time mode

The content of this article reflects the author’s opinion and does not necessarily reflect the official position of LiteFinance. The material published on this page is provided for informational purposes only and should not be considered as the provision of investment advice for the purposes of Directive 2004/39/EC.
{{value}} ( {{count}} {{title}} )
This post is originally published on LITEFINANCE.


