
Dear readers,
I’ve prepared a short-term forecast for Bitcoin, Ripple, and Ethereum based on the Elliott wave analysis.
The article covers the following subjects:
Key takeaways
- BTCUSD: A descending wave Z is expected to reach 53,490.60. Consider selling from the current level with Take Profit at 53,490.60.
- XRPUSD: The bears may push the market to 0.348. Consider selling from the current level with Take Profit at 0.348.
- ETHUSD: The pair is in the first part of a bearish impulse (C). Consider selling with Take Profit at 2,806.27.
Elliott Wave analysis for Bitcoin
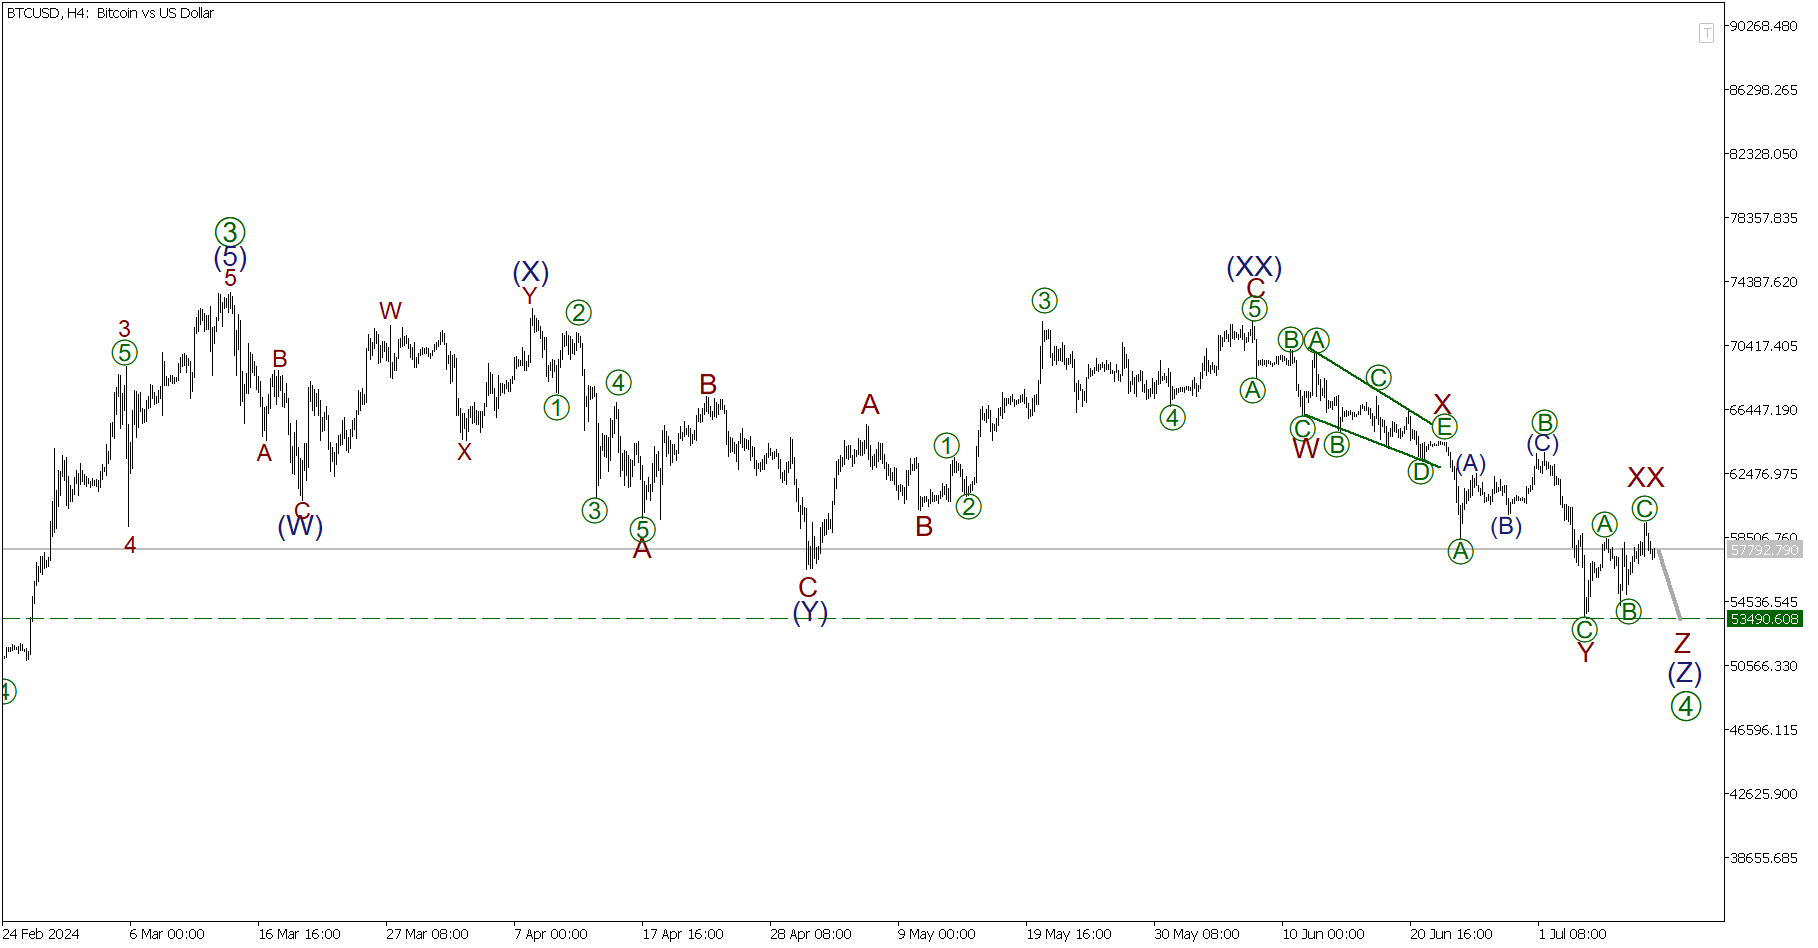
The last wave of a big complex correction [4] — a descending wave (Z) — appears to be forming in the last segment of Bitcoin‘s chart as a triple zigzag W-X-Y-XX-Z. Its second linking wave XX has presumably formed recently as a regular zigzag [A]-[B]-[C]. The actionary wave Z may be unfolding at the moment. The price will likely drop to 53,490.60, the previous low marked by subwave Y.
Trading plan for BTCUSD for today:
Sell 57,792.79, Take profit: 53,490.60
Elliott Wave analysis for Ripple
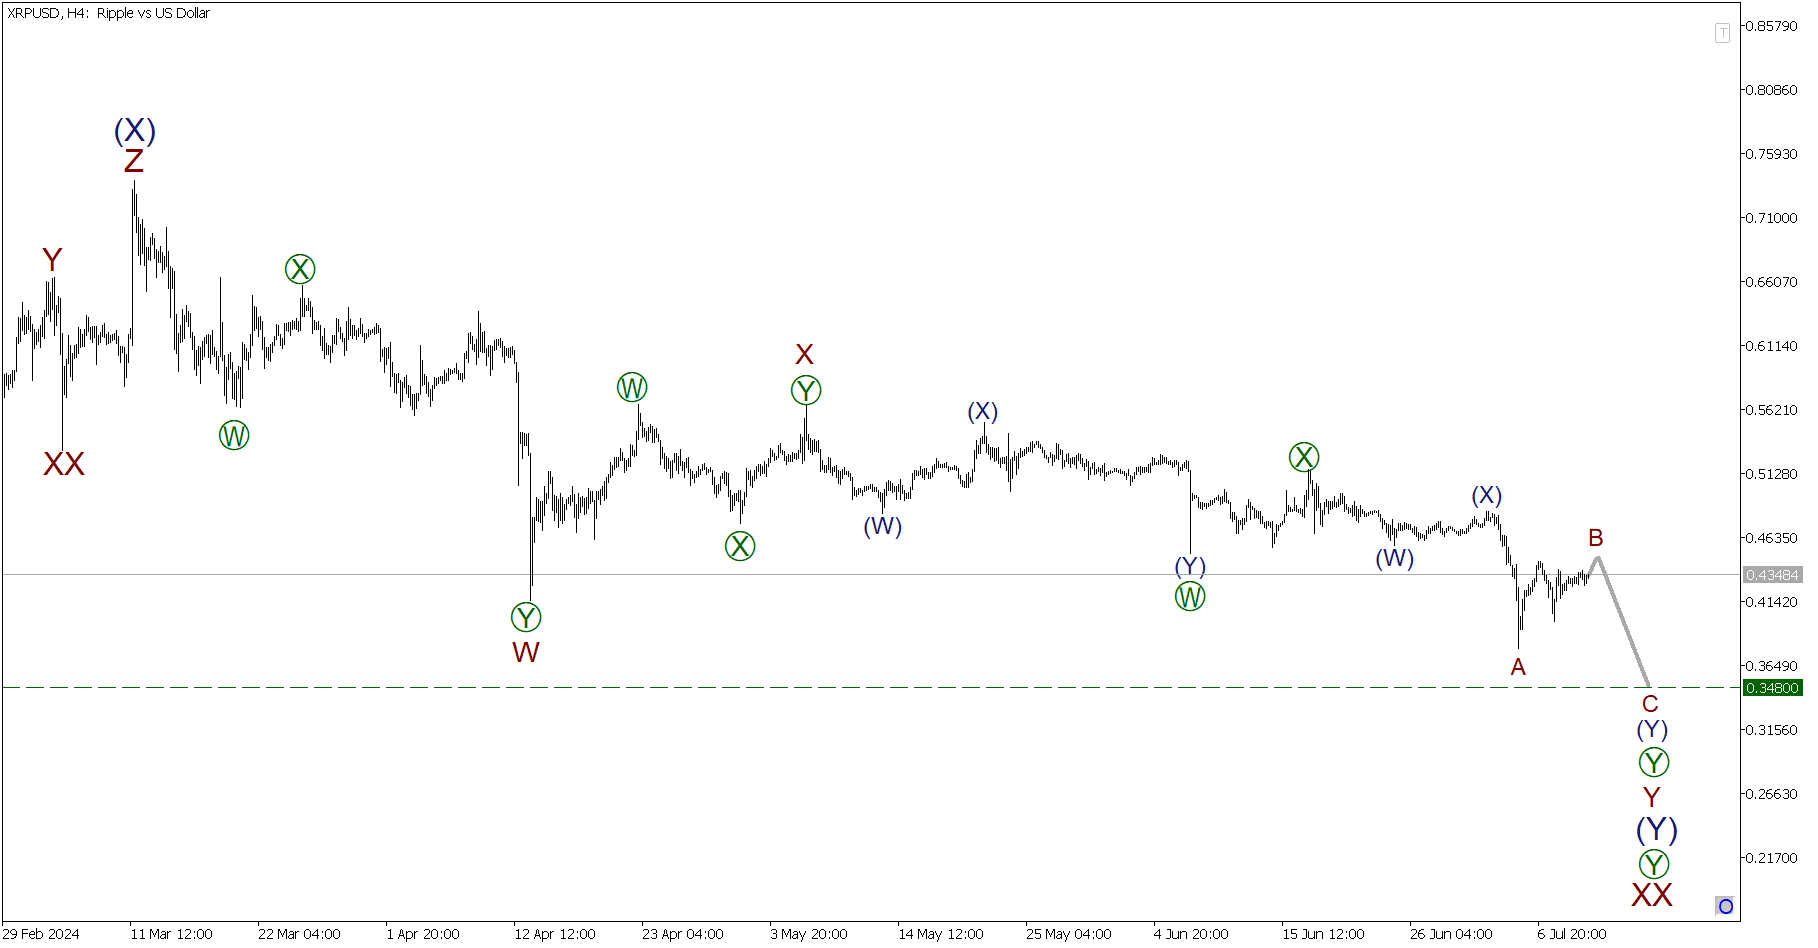
A double zigzag W-X-Y is developing in the XRPUSD’s chart. Its first two parts are fully formed. The actionary wave Y is unfolding at the moment, presumably as a double zigzag [W]-[X]-[Y]. The actionary wave [W] and the linking wave [X] have already formed, and the last wave (Y) is expected to form shortly. The price may fall to the level of 0.348.
Trading plan for XRPUSD for today:
Sell 0.434, Take profit: 0.348
Elliott Wave analysis for Ethereum
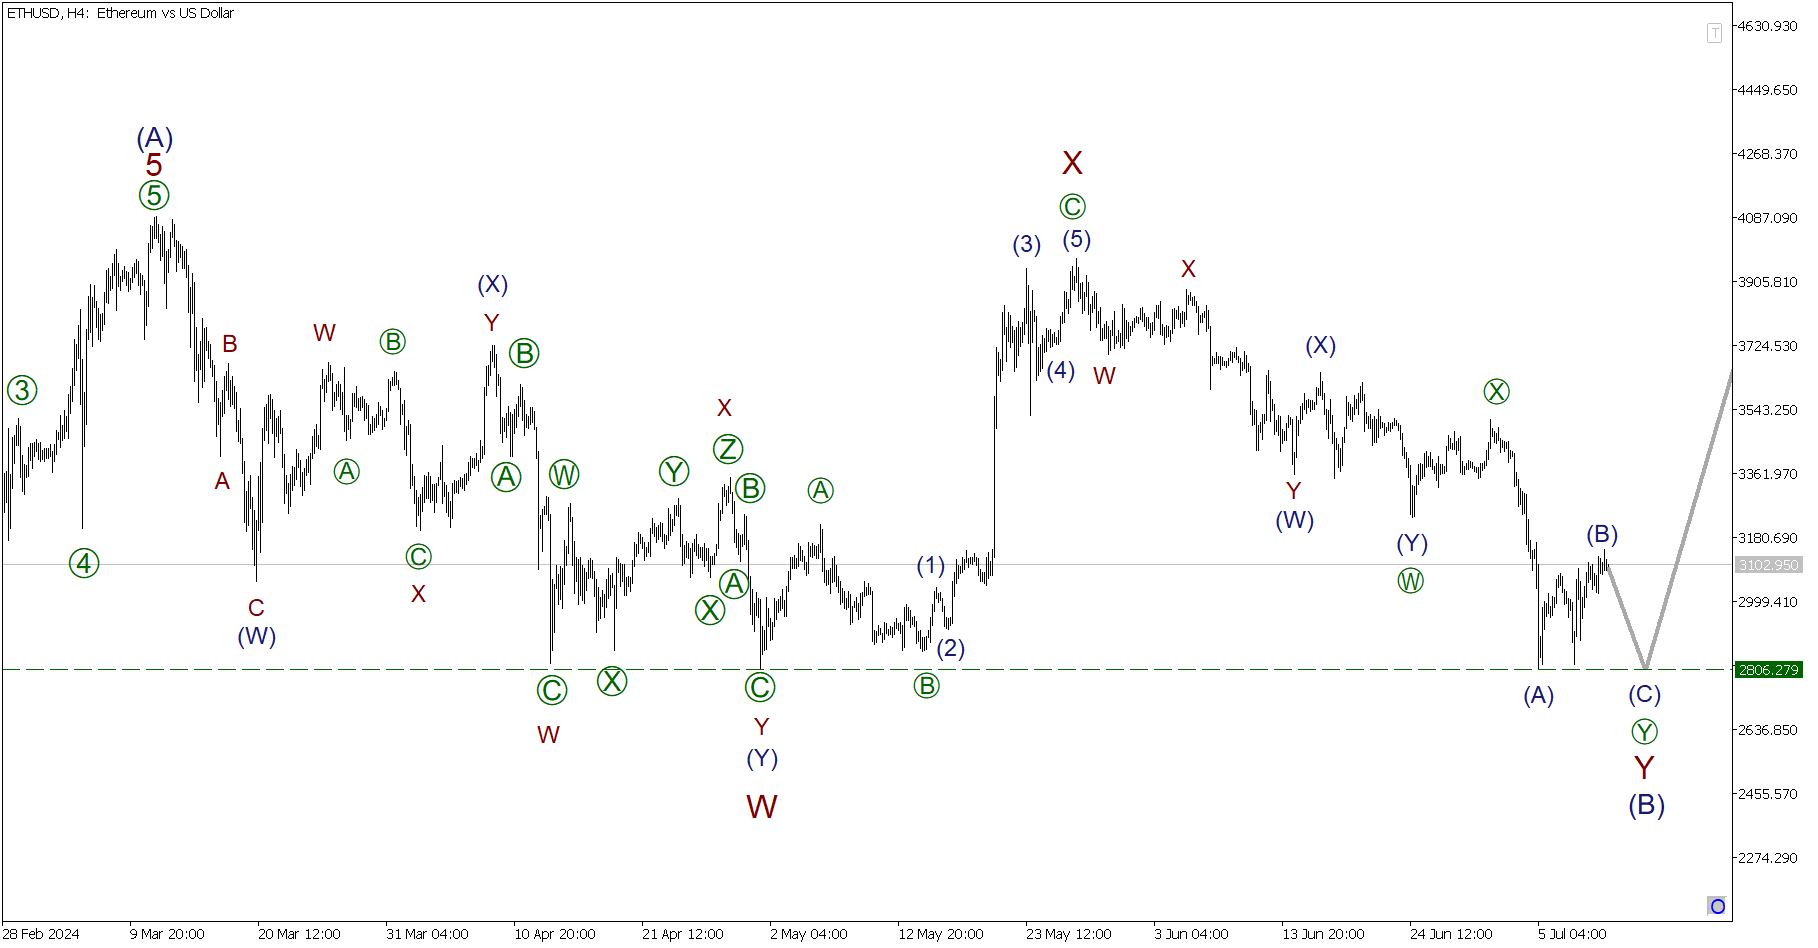
The ETHUSD is likely developing a large correction that consists of three waves W-X-Y. The last actionary wave Y is currently unfolding as a double zigzag [W]-[X]-[Y]. Subwaves [W]-[X] look fully formed. The last part of subwave [Y] is currently developing. The price is expected to decline in impulse subwave (C) to the level of 2,806.27 in the near time.
Trading plan for ETHUSD for today:
Sell 3,102.95, Take profit: 2,806.27
P.S. Did you like my article? Share it in social networks: it will be the best “thank you” 
Ask me questions and comment below. I’ll be glad to answer your questions and give necessary explanations.
Useful links:
- I recommend trying to trade with a reliable broker here. The system allows you to trade by yourself or copy successful traders from all across the globe.
- Use my promo code BLOG for getting deposit bonus 50% on LiteFinance platform. Just enter this code in the appropriate field while depositing your trading account.
- Telegram chat for traders: https://t.me/litefinancebrokerchat. We are sharing the signals and trading experience.
- Telegram channel with high-quality analytics, Forex reviews, training articles, and other useful things for traders https://t.me/litefinance
Price chart of BTCUSD in real time mode

The content of this article reflects the author’s opinion and does not necessarily reflect the official position of LiteFinance. The material published on this page is provided for informational purposes only and should not be considered as the provision of investment advice for the purposes of Directive 2004/39/EC.
{{value}} ( {{count}} {{title}} )
This post is originally published on LITEFINANCE.