
The Quasimodo chart pattern is a popular technical analysis tool in the Forex market. Its primary functions include identifying trend reversal points and determining market entry and exit points. The QM pattern is versatile and can be employed in both bullish and bearish markets. Its structured design enables traders to predict price movements, thereby reducing risk.
To ensure profitable trading using the Quasimodo pattern, consider market sentiment and rely on additional tools, such as support and resistance levels. This article provides a comprehensive guide to mastering the Quasimodo pattern, enabling you to identify it on trading charts, trade confidently, and optimize your Forex trading strategies.
The article covers the following subjects:
Major Takeaways
- The Quasimodo is a technical analysis pattern that helps traders determine trend reversals or continuations.
- The Quasimodo trading strategy is universal and is suitable for both bearish and bullish trends in the Forex market.
- The pattern’s main elements are the neckline, key levels, as well as a characteristic price movement.
- Additional technical indicators, such as the Fibonacci retracement tool and the relative strength index (RSI), can be used to confirm the signal.
- Quasimodo trading requires careful analysis of support and resistance levels.
- The pattern can be observed on any time frame, which makes it a versatile tool.
What Is Quasimodo in Forex?
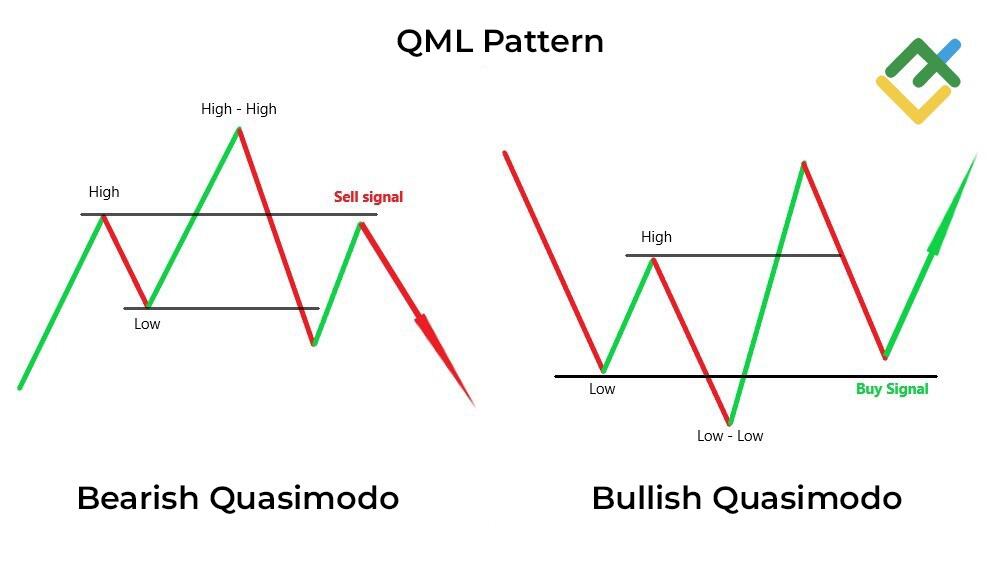
The Quasimodo (QML) pattern is a price chart pattern used to identify points of market reversals. Its name is linked to the hunchbacked Quasimodo and is associated with a unique shape that resembles the Head and Shoulders pattern, except that one shoulder is lower than the other. It was named after the hunchback character Quasimodo from Victor Hugo’s “The Hunchback of Notre Dame.”
The Quasimodo formation consists of several key elements: a high, a low, a higher high, a lower low, and a lower high. These levels serve as reference points for identifying entry and exit points.
The Quasimodo pattern is a reversal structure. Many traders use it to predict changes in price movement by identifying key support and resistance levels. Combining the Quasimodo pattern with other trading strategies and tools enhances its effectiveness and accuracy.
Quasimodo vs. Head and Shoulders: Key Differences
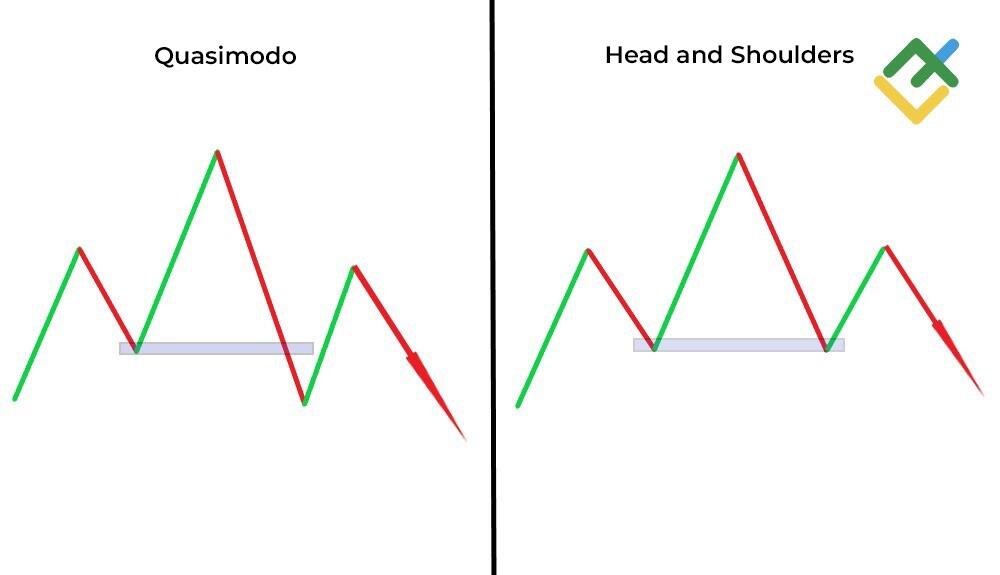
The most skilled and best traders use the Quasimodo and Head and Shoulders patterns to analyze trend reversals. However, the patterns have key differences in their structure and application, which help traders more accurately interpret market signals, identify entry and exit points, and build effective trading strategies.
|
Criteria |
Quasimodo |
Head and Shoulders |
|
Structure |
Asymmetrical, one shoulder is higher or lower than the other |
Symmetrical, with a distinct head and shoulders |
|
Reversal point |
Based on support or resistance levels |
The neckline defines a reversal point |
|
Signal |
Signals a trend reversal or continuation |
Signals a trend reversal |
|
Complexity |
More difficult to spot on the chart as it requires advanced skills and considerable experience |
Easier to recognize on the chart |
The Quasimodo price formation is distinguished by its versatility. It can be effective in both bear and bull markets. At the same time, the Head and Shoulders pattern may provide valuable insights, such as identifying the end of an uptrend and its transition to a downtrend.
The Quasimodo Reversal Pattern in Forex Trading
The Quasimodo pattern is one of the most popular reversal patterns used by Forex traders. Its formation indicates the possible end of the current trend and a shift in the opposite direction.
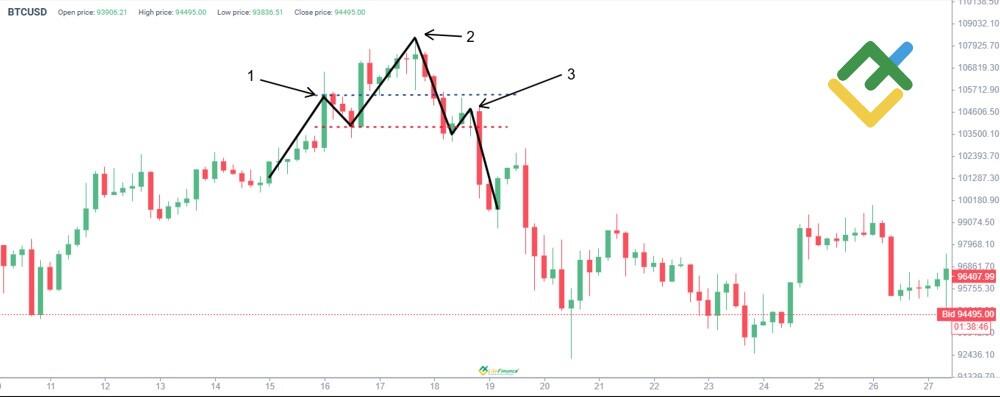
The screenshot below shows a classic example of a Bearish Quasimodo pattern. Its construction begins with an uptrend, which forms several key elements. The first one is the left shoulder (1) – a swing high, followed by the head (2) – a higher high, signaling the continuation of the trend. After that, there is the right shoulder (3), which forms below the head and slightly below the left shoulder, signaling that the current trend is waning, and sellers put increased pressure on the asset’s price.
The screenshot illustrates the key element of the pattern, the level indicated by the red dotted line, which offers a support level. If the price violates the support, the reversal will be confirmed, allowing traders to open short positions. A stop-loss order can be placed at the level highlighted by the blue dotted line to minimize risks.
As you can see on the chart, after breaking through the key support level, the price continued its downward movement, confirming the bearish reversal. When you use the Quasimodo strategy, you can focus on support and resistance levels to find optimal entry and exit points. You can also employ the MACD indicator or the RSI oscillator to identify the moment when the trend is starting to fade, thereby increasing the accuracy of the forecast.
How to Trade the Quasimodo Reversal Pattern
A Quasimodo trading strategy can effectively identify trend reversal points. Below are step-by-step guidelines for trading the Quasimodo pattern.
1. Identify the pattern on a chart:
- find the left shoulder, head, and right shoulder;
- make sure that the right shoulder’s peak is below the head and slightly below the left shoulder;
- determine the key support or resistance levels.
2. Confirm the pattern’s validity:
- wait for the price to breach the key support level (a bearish Quasimodo) or the key resistance level (a bullish Quasimodo Forex pattern);
- use technical indicators such as MACD or the RSI to confirm that the current trend has weakened and a reversal has begun.
3. Define an entry point:
- open a trade once the price breaks through the key level;
- open a short position if you trade a bearish Quasimodo pattern and a long position if you use a bullish Quasimodo pattern.
4. Place a stop-loss order:
- put a stop-loss order slightly above the right shoulder for a bearish pattern and below the right shoulder for a bullish pattern.
5. Set a take-profit target:
- refer to the nearest support and resistance levels to place your profit targets;
- apply the ATR indicator to calculate a reasonable price action to enhance the accuracy of your take-profit order.
6. Risk management:
- risk no more than 2–5% of your available capital on a single trade;
- regularly monitor market changes and move your stop-loss order.
By following these steps, you can effectively use the Quasimodo pattern in trading and minimize risks.
The Quasimodo Continuation Pattern in Forex Trading
The Quasimodo continuation pattern is a technical analysis indicator that forms within a strong trend and confirms its continuation after a short-term correction. It consists of several key elements: a left shoulder, a head, and a right shoulder, which fit into the current trend channel.
The XAUUSD chart shows the formation of the pattern in a downtrend. After a short-term uptick, the price formed a left shoulder (1), reached a swing high (head) (2), and declined to the left shoulder level, creating a right shoulder (3). This pullback allowed traders to enter the market at a more favorable price.
As you can see, a sell signal is generated when the price pierces the swing low, confirming the continuation of the downward movement. Additional confirmation is that the Quasimodo price structure is formed within the descending trading channel.
Quasimodo pattern trading requires following the trend while minimizing risks. Notably, the Quasimodo trading strategy is particularly useful in volatile markets with clear trend movement.

How to Trade the Quasimodo Continuation Pattern
The Quasimodo pattern offers a versatile trading strategy that can be utilized in both uptrends and downtrends, with the key support and resistance levels serving as crucial markers. Let’s delve into the fundamental principles of the Quasimodo trading pattern and explore effective market entry strategies.
1. Identify the pattern:
- determine whether a trading channel is ascending or descending and draw it on the chart;
- find the pattern’s components: a left shoulder, a head, and a right shoulder.
2. Confirm a breakout:
- make sure the price has pierced a key support or resistance level;
- check tick volume or MACD indicators for confirming signals.
3. Find an entry point:
- enter the market once the price violates the level that confirms the trend continuation;
- set a stop-loss order above or below the right shoulder.
4. Manage your position:
- monitor the price movement and adjust the stop-loss order to safeguard your gains if necessary;
- wait for the price to hit the profit target, or close your position manually if the trend direction starts to reverse.
This strategic approach is designed to mitigate potential risks and facilitate effective trading within the prevailing market trend.
Quasimodo Trading Strategy: Optimizing Entries and Confirming Signals
Traders can use the following tools to improve the accuracy of market entries and ensure profitable exits when trading the Quasimodo pattern:
- MACD and RSI. The MACD detects changes in trend direction, while the RSI helps identify overbought or oversold conditions in the market. For example, a MACD crossover and an RSI value below 30 or above 70 create perfect conditions for entering the market.
- Tick volume. A sharp increase in volumes near key levels reinforces the pattern signal, reflecting the entry of major market participants.
- Support and resistance levels. A likelihood of a reversal increases in areas where key levels and pattern’s extrema intersect.
- Candlestick patterns. Such candlestick patterns as a pin bar or engulfment strengthen the signal.
- Trend lines. Use trend lines to confirm the price movement after a key level has been broken.
These tools help mitigate false signals, enhance the accuracy of entry points, and increase the probability of successful trades.
The Pros and Cons of the Quasimodo Chart Pattern
As with any technical analysis pattern, the Quasimodo trading pattern has its strengths and weaknesses. It is essential for traders to consider these aspects to apply the pattern more effectively in their trading strategies.
|
Advantages |
Disadvantages |
|
Easy to recognize on price charts |
Requires trading experience for precise interpretation |
|
Applicable to all markets |
May give false signals amidst market noise |
|
Suitable for identifying trend reversals |
Not effective during strong trends |
|
Provides accurate entry and exit points |
Relies on additional confirmations |
|
Can be combined with other indicators |
Volume and volatility should be taken into account |
The Quasimodo pattern is compelling due to its versatility and precise signals, but it requires careful analysis and complementary tools to ensure greater accuracy.
Tips for Trading the Quasimodo Pattern on Forex
The following are valuable insights for effective trading using the Quasimodo chart pattern.
- Monitor the market trend. Make sure the pattern is formed in accordance with the current trend direction.
- Practice on a demo account. Hone your skills in a simulated market environment before applying your strategy on a live account.
- Manage risk. Always set stop-loss orders to minimize losses. Notably, CFDs are complex instruments and come with a high risk of losing money rapidly due to potential change in the trend direction.
- Remain flexible in your planning. Remember that the market does not always move according to your prediction, so it is important to consider false signals and be prepared to change your strategy to avoid falling into a bear trap.
- Assess market conditions. The Quasimodo strategy works better when combined with other tools, such as support and resistance levels or indicators, such as MACD and Fibonacci retracement levels.
Conclusion
The Quasimodo pattern is a valuable tool for traders, allowing them to predict trend reversals or continuations effectively. Its broad versatility has made it a staple among experienced market participants, who employ it in combination with additional tools and indicators to optimize entry point identification and eliminate false signals.
Successful pattern trading necessitates in-depth analysis, strict risk management, and a keen awareness of market context. Although Quasimodo does not guarantee profit, in conjunction with a well-defined trading strategy, it can play a pivotal role in your Forex trading.
Quasimodo Pattern Trading FAQs
The QML pattern consists of three peaks or troughs, where the second extremum is above or below the first one, and the third level should not cross the first one. The key entry signal is a breakout of the key support or resistance levels.
A Quasimodo reversal chart pattern points to a trend change in the Forex market. It signals the end of the current trend, a potential reversal, and the beginning of the opposite price movement.
The Quasimodo pattern is highly effective if the market context is properly analyzed. However, its efficiency increases when signals are confirmed by additional tools, such as support and resistance levels or tick volume.
The Quasimodo price pattern suggests a possible trend reversal or continuation. It is based on consecutive highs and lows, with a key level breakout serving as confirmation.
Trading the Quasimodo pattern involves entering the market on a breakout of a key level. A stop-loss order can be placed below or above the swing low or high, and a take-profit order can be set at the nearest support or resistance levels. Remember to use additional indicators for confirmation.

The content of this article reflects the author’s opinion and does not necessarily reflect the official position of LiteFinance broker. The material published on this page is provided for informational purposes only and should not be considered as the provision of investment advice for the purposes of Directive 2014/65/EU.
According to copyright law, this article is considered intellectual property, which includes a prohibition on copying and distributing it without consent.
{{value}} ( {{count}} {{title}} )
This post is originally published on LITEFINANCE.


